| Param | Original file | Final file |
|---|---|---|
| Filename | modeM0/AS1A12_052T04_9000005700_41791cztM0_level2.fits | modeM0/AS1A12_052T04_9000005700_41791cztM0_level2_quad_clean.evt |
| Size (bytes) | 2,360,903,040 | 446,345,280 |
| Size | 2.2 GB | 425.7 MB |
| Events in quadrant A | 15,877,015 | 3,127,610 |
| Events in quadrant B | 13,386,964 | 3,192,347 |
| Events in quadrant C | 15,081,343 | 3,019,148 |
| Events in quadrant D | 40,836,674 | 2,205,656 |
| Mode M9 | |||
|---|---|---|---|
| Quadrant | BADHDUFLAG | Total packets | Discarded packets |
| A | 0 | 97 | 0 |
| B | 0 | 96 | 0 |
| C | 0 | 96 | 0 |
| D | 0 | 96 | 0 |
| Mode SS | |||
|---|---|---|---|
| Quadrant | BADHDUFLAG | Total packets | Discarded packets |
| A | 0 | 588 | 0 |
| B | 0 | 588 | 0 |
| C | 0 | 588 | 0 |
| D | 0 | 588 | 0 |
| Mode M0 | |||
|---|---|---|---|
| Quadrant | BADHDUFLAG | Total packets | Discarded packets |
| A | 0 | 64821 | 6 |
| B | 0 | 59841 | 6 |
| C | 0 | 62530 | 6 |
| D | 0 | 141124 | 6 |
| Quadrant | Total seconds | Saturated seconds | Saturation percentage |
|---|---|---|---|
| A | 28632 | 143 | 0.499441% |
| B | 28632 | 98 | 0.342274% |
| C | 28632 | 686 | 2.395921% |
| D | 28632 | 7889 | 27.553087% |
Noise dominated data is calculated using 1-second bins in cleaned event files. If a bin has >2000 counts, and if more than 50% of those come from <1% of pixels, then it is considered to be noise-dominated and hence unusable.
| Quadrant | # 1 sec bins | Bins with >0 counts | Bins with >2000 counts | High rate bins dominated by noise | Noise dominated (total time) | Noise dominated (detector-on time) | Marked lightcurve |
|---|---|---|---|---|---|---|---|
| A | 37437 | 28638 | 88 | 88 | 0.24% | 0.31% | 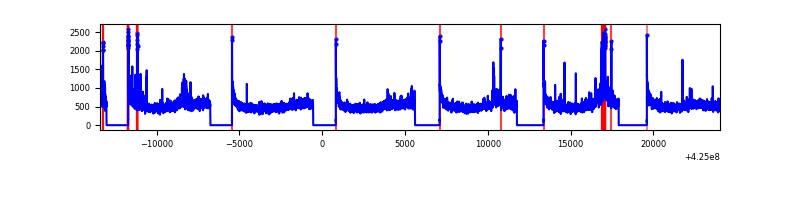 |
| B | 37437 | 28638 | 27 | 27 | 0.07% | 0.09% | 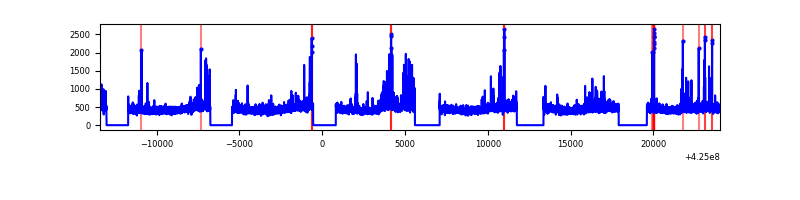 |
| C | 37437 | 28638 | 672 | 672 | 1.80% | 2.35% | 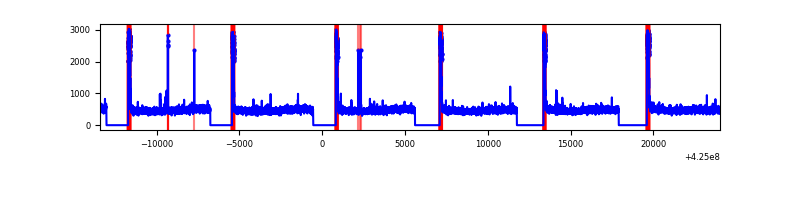 |
| D | 37437 | 28638 | 8807 | 8807 | 23.52% | 30.75% | 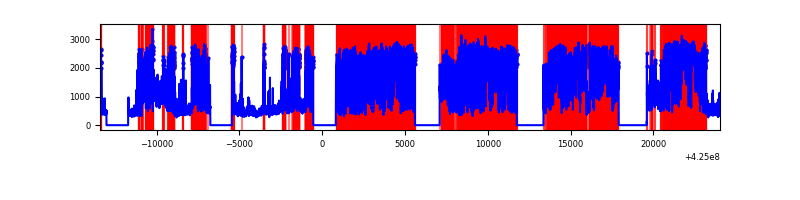 |
Top three noisy pixels from each quadrant. If the there are fewer than three noisy pixels in the level2.evt file, extra rows are filled as -1
| Pixel properties | Quadrant properties | ||||||
|---|---|---|---|---|---|---|---|
| Quadrant | DetID | PixID | Counts | Sigma | Mean | Median | Sigma |
| A | 10 | 83 | 2472595 | 3848.71 | 3162 | 3092 | 641.6 |
| A | 15 | 223 | 1091222 | 1695.85 | 3162 | 3092 | 641.6 |
| A | 2 | 79 | 62321 | 92.31 | 3162 | 3092 | 641.6 |
| B | 0 | 186 | 206144 | 337.69 | 3133 | 3045 | 601.4 |
| B | 0 | 190 | 183020 | 299.24 | 3133 | 3045 | 601.4 |
| B | 0 | 245 | 180575 | 295.17 | 3133 | 3045 | 601.4 |
| C | 0 | 10 | 1929028 | 2736.18 | 3048 | 3064 | 703.9 |
| C | 15 | 214 | 1140635 | 1616.12 | 3048 | 3064 | 703.9 |
| C | 14 | 254 | 59402 | 80.04 | 3048 | 3064 | 703.9 |
| D | 12 | 79 | 27677977 | 39828.0 | 2863 | 2782 | 694.9 |
| D | 1 | 52 | 587923 | 842.09 | 2863 | 2782 | 694.9 |
| D | 13 | 249 | 548365 | 785.16 | 2863 | 2782 | 694.9 |
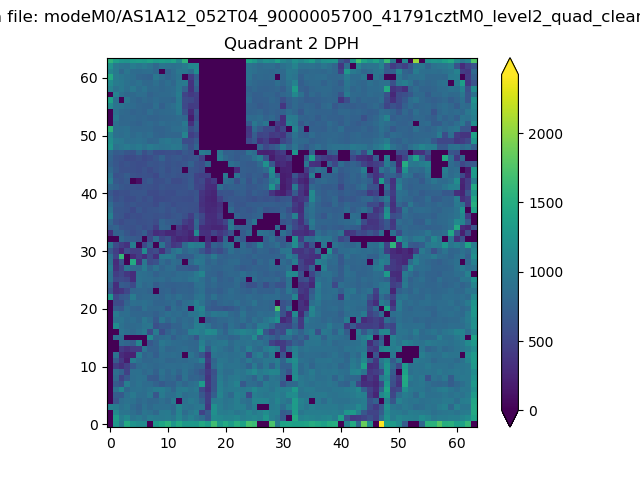
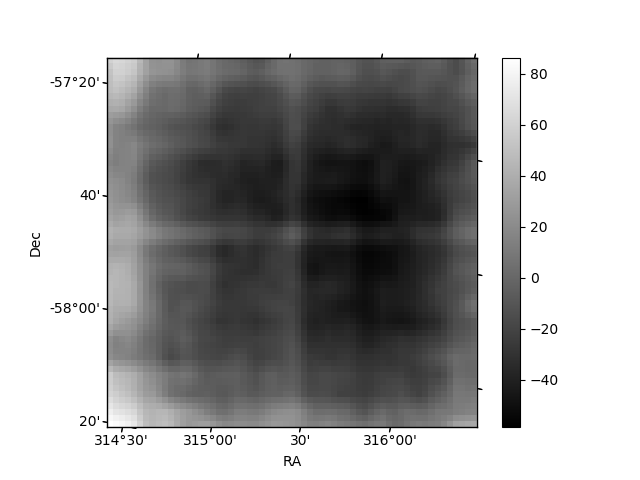
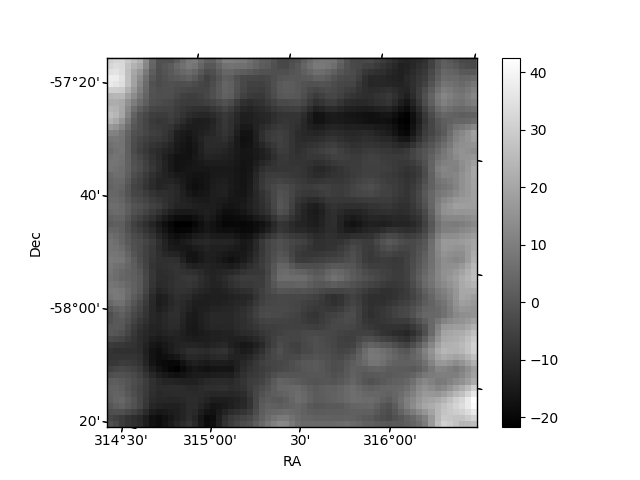
Histogram calculated using DETX and DETY for each event in the final _common_clean file
| Quadrant A | 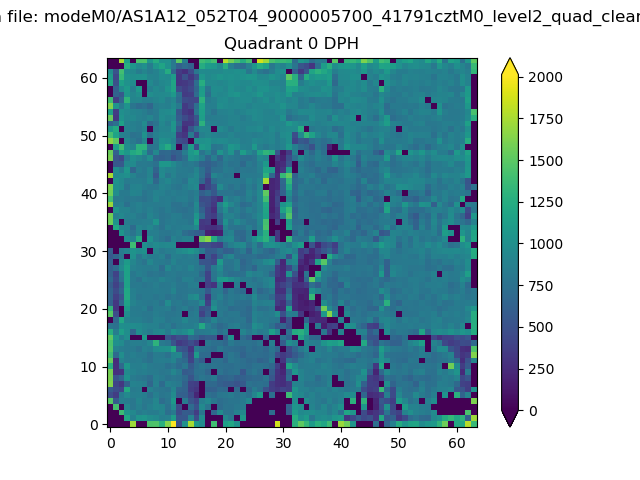 |
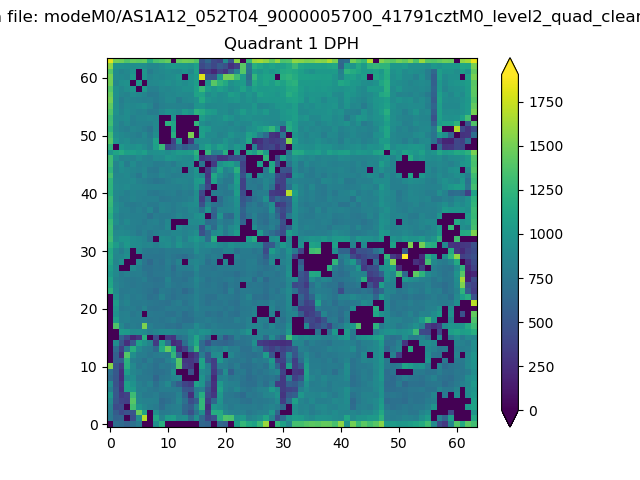 |
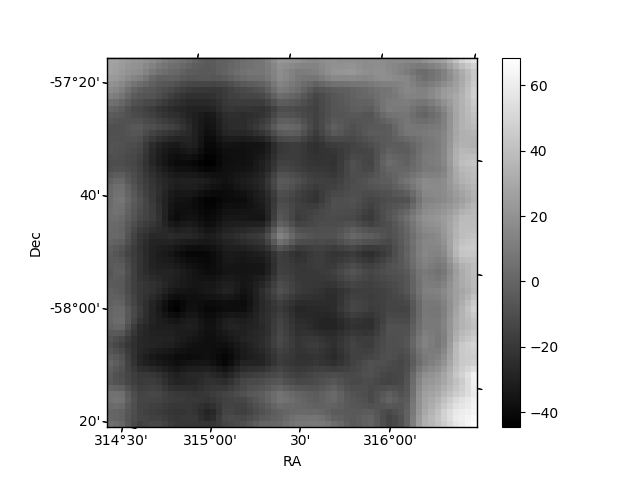
Quadrant B |
|---|---|---|---|
| Quadrant D | 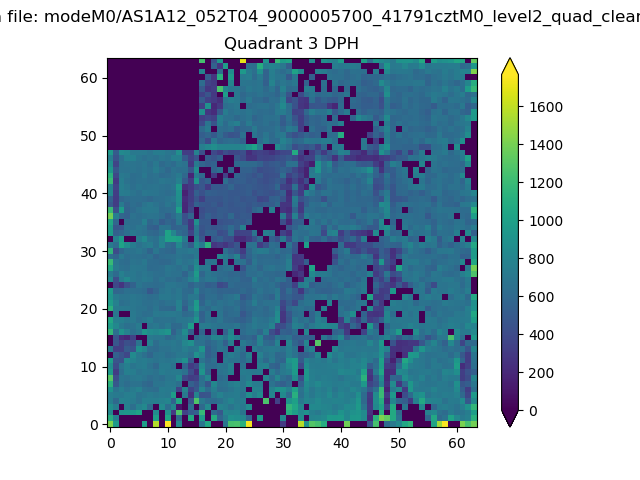 |
 |
Quadrant C |
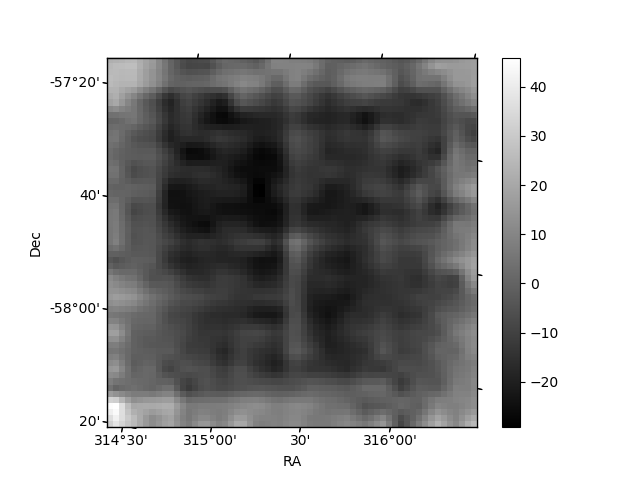
| Plot type | Count rate plots | Images |
|---|---|---|
| Comparison with Poisson distribution Blue bars denote a histogram of data divided into 1 sec bins. Red curve is a Poisson curve with rate = median count rate of data. |
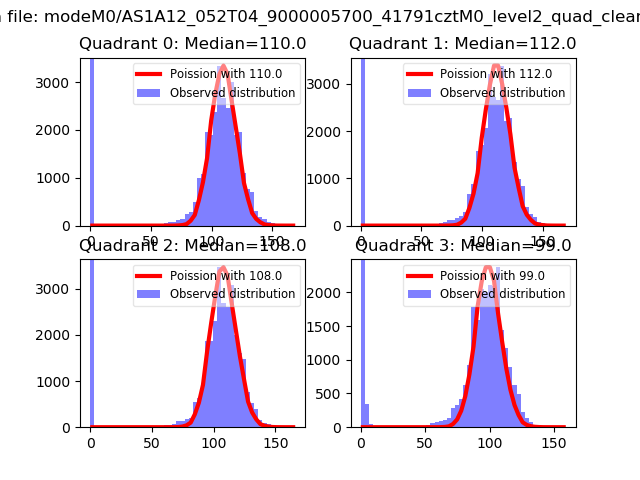 |
 |
| Quadrant-wise count rates Data is divided into 100 sec bins |
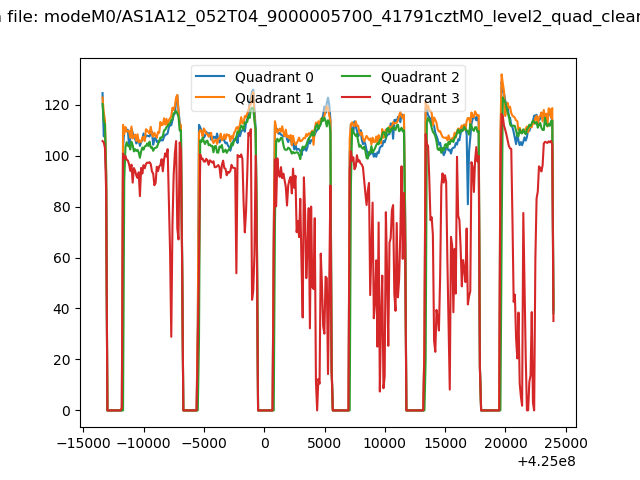 |
|
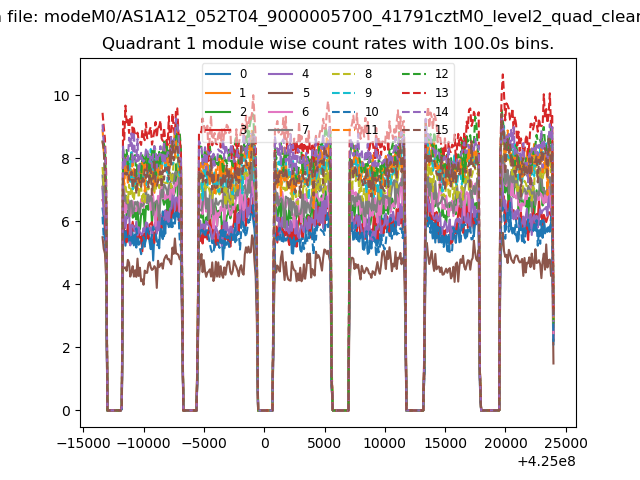
| Module-wise count rates for Quadrant A Data is divided into 100 sec bins |
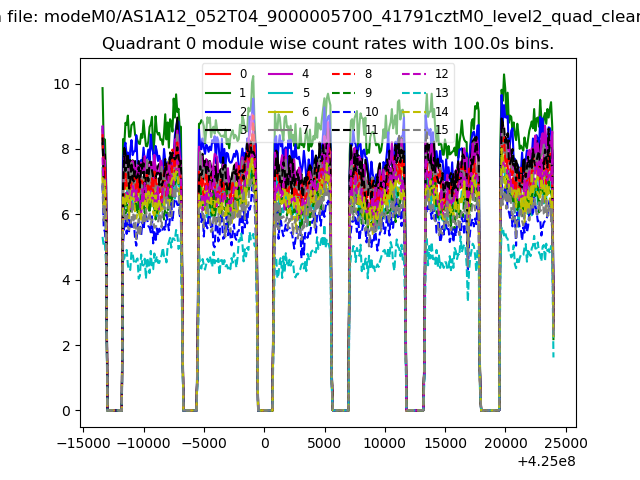 |
 |
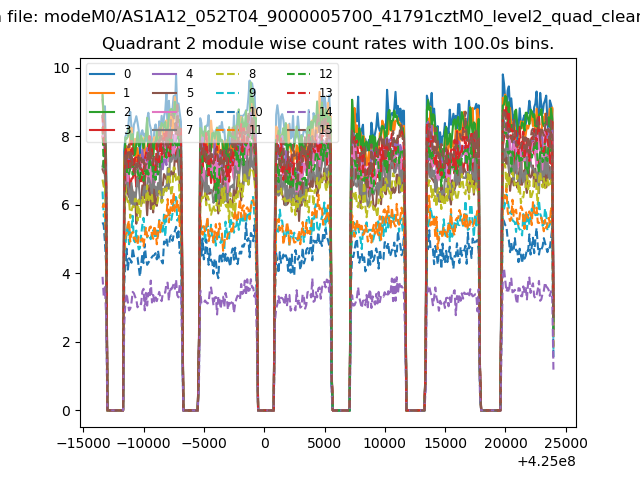
| Module-wise count rates for Quadrant B Data is divided into 100 sec bins |
 |
 |
| Module-wise count rates for Quadrant C Data is divided into 100 sec bins |
 |
 |
| Module-wise count rates for Quadrant D Data is divided into 100 sec bins |
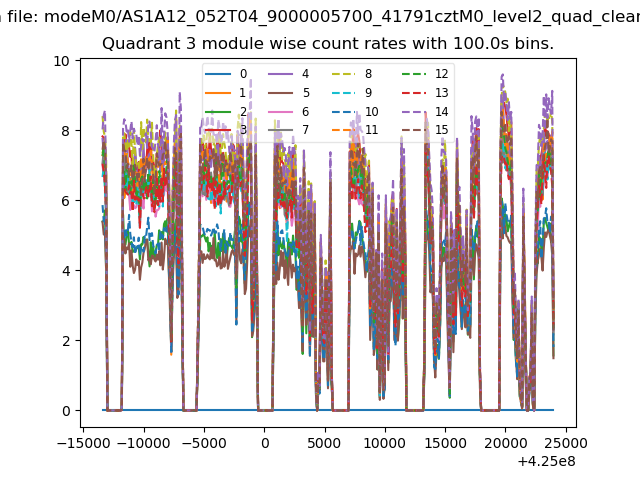 |
 |
| Parameter | Plot |
|---|---|
| CZT HV Monitor | 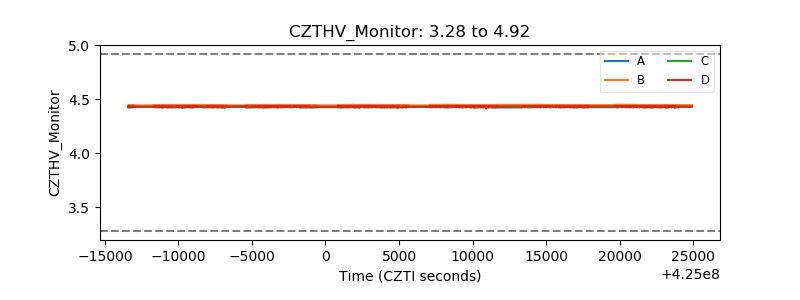 |
| D_VDD | 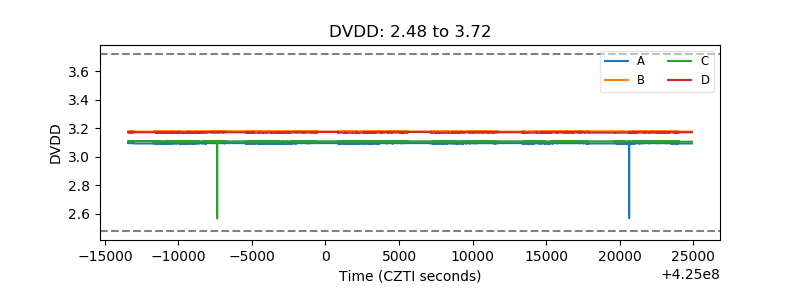 |
| Temperature 1 | 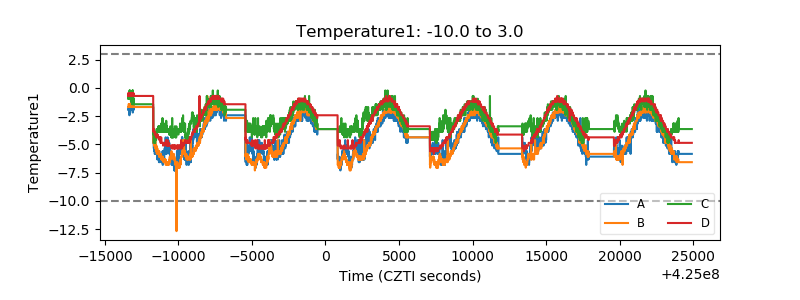 |
| Veto HV Monitor | 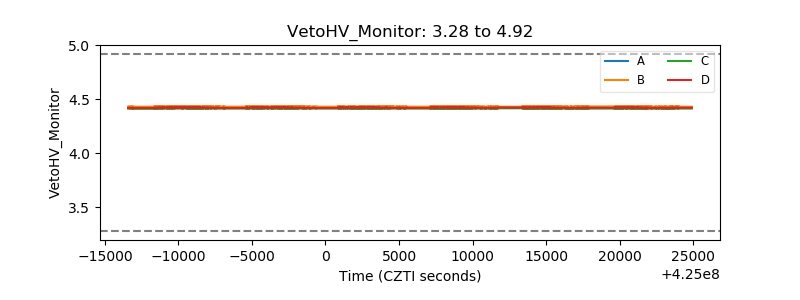 |
| Veto LLD | 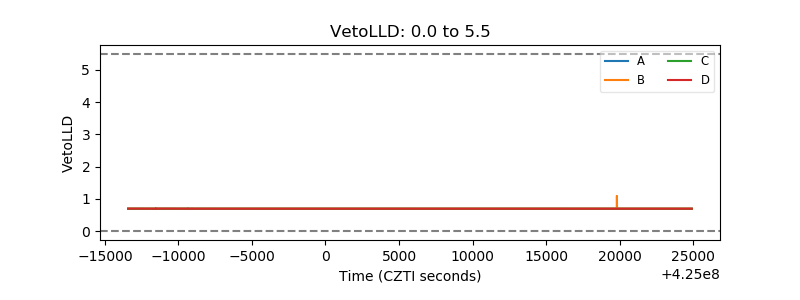 |
| Alpha Counter | 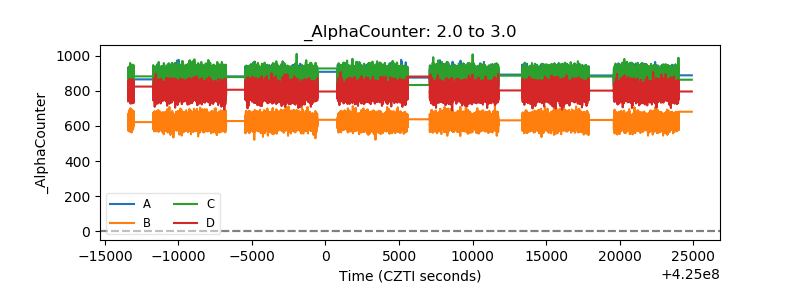 |
| _CPM_Rate | 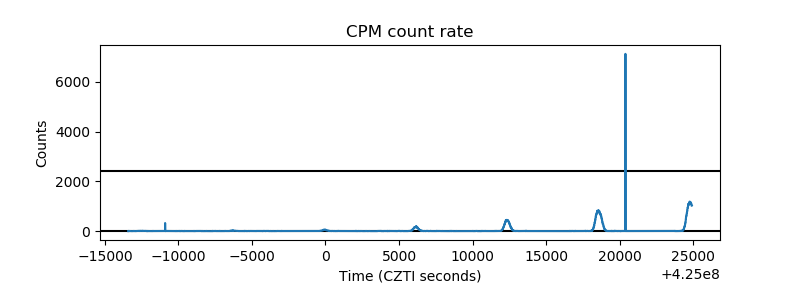 |
| CZT Counter | 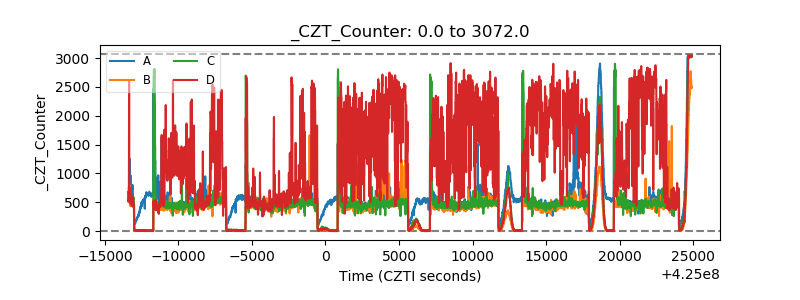 |
| +2.5 Volts monitor | 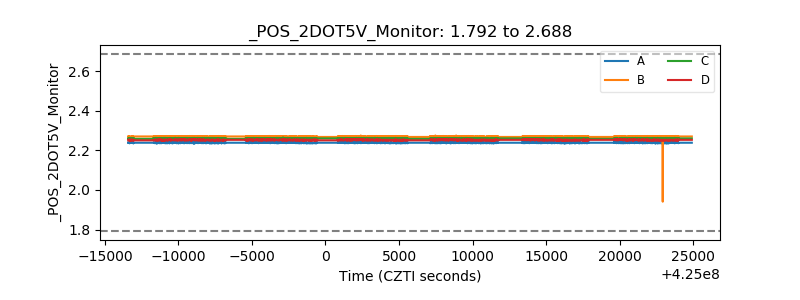 |
| +5 Volts monitor | 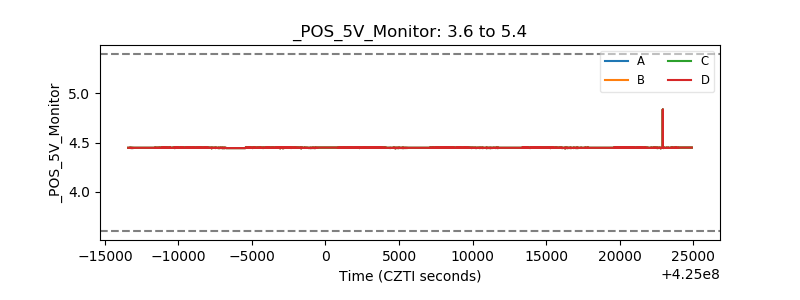 |
| _ROLL_ROT | 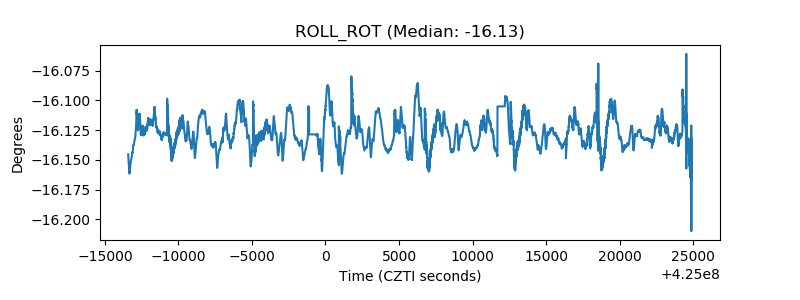 |
| _Roll_DEC | 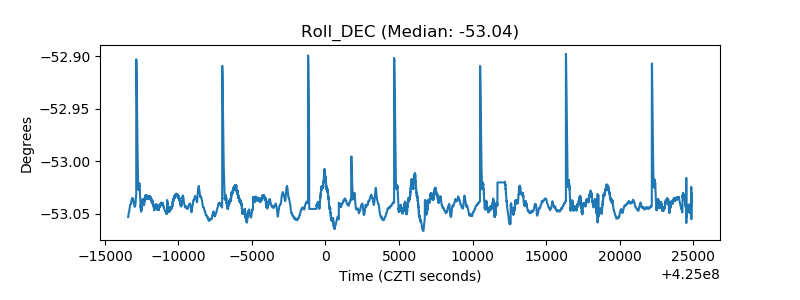 |
| _Roll_RA | 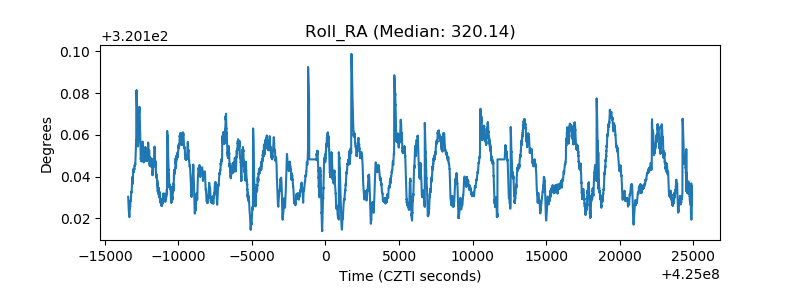 |
| Veto Counter | 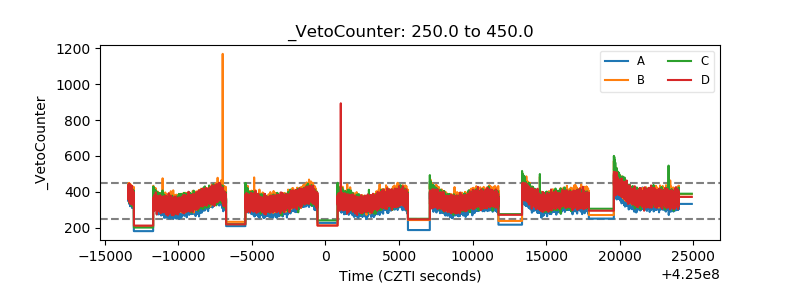 |