| Param | Original file | Final file |
|---|---|---|
| Filename | modeM0/AS1A12_052T04_9000005700_41792cztM0_level2.fits | modeM0/AS1A12_052T04_9000005700_41792cztM0_level2_quad_clean.evt |
| Size (bytes) | 311,978,880 | 90,138,240 |
| Size | 297.5 MB | 86.0 MB |
| Events in quadrant A | 2,851,648 | 618,195 |
| Events in quadrant B | 2,497,331 | 627,865 |
| Events in quadrant C | 3,029,136 | 573,618 |
| Events in quadrant D | 2,778,040 | 557,399 |
| Mode M9 | |||
|---|---|---|---|
| Quadrant | BADHDUFLAG | Total packets | Discarded packets |
| A | 0 | 37 | 0 |
| B | 0 | 37 | 0 |
| C | 0 | 37 | 0 |
| D | 0 | 37 | 0 |
| Mode SS | |||
|---|---|---|---|
| Quadrant | BADHDUFLAG | Total packets | Discarded packets |
| A | 0 | 102 | 0 |
| B | 0 | 102 | 0 |
| C | 0 | 102 | 0 |
| D | 0 | 102 | 0 |
| Mode M0 | |||
|---|---|---|---|
| Quadrant | BADHDUFLAG | Total packets | Discarded packets |
| A | 0 | 11319 | 3 |
| B | 0 | 10570 | 2 |
| C | 0 | 11894 | 2 |
| D | 0 | 11563 | 2 |
| Quadrant | Total seconds | Saturated seconds | Saturation percentage |
|---|---|---|---|
| A | 5031 | 11 | 0.218644% |
| B | 5031 | 16 | 0.318028% |
| C | 5031 | 231 | 4.591532% |
| D | 5031 | 56 | 1.113099% |
Noise dominated data is calculated using 1-second bins in cleaned event files. If a bin has >2000 counts, and if more than 50% of those come from <1% of pixels, then it is considered to be noise-dominated and hence unusable.
| Quadrant | # 1 sec bins | Bins with >0 counts | Bins with >2000 counts | High rate bins dominated by noise | Noise dominated (total time) | Noise dominated (detector-on time) | Marked lightcurve |
|---|---|---|---|---|---|---|---|
| A | 7003 | 5032 | 3 | 3 | 0.04% | 0.06% | 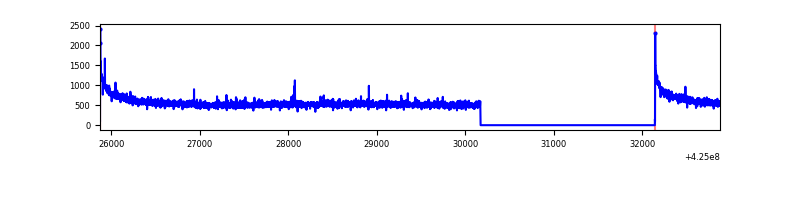 |
| B | 7003 | 5032 | 7 | 7 | 0.10% | 0.14% | 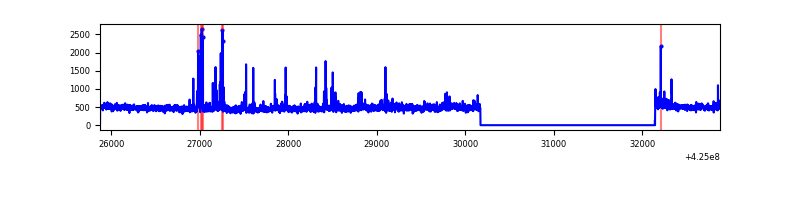 |
| C | 7003 | 5032 | 228 | 228 | 3.26% | 4.53% | 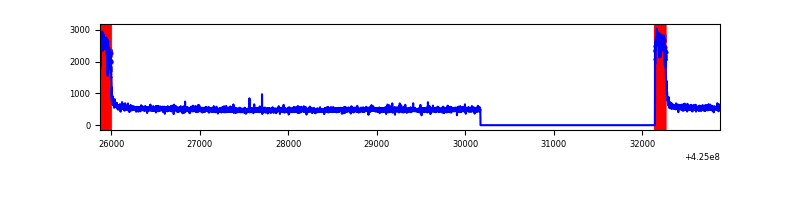 |
| D | 7003 | 5032 | 54 | 54 | 0.77% | 1.07% | 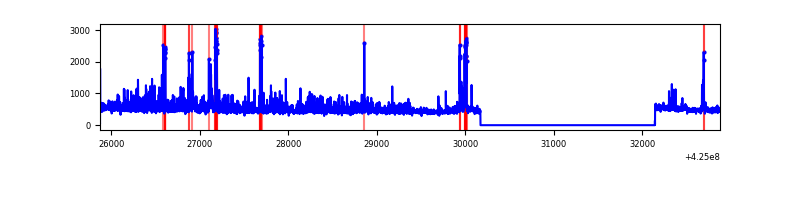 |
Top three noisy pixels from each quadrant. If the there are fewer than three noisy pixels in the level2.evt file, extra rows are filled as -1
| Pixel properties | Quadrant properties | ||||||
|---|---|---|---|---|---|---|---|
| Quadrant | DetID | PixID | Counts | Sigma | Mean | Median | Sigma |
| A | 10 | 83 | 533119 | 4444.19 | 592 | 581 | 119.8 |
| A | 2 | 79 | 17221 | 138.87 | 592 | 581 | 119.8 |
| A | 13 | 254 | 8326 | 64.63 | 592 | 581 | 119.8 |
| B | 4 | 171 | 89172 | 792.2 | 582 | 566 | 111.8 |
| B | 0 | 186 | 40200 | 354.36 | 582 | 566 | 111.8 |
| B | 0 | 245 | 34017 | 299.08 | 582 | 566 | 111.8 |
| C | 0 | 10 | 642825 | 5010.26 | 558 | 563 | 128.2 |
| C | 15 | 214 | 203886 | 1586.12 | 558 | 563 | 128.2 |
| C | 12 | 249 | 4304 | 29.18 | 558 | 563 | 128.2 |
| D | 12 | 79 | 252954 | 1795.11 | 578 | 561 | 140.6 |
| D | 13 | 249 | 197540 | 1400.99 | 578 | 561 | 140.6 |
| D | 2 | 249 | 31843 | 222.49 | 578 | 561 | 140.6 |
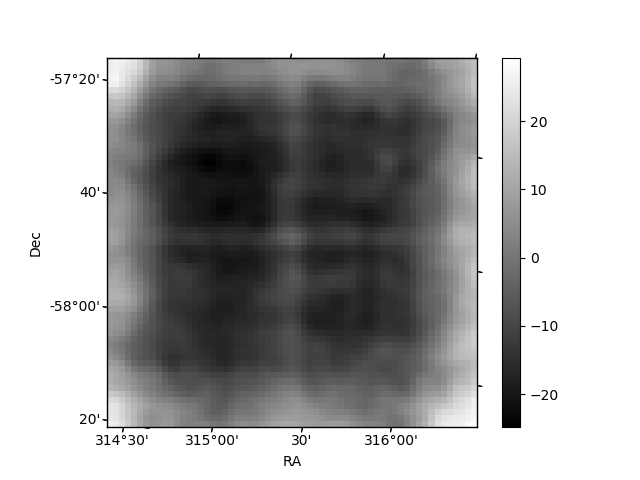
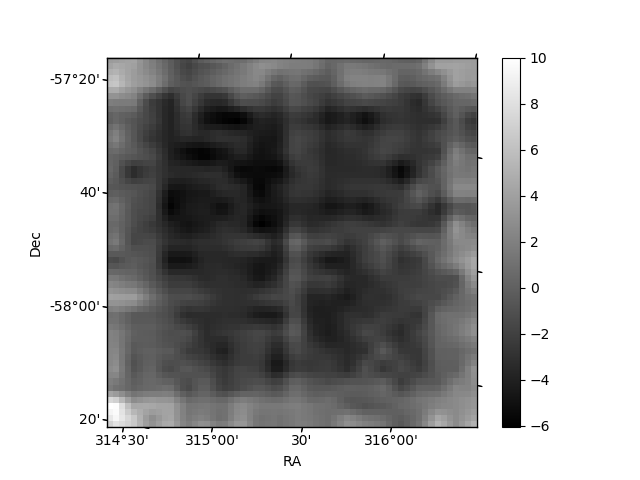
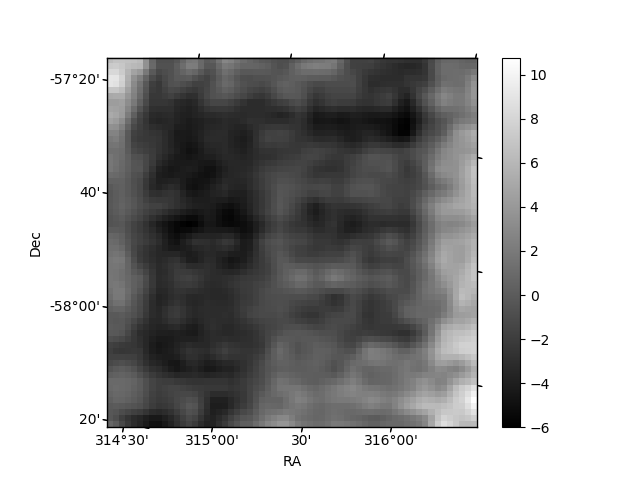
Histogram calculated using DETX and DETY for each event in the final _common_clean file
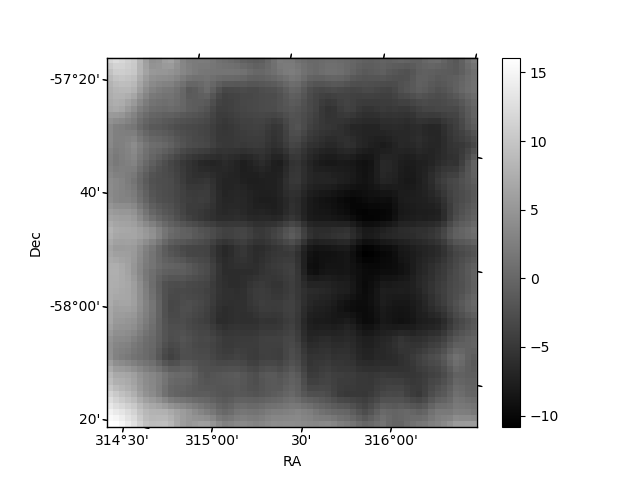
| Quadrant A | 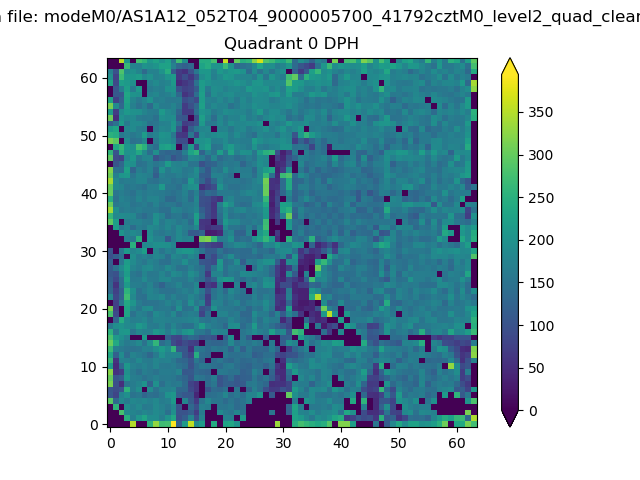 |
 |
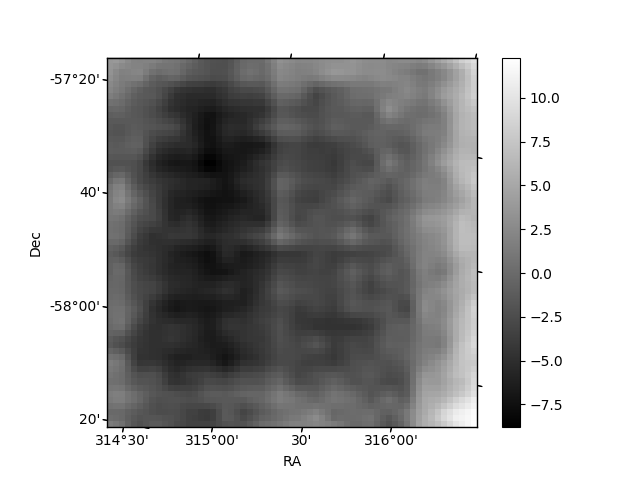
Quadrant B |
|---|---|---|---|
| Quadrant D | 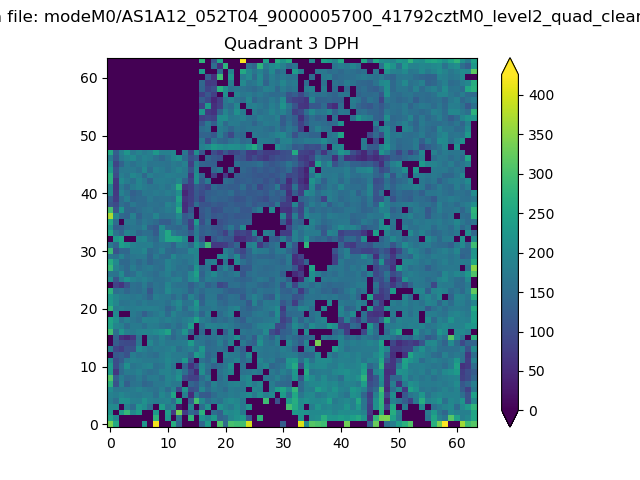 |
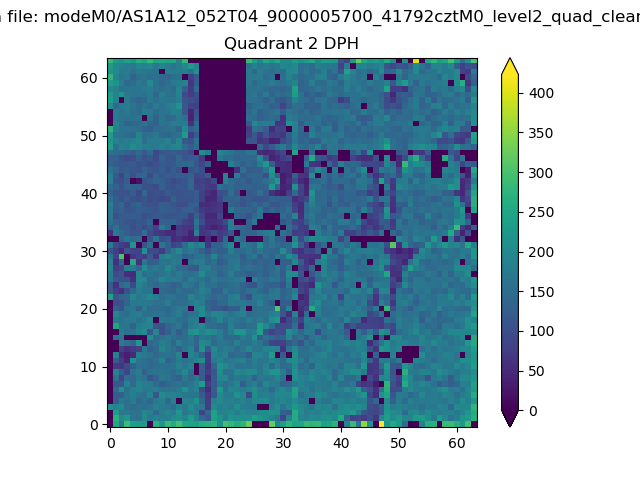 |
Quadrant C |
| Plot type | Count rate plots | Images |
|---|---|---|
| Comparison with Poisson distribution Blue bars denote a histogram of data divided into 1 sec bins. Red curve is a Poisson curve with rate = median count rate of data. |
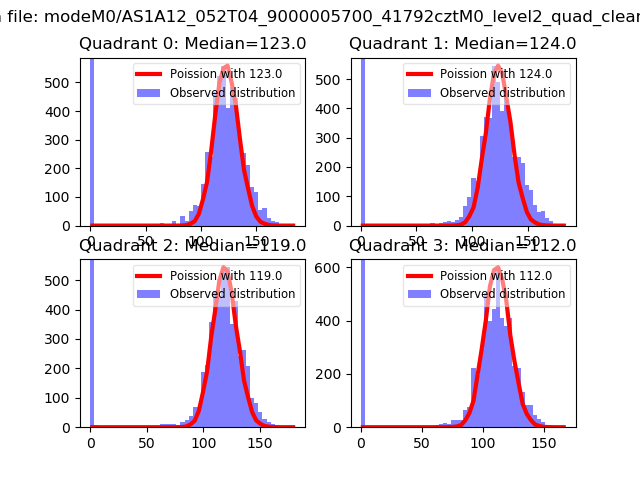 |
 |
| Quadrant-wise count rates Data is divided into 100 sec bins |
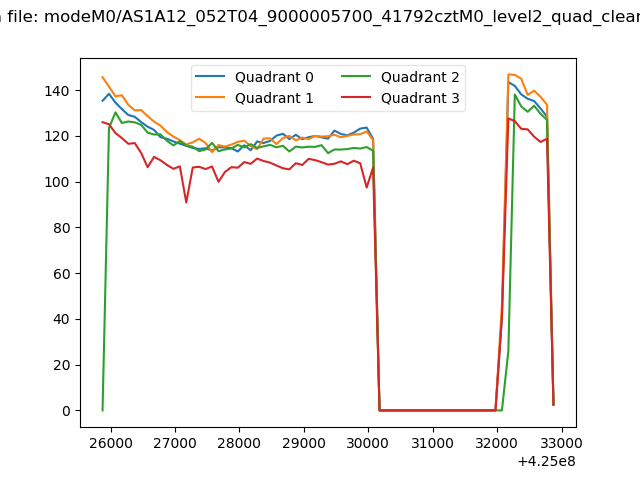 |
|
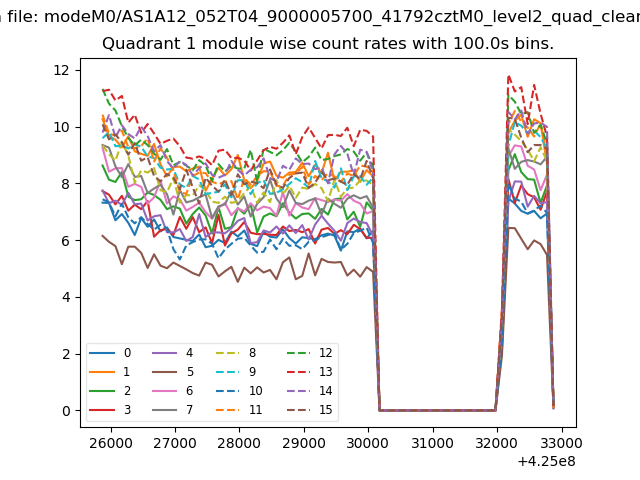
| Module-wise count rates for Quadrant A Data is divided into 100 sec bins |
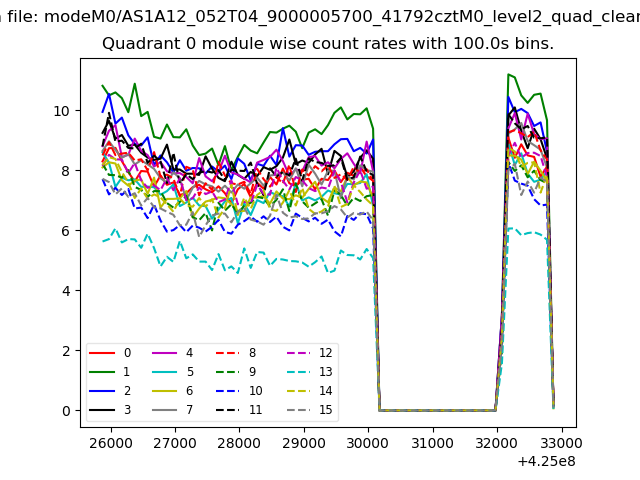 |
 |
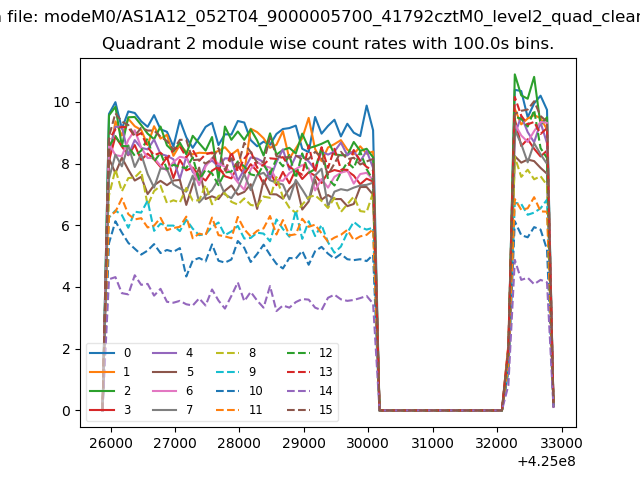
| Module-wise count rates for Quadrant B Data is divided into 100 sec bins |
 |
 |
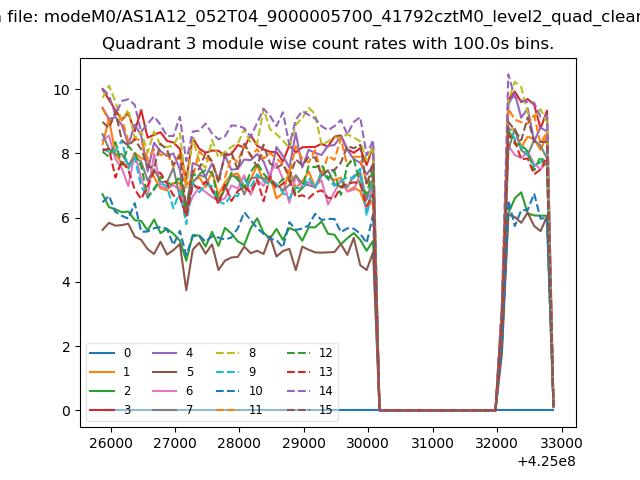
| Module-wise count rates for Quadrant C Data is divided into 100 sec bins |
 |
 |
| Module-wise count rates for Quadrant D Data is divided into 100 sec bins |
 |
 |
| Parameter | Plot |
|---|---|
| CZT HV Monitor | 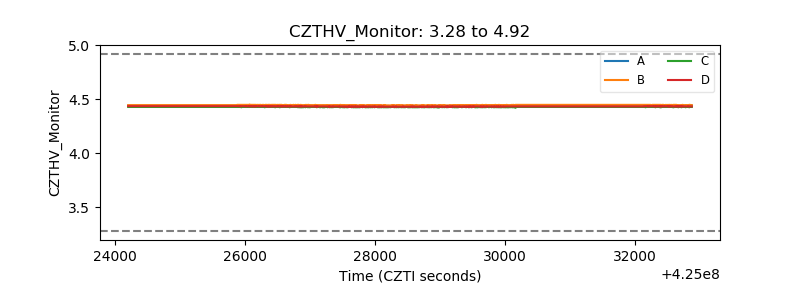 |
| D_VDD | 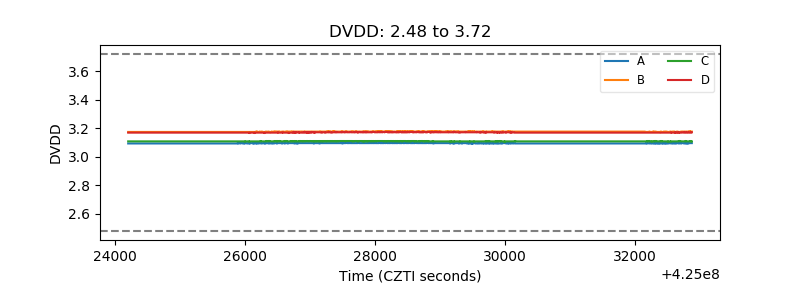 |
| Temperature 1 | 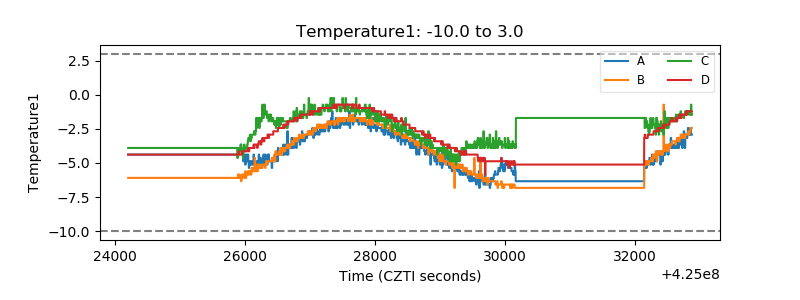 |
| Veto HV Monitor | 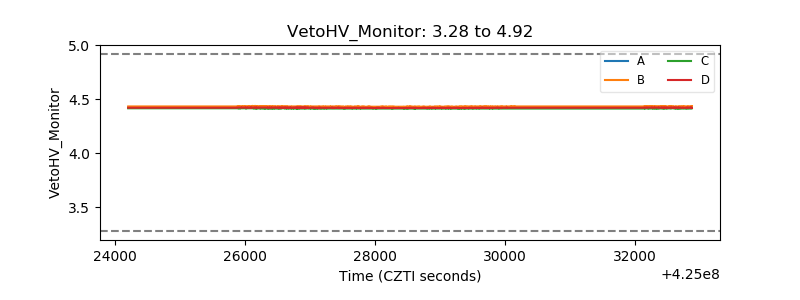 |
| Veto LLD | 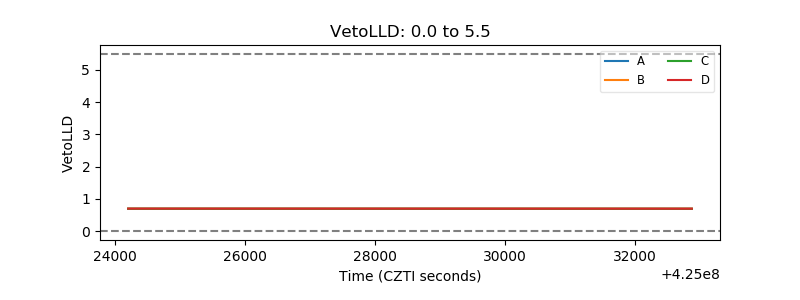 |
| Alpha Counter | 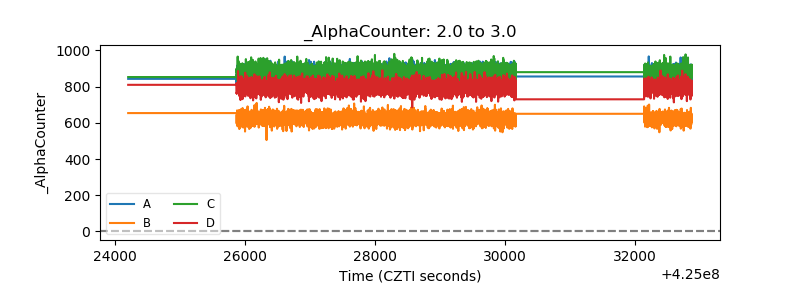 |
| _CPM_Rate | 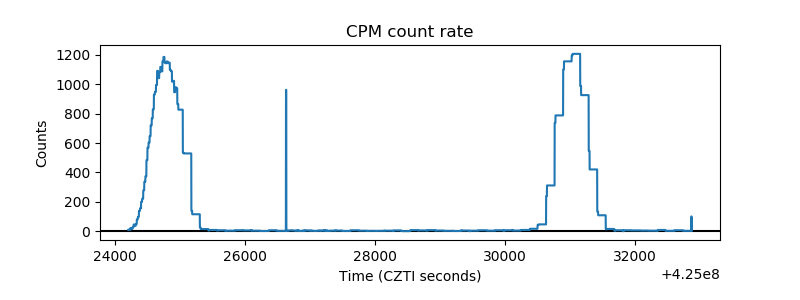 |
| CZT Counter | 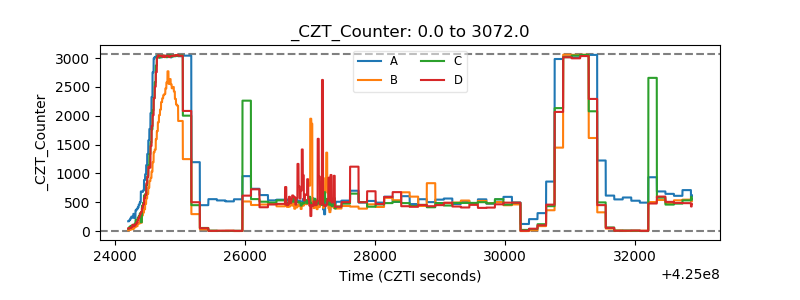 |
| +2.5 Volts monitor | 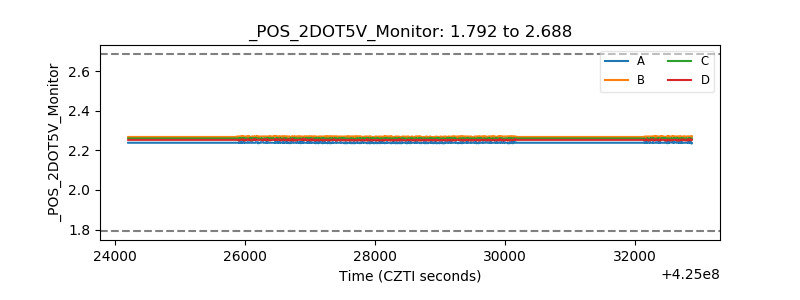 |
| +5 Volts monitor | 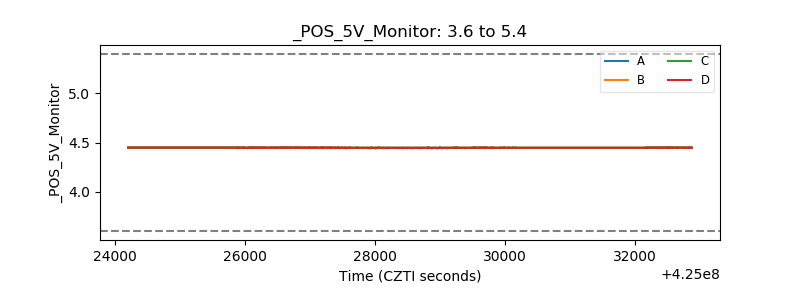 |
| _ROLL_ROT | 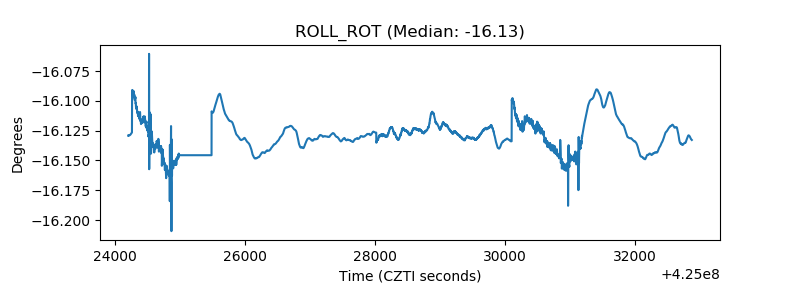 |
| _Roll_DEC | 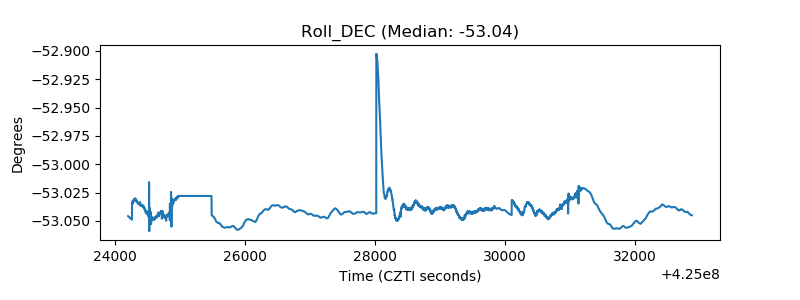 |
| _Roll_RA | 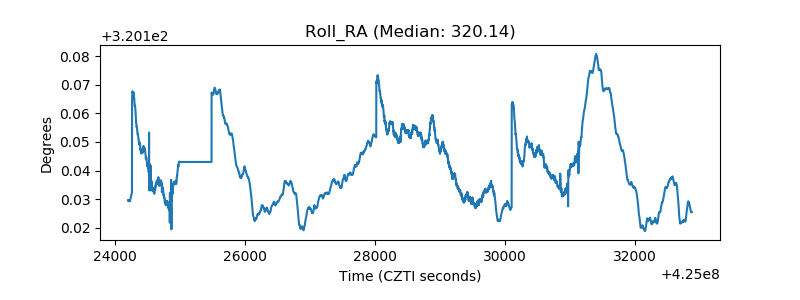 |
| Veto Counter | 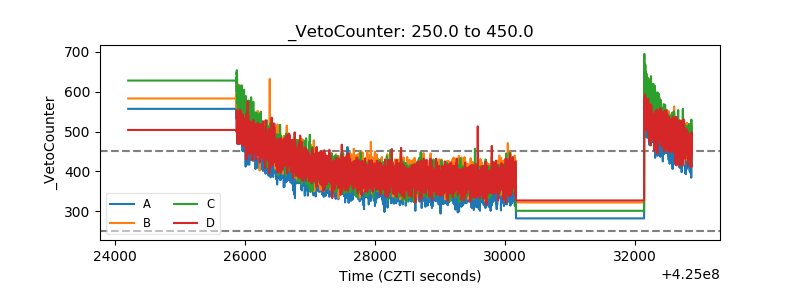 |