| Param | Original file | Final file |
|---|---|---|
| Filename | modeM0/AS1A12_052T04_9000005700_41793cztM0_level2.fits | modeM0/AS1A12_052T04_9000005700_41793cztM0_level2_quad_clean.evt |
| Size (bytes) | 316,370,880 | 93,726,720 |
| Size | 301.7 MB | 89.4 MB |
| Events in quadrant A | 2,924,803 | 644,954 |
| Events in quadrant B | 2,565,645 | 654,215 |
| Events in quadrant C | 3,155,887 | 597,813 |
| Events in quadrant D | 2,664,666 | 581,942 |
| Mode M9 | |||
|---|---|---|---|
| Quadrant | BADHDUFLAG | Total packets | Discarded packets |
| A | 0 | 25 | 0 |
| B | 0 | 26 | 0 |
| C | 0 | 26 | 0 |
| D | 0 | 26 | 0 |
| Mode SS | |||
|---|---|---|---|
| Quadrant | BADHDUFLAG | Total packets | Discarded packets |
| A | 0 | 104 | 0 |
| B | 0 | 104 | 0 |
| C | 0 | 104 | 0 |
| D | 0 | 104 | 0 |
| Mode M0 | |||
|---|---|---|---|
| Quadrant | BADHDUFLAG | Total packets | Discarded packets |
| A | 0 | 11643 | 2 |
| B | 0 | 10840 | 2 |
| C | 0 | 12259 | 2 |
| D | 0 | 11246 | 2 |
| Quadrant | Total seconds | Saturated seconds | Saturation percentage |
|---|---|---|---|
| A | 5130 | 15 | 0.292398% |
| B | 5130 | 15 | 0.292398% |
| C | 5130 | 253 | 4.931774% |
| D | 5130 | 60 | 1.169591% |
Noise dominated data is calculated using 1-second bins in cleaned event files. If a bin has >2000 counts, and if more than 50% of those come from <1% of pixels, then it is considered to be noise-dominated and hence unusable.
| Quadrant | # 1 sec bins | Bins with >0 counts | Bins with >2000 counts | High rate bins dominated by noise | Noise dominated (total time) | Noise dominated (detector-on time) | Marked lightcurve |
|---|---|---|---|---|---|---|---|
| A | 7223 | 5131 | 2 | 2 | 0.03% | 0.04% | 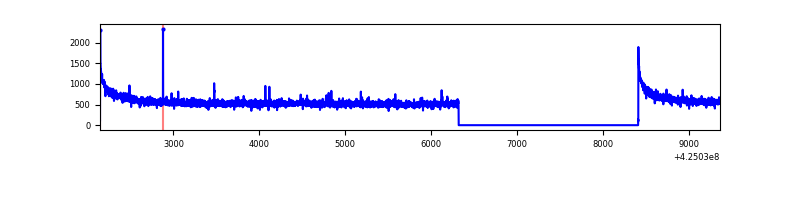 |
| B | 7223 | 5131 | 2 | 2 | 0.03% | 0.04% | 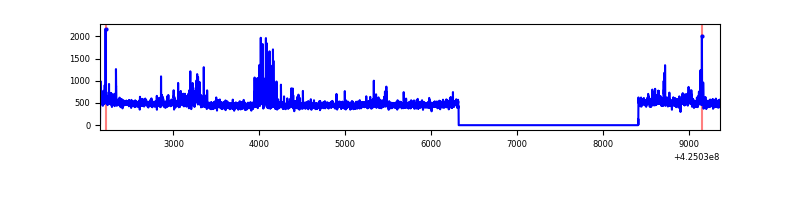 |
| C | 7223 | 5131 | 247 | 247 | 3.42% | 4.81% | 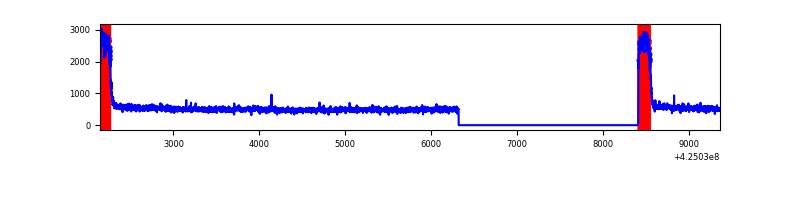 |
| D | 7223 | 5131 | 53 | 53 | 0.73% | 1.03% | 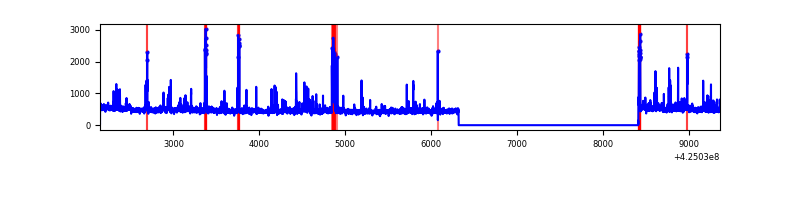 |
Top three noisy pixels from each quadrant. If the there are fewer than three noisy pixels in the level2.evt file, extra rows are filled as -1
| Pixel properties | Quadrant properties | ||||||
|---|---|---|---|---|---|---|---|
| Quadrant | DetID | PixID | Counts | Sigma | Mean | Median | Sigma |
| A | 10 | 83 | 539422 | 4361.03 | 612 | 600 | 123.6 |
| A | 2 | 79 | 13597 | 105.19 | 612 | 600 | 123.6 |
| A | 13 | 254 | 7694 | 57.42 | 612 | 600 | 123.6 |
| B | 0 | 245 | 86719 | 758.3 | 601 | 585 | 113.6 |
| B | 15 | 85 | 38362 | 332.58 | 601 | 585 | 113.6 |
| B | 0 | 186 | 37133 | 321.76 | 601 | 585 | 113.6 |
| C | 0 | 10 | 730473 | 5592.54 | 569 | 573 | 130.5 |
| C | 15 | 214 | 203579 | 1555.44 | 569 | 573 | 130.5 |
| C | 12 | 249 | 4426 | 29.52 | 569 | 573 | 130.5 |
| D | 2 | 249 | 119244 | 824.18 | 595 | 578 | 144.0 |
| D | 13 | 249 | 111904 | 773.2 | 595 | 578 | 144.0 |
| D | 12 | 79 | 65279 | 449.37 | 595 | 578 | 144.0 |
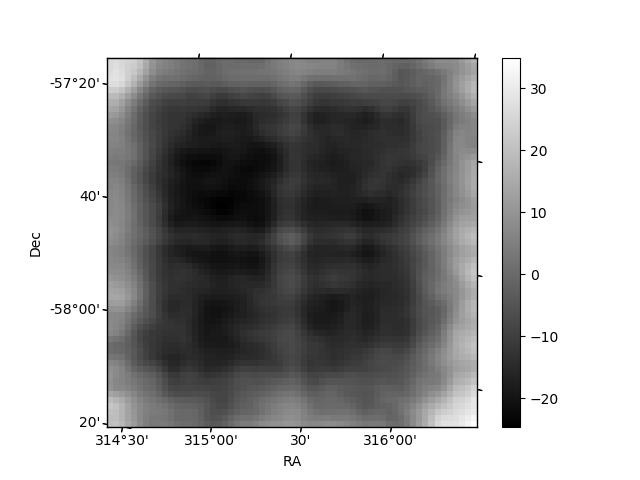
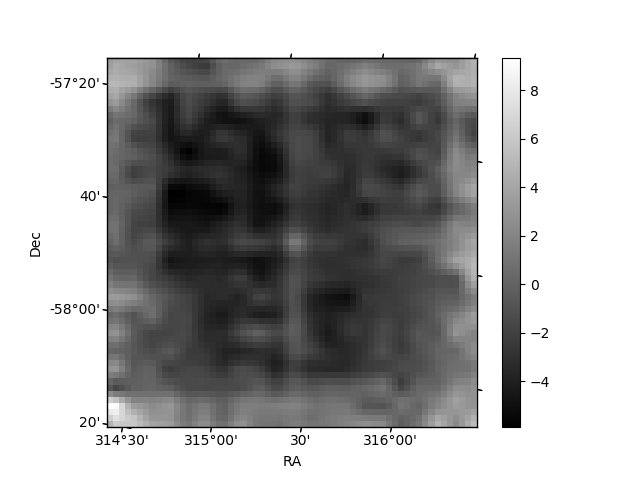
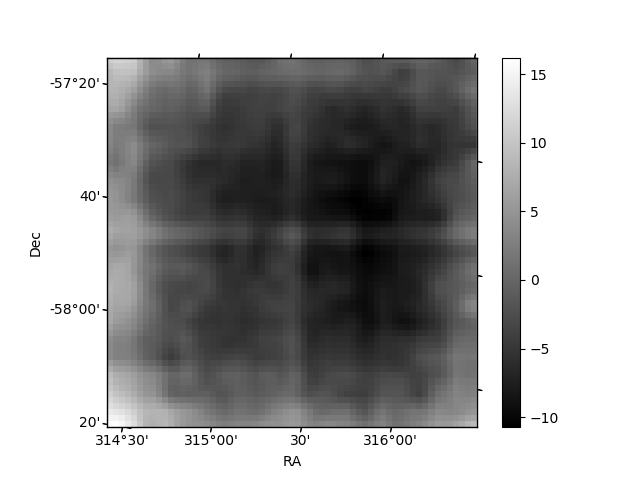
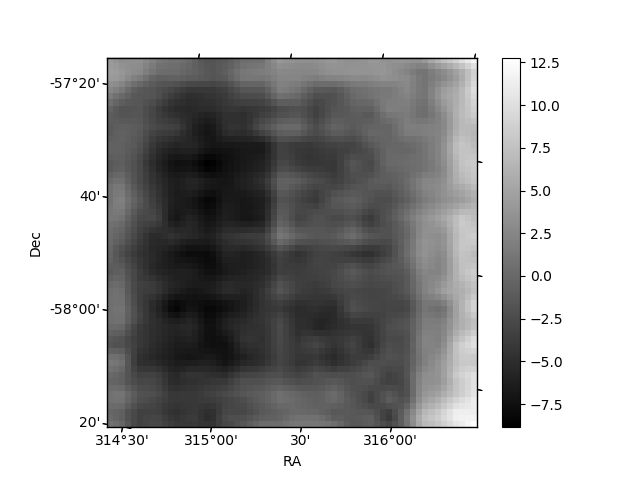
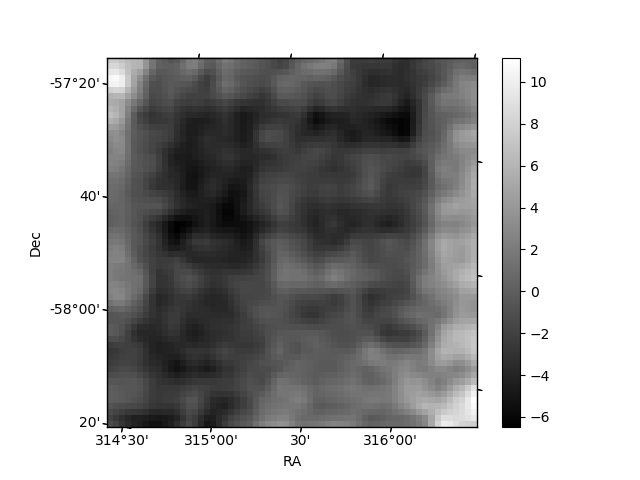
Histogram calculated using DETX and DETY for each event in the final _common_clean file
| Quadrant A | 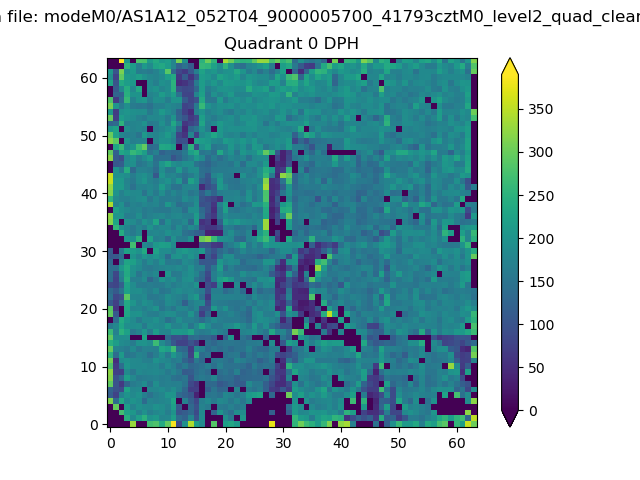 |
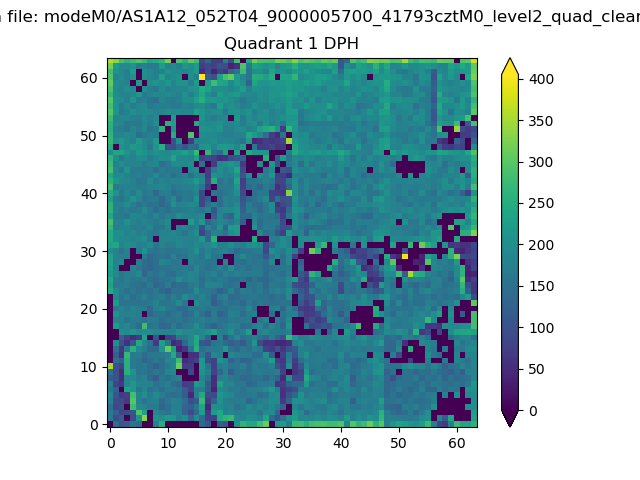 |
Quadrant B |
|---|---|---|---|
| Quadrant D | 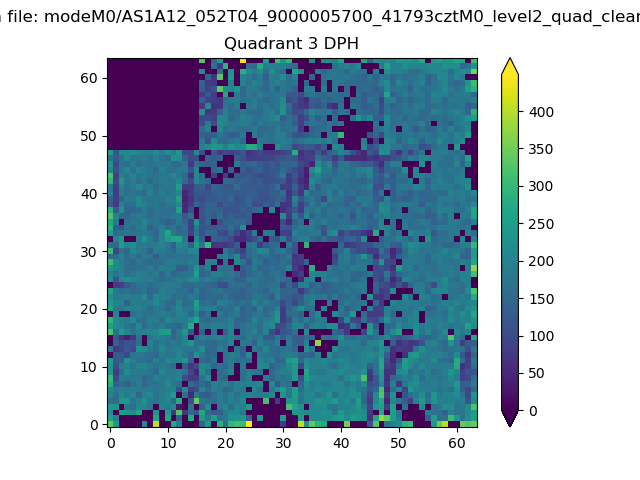 |
 |
Quadrant C |
| Plot type | Count rate plots | Images |
|---|---|---|
| Comparison with Poisson distribution Blue bars denote a histogram of data divided into 1 sec bins. Red curve is a Poisson curve with rate = median count rate of data. |
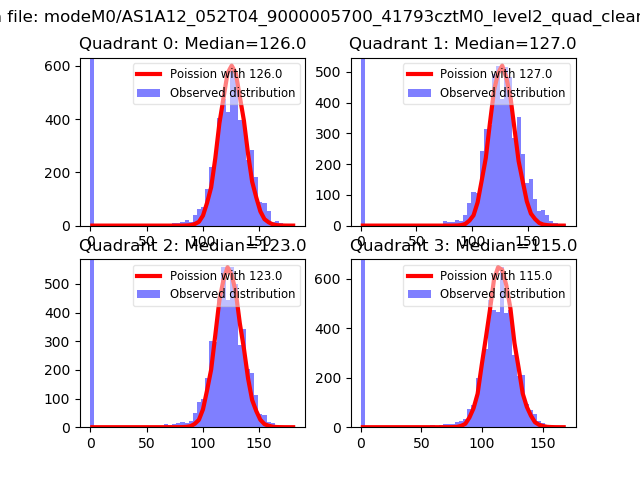 |
 |
| Quadrant-wise count rates Data is divided into 100 sec bins |
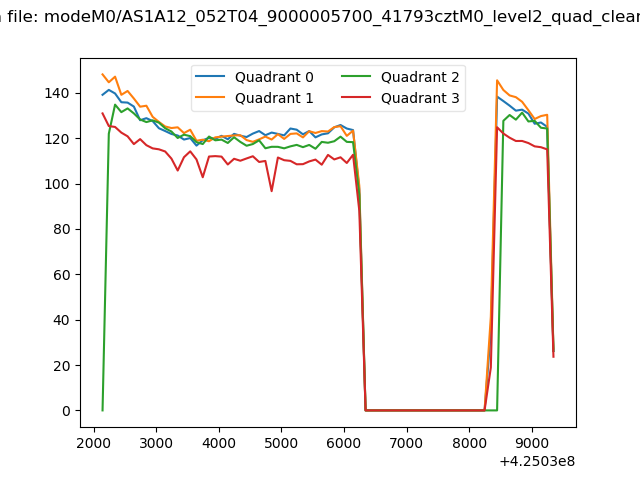 |
|
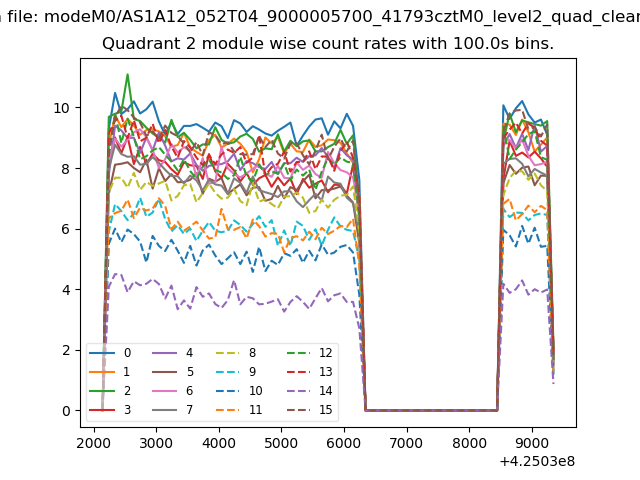
| Module-wise count rates for Quadrant A Data is divided into 100 sec bins |
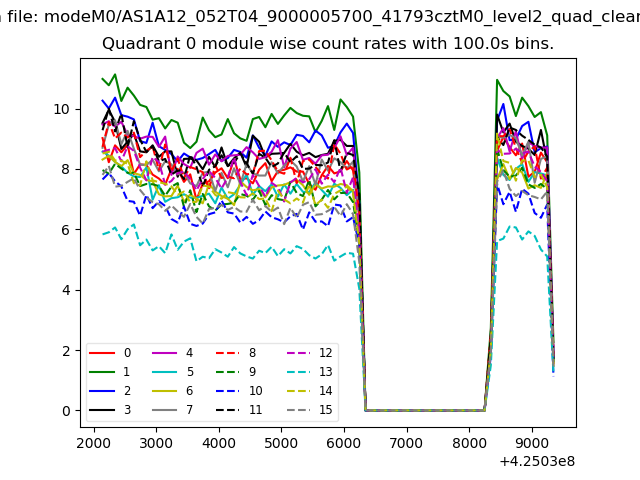 |
 |
| Module-wise count rates for Quadrant B Data is divided into 100 sec bins |
 |
 |
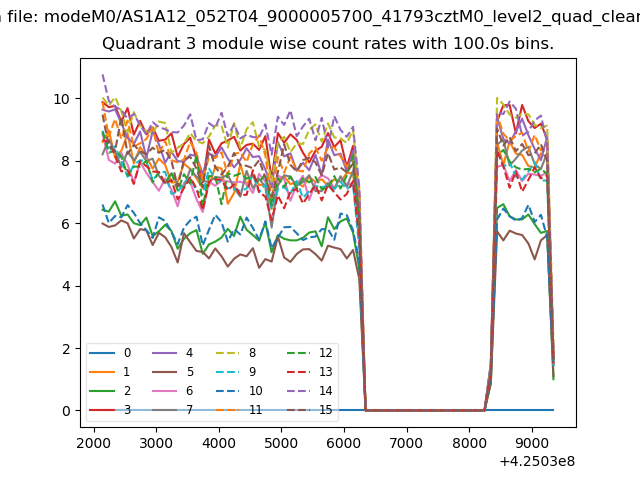
| Module-wise count rates for Quadrant C Data is divided into 100 sec bins |
 |
 |
| Module-wise count rates for Quadrant D Data is divided into 100 sec bins |
 |
 |
| Parameter | Plot |
|---|---|
| CZT HV Monitor |  |
| D_VDD | 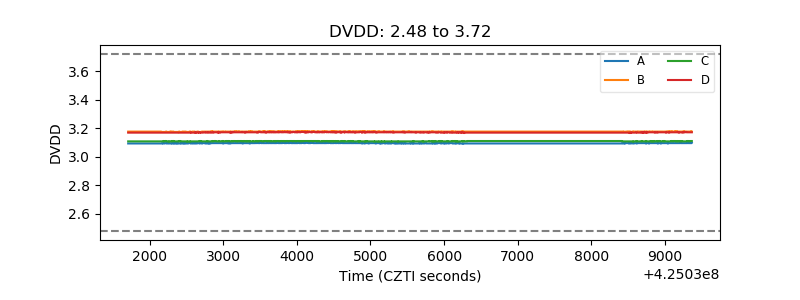 |
| Temperature 1 | 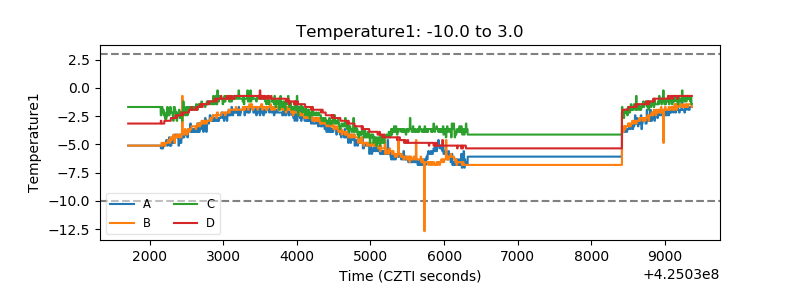 |
| Veto HV Monitor | 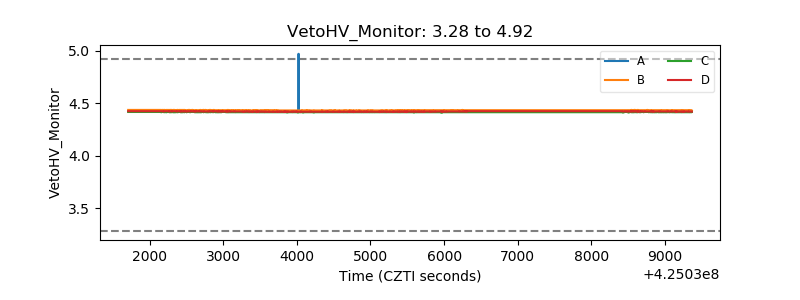 |
| Veto LLD | 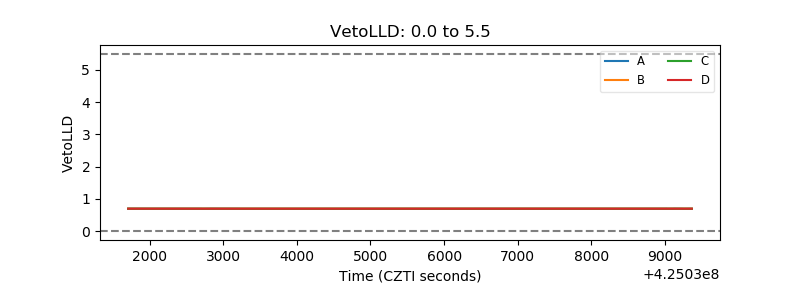 |
| Alpha Counter | 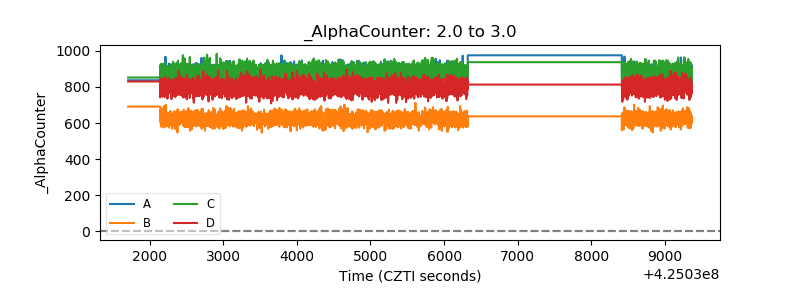 |
| _CPM_Rate | 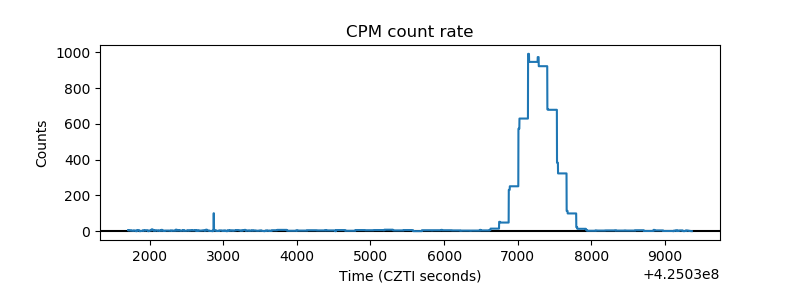 |
| CZT Counter | 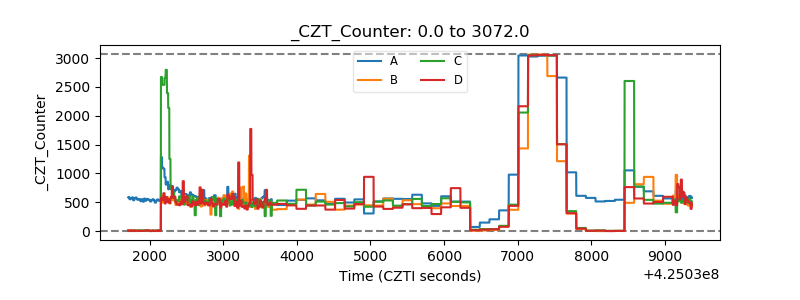 |
| +2.5 Volts monitor | 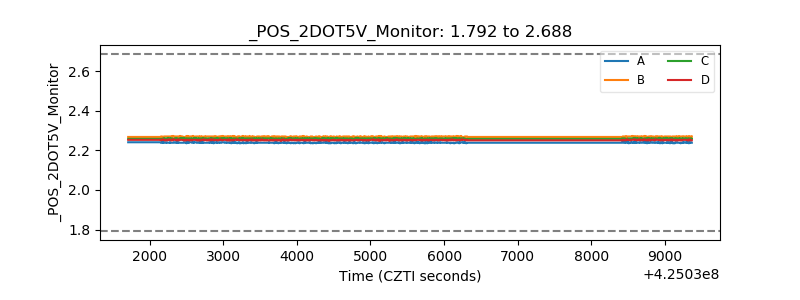 |
| +5 Volts monitor | 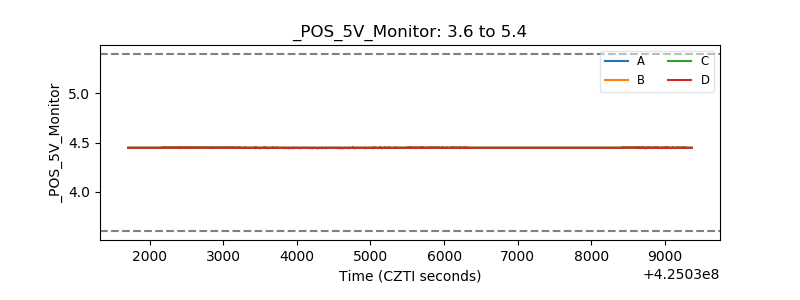 |
| _ROLL_ROT | 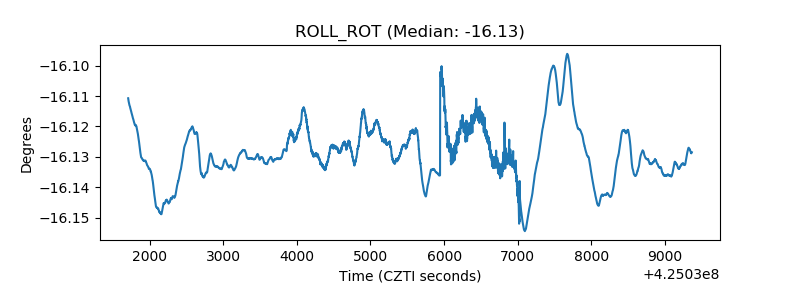 |
| _Roll_DEC | 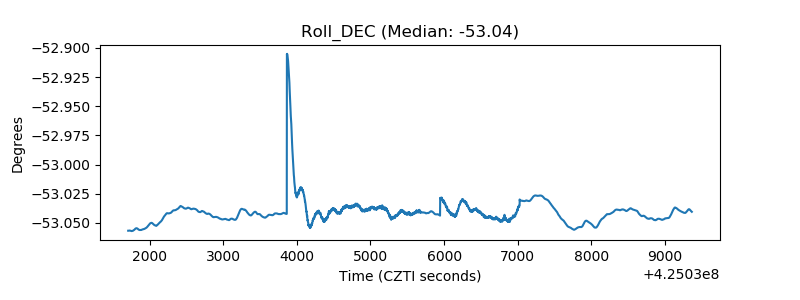 |
| _Roll_RA | 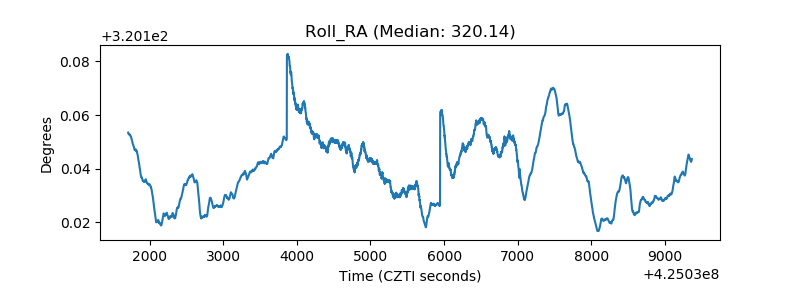 |
| Veto Counter | 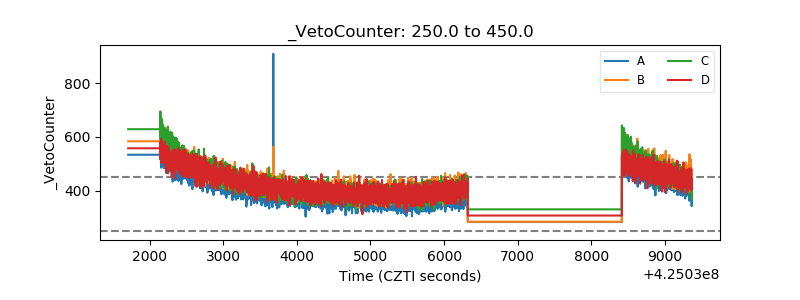 |