| Param | Original file | Final file |
|---|---|---|
| Filename | modeM0/AS1A12_052T04_9000005700_41794cztM0_level2.fits | modeM0/AS1A12_052T04_9000005700_41794cztM0_level2_quad_clean.evt |
| Size (bytes) | 323,179,200 | 93,179,520 |
| Size | 308.2 MB | 88.9 MB |
| Events in quadrant A | 3,019,143 | 641,046 |
| Events in quadrant B | 2,504,204 | 648,656 |
| Events in quadrant C | 3,190,996 | 592,275 |
| Events in quadrant D | 2,843,973 | 575,860 |
| Mode M9 | |||
|---|---|---|---|
| Quadrant | BADHDUFLAG | Total packets | Discarded packets |
| A | 0 | 25 | 0 |
| B | 0 | 26 | 0 |
| C | 0 | 26 | 0 |
| D | 0 | 26 | 0 |
| Mode SS | |||
|---|---|---|---|
| Quadrant | BADHDUFLAG | Total packets | Discarded packets |
| A | 0 | 106 | 0 |
| B | 0 | 106 | 0 |
| C | 0 | 106 | 0 |
| D | 0 | 106 | 0 |
| Mode M0 | |||
|---|---|---|---|
| Quadrant | BADHDUFLAG | Total packets | Discarded packets |
| A | 0 | 12032 | 2 |
| B | 0 | 10706 | 2 |
| C | 0 | 12516 | 2 |
| D | 0 | 11857 | 2 |
| Quadrant | Total seconds | Saturated seconds | Saturation percentage |
|---|---|---|---|
| A | 5194 | 20 | 0.385060% |
| B | 5194 | 8 | 0.154024% |
| C | 5193 | 267 | 5.141537% |
| D | 5193 | 83 | 1.598305% |
Noise dominated data is calculated using 1-second bins in cleaned event files. If a bin has >2000 counts, and if more than 50% of those come from <1% of pixels, then it is considered to be noise-dominated and hence unusable.
| Quadrant | # 1 sec bins | Bins with >0 counts | Bins with >2000 counts | High rate bins dominated by noise | Noise dominated (total time) | Noise dominated (detector-on time) | Marked lightcurve |
|---|---|---|---|---|---|---|---|
| A | 7347 | 5195 | 3 | 3 | 0.04% | 0.06% | 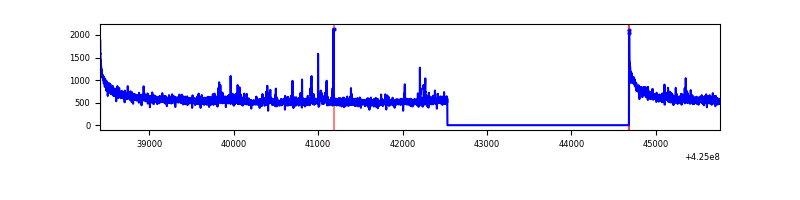 |
| B | 7347 | 5195 | 1 | 1 | 0.01% | 0.02% |  |
| C | 7346 | 5194 | 260 | 260 | 3.54% | 5.01% | 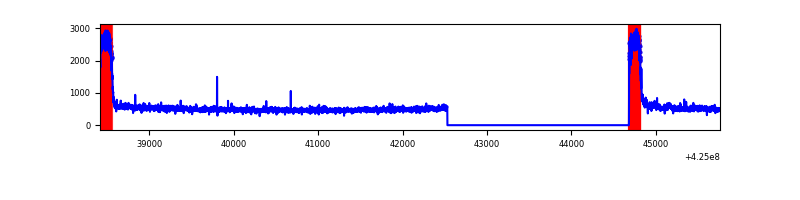 |
| D | 7346 | 5194 | 83 | 83 | 1.13% | 1.60% |  |
Top three noisy pixels from each quadrant. If the there are fewer than three noisy pixels in the level2.evt file, extra rows are filled as -1
| Pixel properties | Quadrant properties | ||||||
|---|---|---|---|---|---|---|---|
| Quadrant | DetID | PixID | Counts | Sigma | Mean | Median | Sigma |
| A | 10 | 83 | 559447 | 4535.59 | 609 | 598 | 123.2 |
| A | 15 | 223 | 64424 | 518.01 | 609 | 598 | 123.2 |
| A | 2 | 79 | 33863 | 269.98 | 609 | 598 | 123.2 |
| B | 0 | 245 | 46768 | 402.42 | 601 | 585 | 114.8 |
| B | 0 | 186 | 41189 | 353.8 | 601 | 585 | 114.8 |
| B | 0 | 183 | 31427 | 268.74 | 601 | 585 | 114.8 |
| C | 0 | 10 | 782998 | 5990.36 | 563 | 566 | 130.6 |
| C | 15 | 214 | 203594 | 1554.4 | 563 | 566 | 130.6 |
| C | 12 | 249 | 6403 | 44.69 | 563 | 566 | 130.6 |
| D | 13 | 249 | 233696 | 1618.62 | 590 | 573 | 144.0 |
| D | 12 | 79 | 102531 | 707.91 | 590 | 573 | 144.0 |
| D | 2 | 249 | 98509 | 679.99 | 590 | 573 | 144.0 |
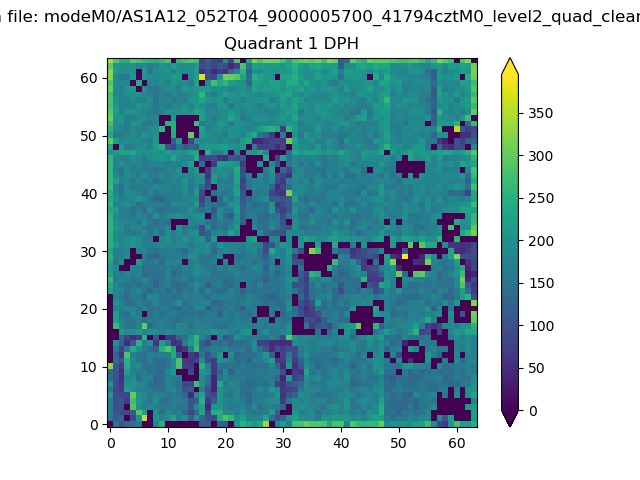
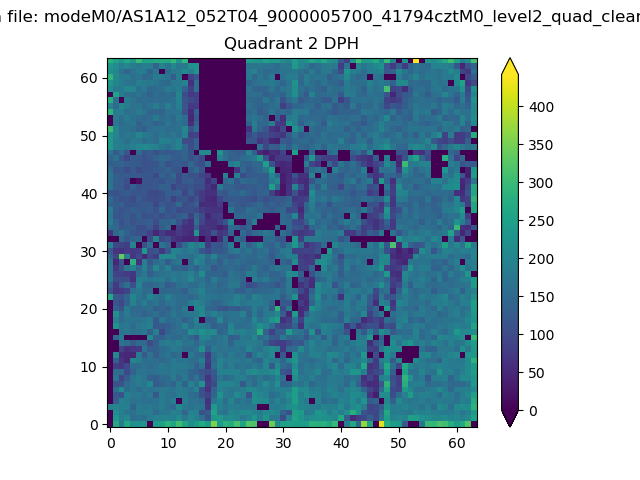
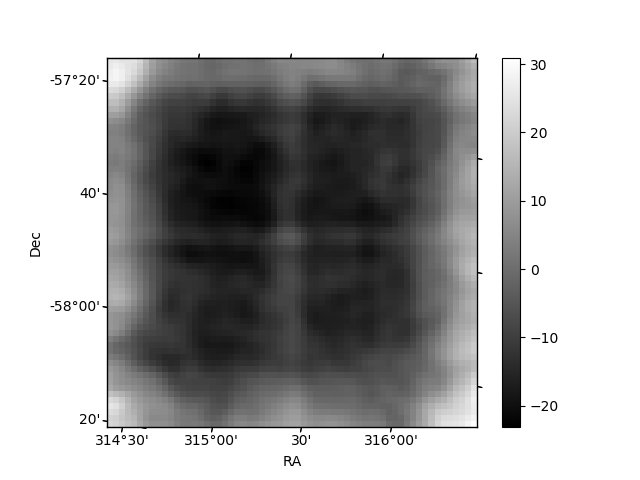
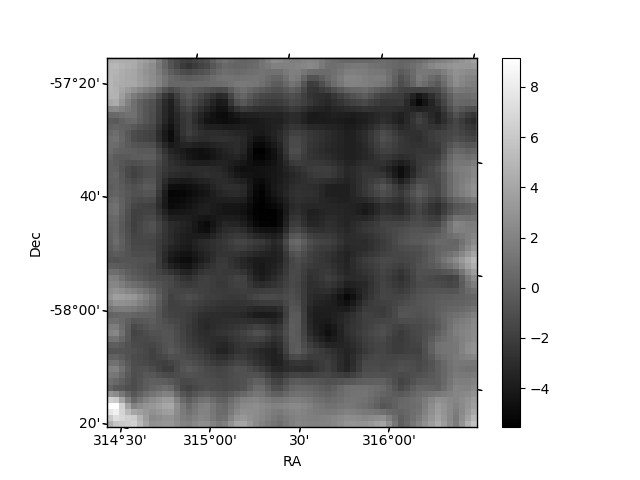
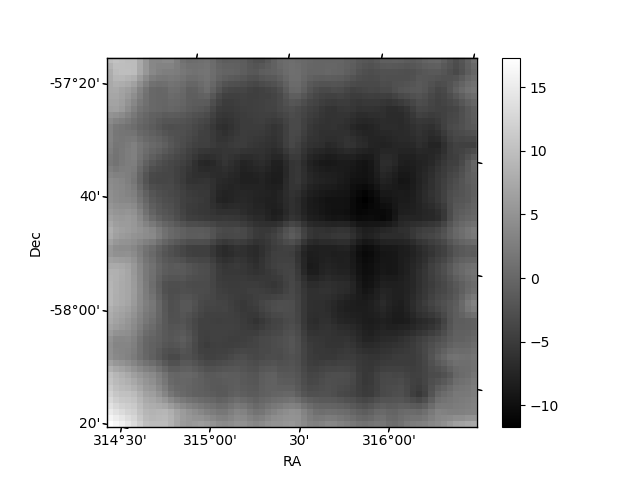
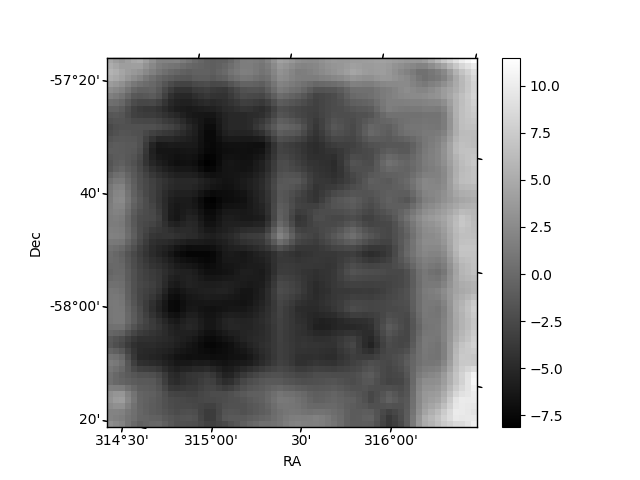
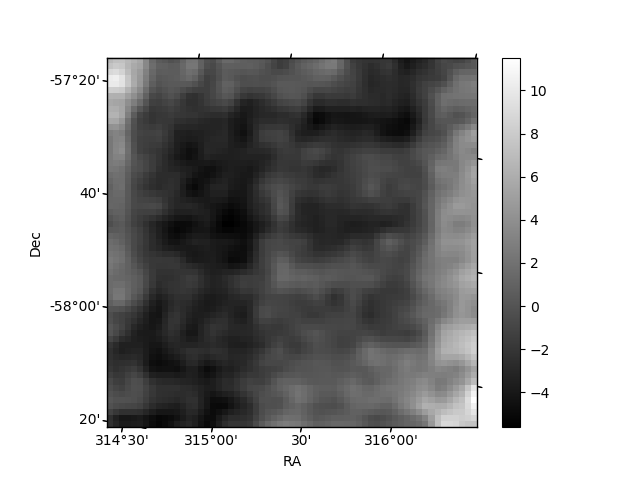
Histogram calculated using DETX and DETY for each event in the final _common_clean file
| Quadrant A | 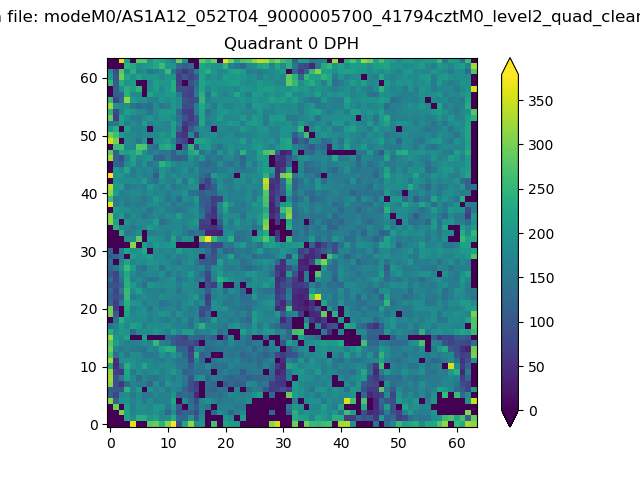 |
 |
Quadrant B |
|---|---|---|---|
| Quadrant D | 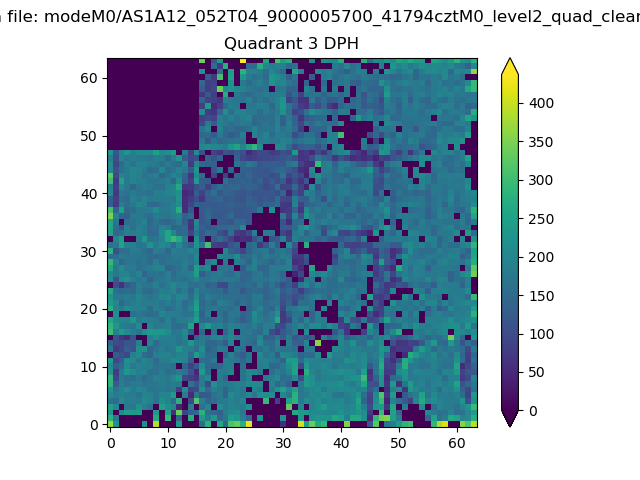 |
 |
Quadrant C |
| Plot type | Count rate plots | Images |
|---|---|---|
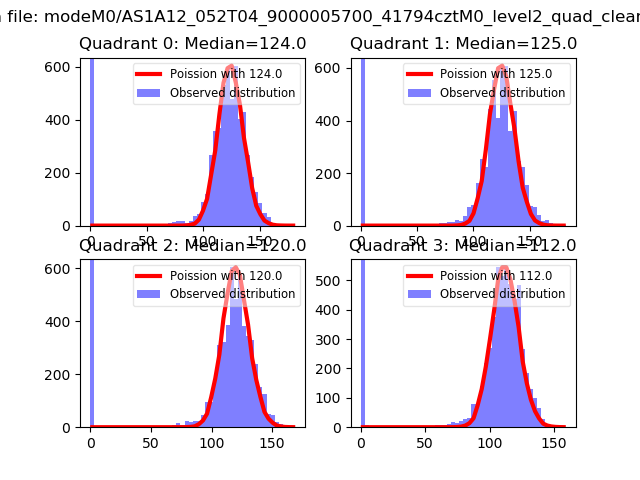
| Comparison with Poisson distribution Blue bars denote a histogram of data divided into 1 sec bins. Red curve is a Poisson curve with rate = median count rate of data. |
 |
 |
| Quadrant-wise count rates Data is divided into 100 sec bins |
 |
|
| Module-wise count rates for Quadrant A Data is divided into 100 sec bins |
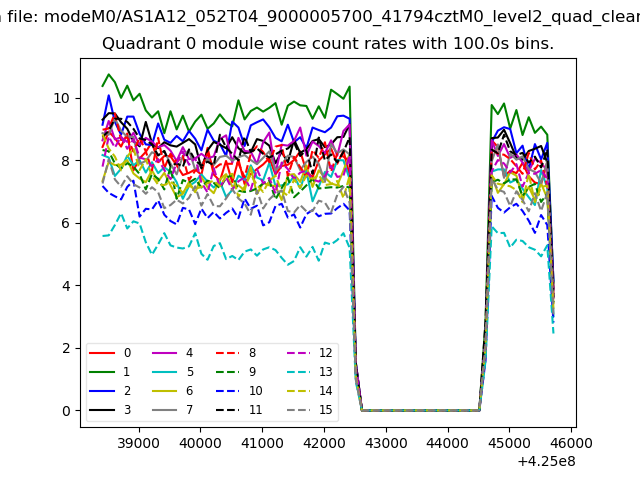 |
 |
| Module-wise count rates for Quadrant B Data is divided into 100 sec bins |
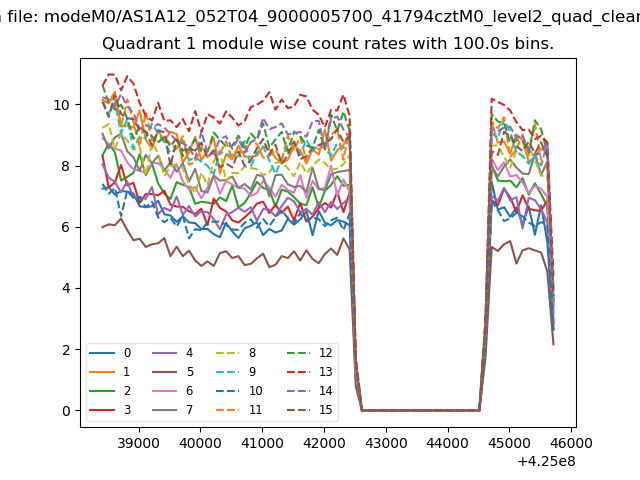 |
 |
| Module-wise count rates for Quadrant C Data is divided into 100 sec bins |
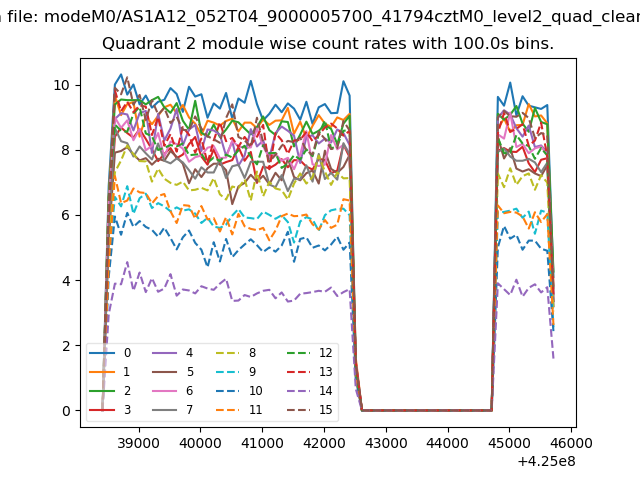 |
 |
| Module-wise count rates for Quadrant D Data is divided into 100 sec bins |
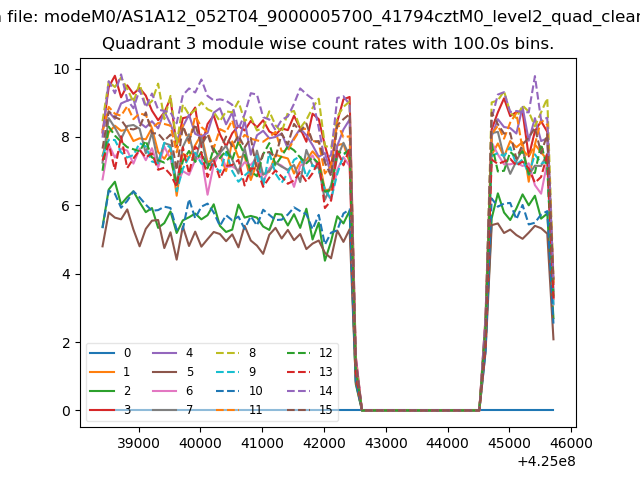 |
 |
| Parameter | Plot |
|---|---|
| CZT HV Monitor |  |
| D_VDD | 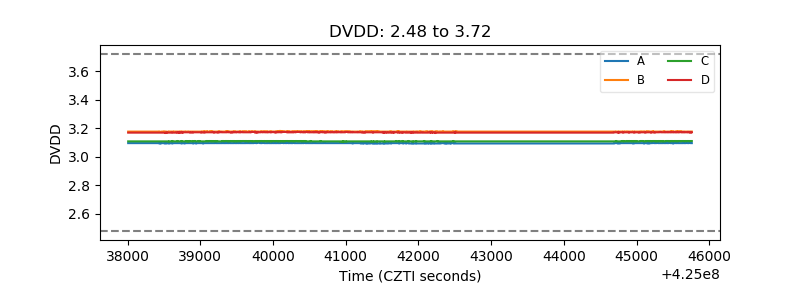 |
| Temperature 1 | 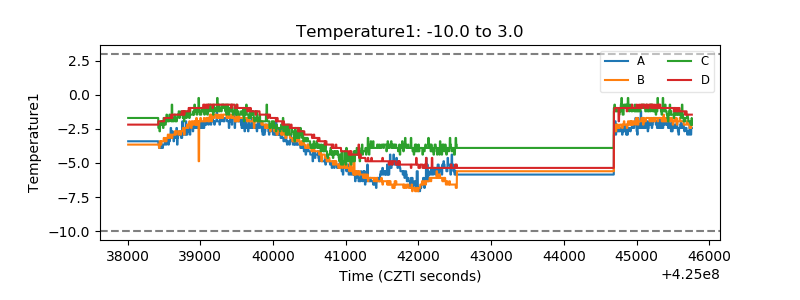 |
| Veto HV Monitor | 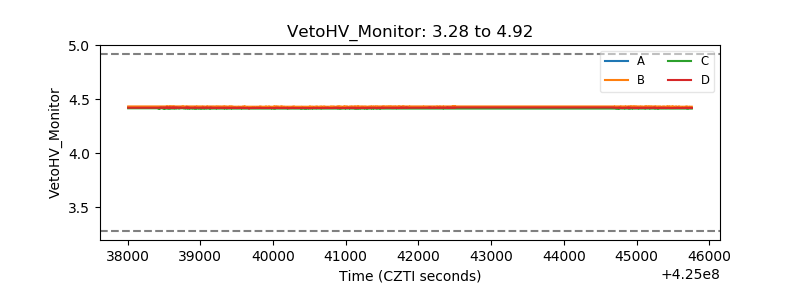 |
| Veto LLD | 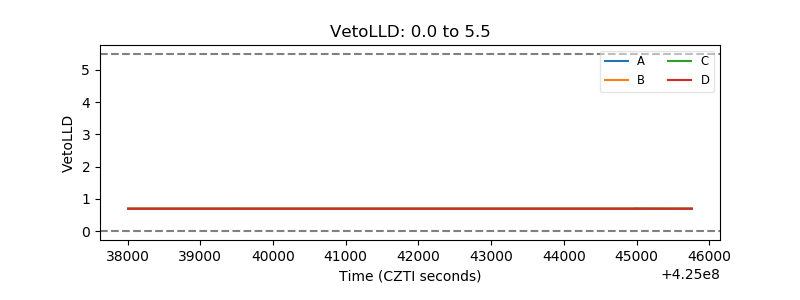 |
| Alpha Counter | 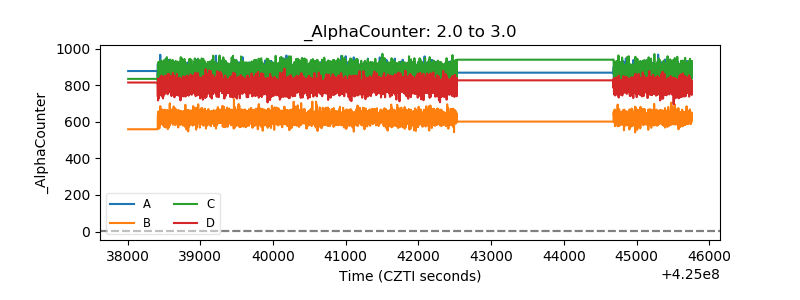 |
| _CPM_Rate | 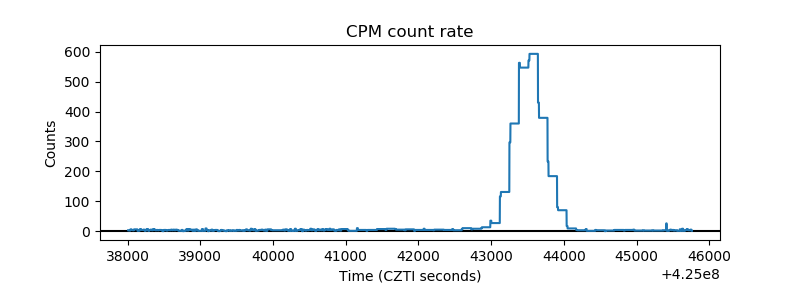 |
| CZT Counter | 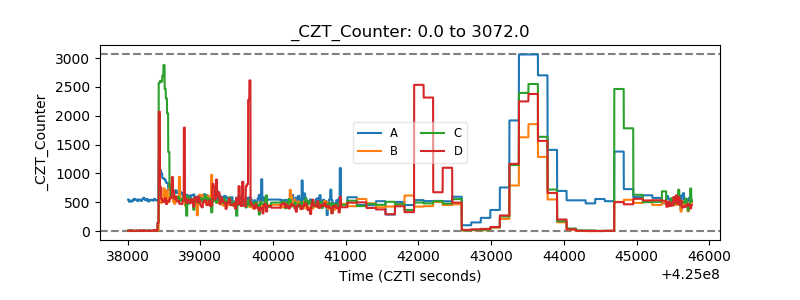 |
| +2.5 Volts monitor | 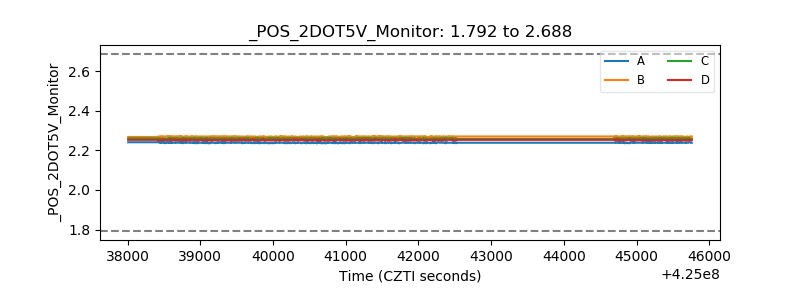 |
| +5 Volts monitor | 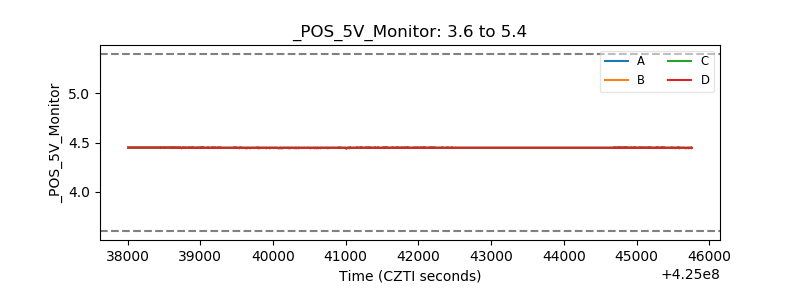 |
| _ROLL_ROT | 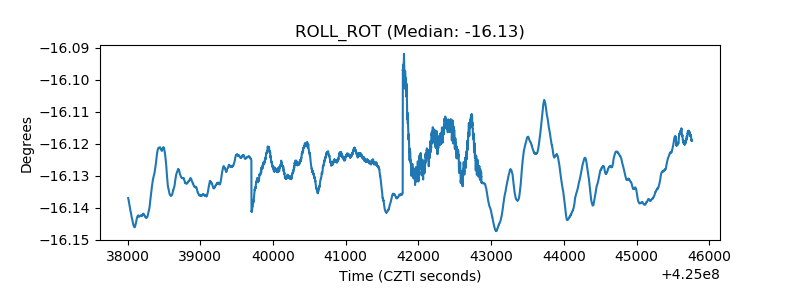 |
| _Roll_DEC | 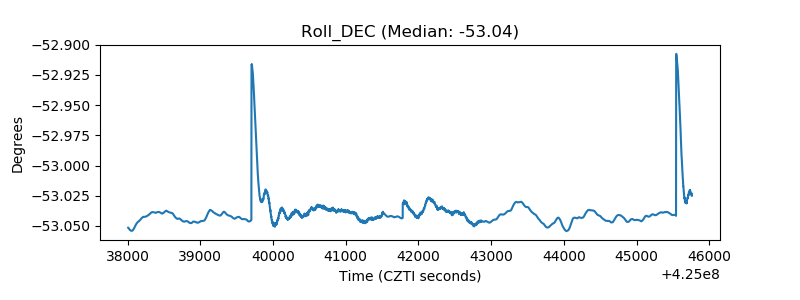 |
| _Roll_RA | 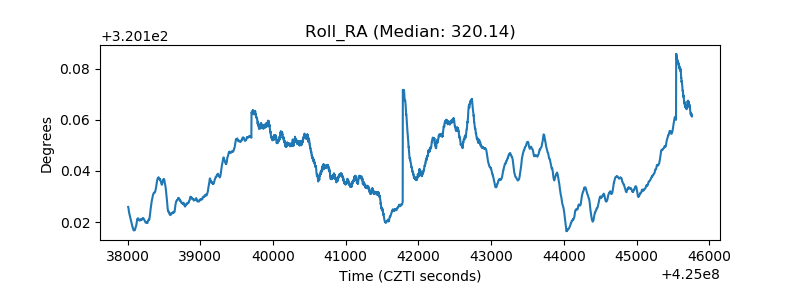 |
| Veto Counter | 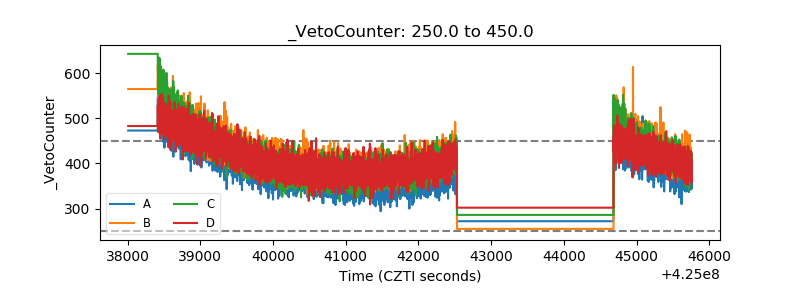 |