| Param | Original file | Final file |
|---|---|---|
| Filename | modeM0/AS1A12_052T04_9000005700_41795cztM0_level2.fits | modeM0/AS1A12_052T04_9000005700_41795cztM0_level2_quad_clean.evt |
| Size (bytes) | 304,418,880 | 87,989,760 |
| Size | 290.3 MB | 83.9 MB |
| Events in quadrant A | 2,936,044 | 598,600 |
| Events in quadrant B | 2,432,063 | 606,872 |
| Events in quadrant C | 3,104,302 | 555,920 |
| Events in quadrant D | 2,399,051 | 546,258 |
| Mode M9 | |||
|---|---|---|---|
| Quadrant | BADHDUFLAG | Total packets | Discarded packets |
| A | 0 | 32 | 0 |
| B | 0 | 33 | 0 |
| C | 0 | 33 | 0 |
| D | 0 | 33 | 0 |
| Mode SS | |||
|---|---|---|---|
| Quadrant | BADHDUFLAG | Total packets | Discarded packets |
| A | 0 | 104 | 0 |
| B | 0 | 104 | 0 |
| C | 0 | 104 | 0 |
| D | 0 | 104 | 0 |
| Mode M0 | |||
|---|---|---|---|
| Quadrant | BADHDUFLAG | Total packets | Discarded packets |
| A | 0 | 11801 | 2 |
| B | 0 | 10581 | 2 |
| C | 0 | 12184 | 2 |
| D | 0 | 10701 | 2 |
| Quadrant | Total seconds | Saturated seconds | Saturation percentage |
|---|---|---|---|
| A | 5092 | 25 | 0.490966% |
| B | 5092 | 14 | 0.274941% |
| C | 5092 | 259 | 5.086410% |
| D | 5092 | 15 | 0.294580% |
Noise dominated data is calculated using 1-second bins in cleaned event files. If a bin has >2000 counts, and if more than 50% of those come from <1% of pixels, then it is considered to be noise-dominated and hence unusable.
| Quadrant | # 1 sec bins | Bins with >0 counts | Bins with >2000 counts | High rate bins dominated by noise | Noise dominated (total time) | Noise dominated (detector-on time) | Marked lightcurve |
|---|---|---|---|---|---|---|---|
| A | 7215 | 5093 | 16 | 16 | 0.22% | 0.31% | 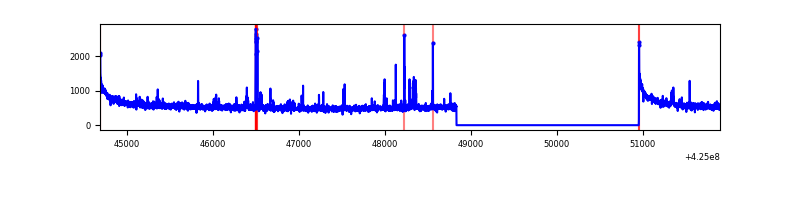 |
| B | 7215 | 5093 | 2 | 2 | 0.03% | 0.04% | 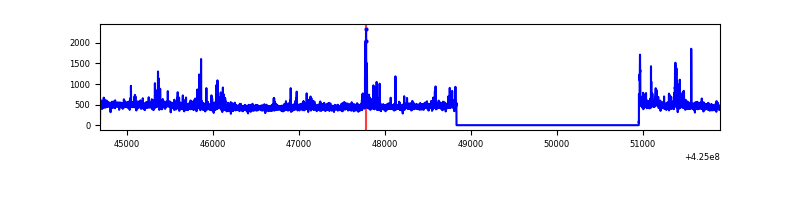 |
| C | 7215 | 5093 | 253 | 253 | 3.51% | 4.97% | 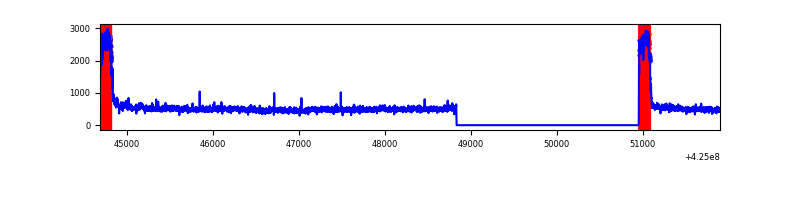 |
| D | 7215 | 5093 | 14 | 14 | 0.19% | 0.27% | 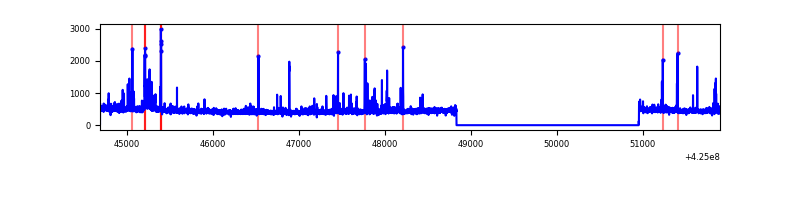 |
Top three noisy pixels from each quadrant. If the there are fewer than three noisy pixels in the level2.evt file, extra rows are filled as -1
| Pixel properties | Quadrant properties | ||||||
|---|---|---|---|---|---|---|---|
| Quadrant | DetID | PixID | Counts | Sigma | Mean | Median | Sigma |
| A | 10 | 83 | 550862 | 4649.9 | 576 | 563 | 118.3 |
| A | 15 | 223 | 102601 | 862.19 | 576 | 563 | 118.3 |
| A | 2 | 79 | 40196 | 334.89 | 576 | 563 | 118.3 |
| B | 0 | 186 | 46264 | 423.91 | 570 | 554 | 107.8 |
| B | 4 | 171 | 40204 | 367.71 | 570 | 554 | 107.8 |
| B | 0 | 245 | 37221 | 340.05 | 570 | 554 | 107.8 |
| C | 0 | 10 | 811456 | 6484.85 | 535 | 538 | 125.0 |
| C | 15 | 214 | 198860 | 1585.97 | 535 | 538 | 125.0 |
| C | 12 | 249 | 5797 | 42.06 | 535 | 538 | 125.0 |
| D | 13 | 249 | 85117 | 610.91 | 562 | 547 | 138.4 |
| D | 12 | 6 | 31310 | 222.22 | 562 | 547 | 138.4 |
| D | 1 | 52 | 29092 | 206.2 | 562 | 547 | 138.4 |
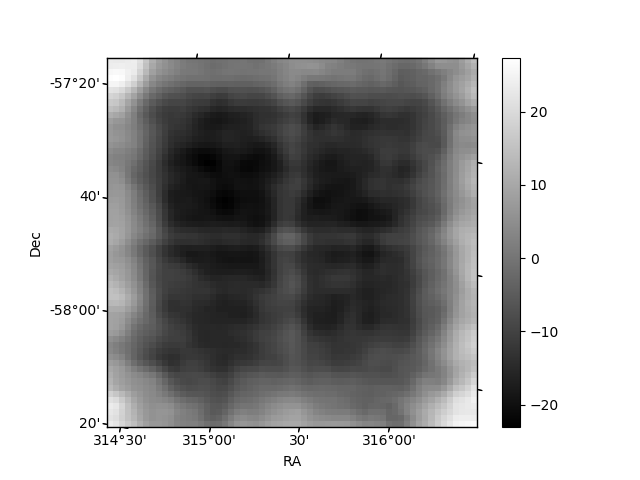
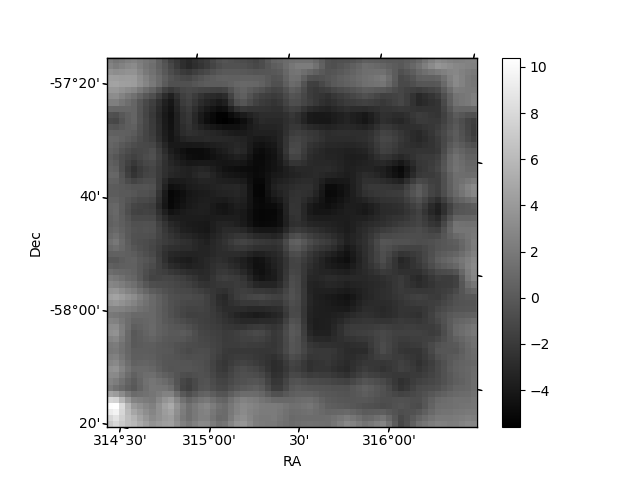
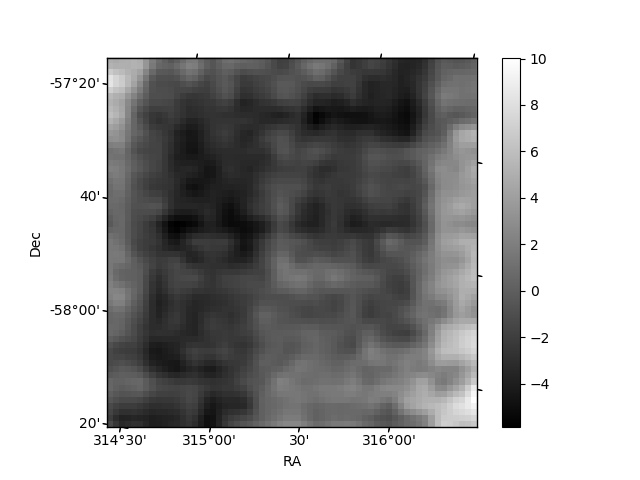
Histogram calculated using DETX and DETY for each event in the final _common_clean file
| Quadrant A | 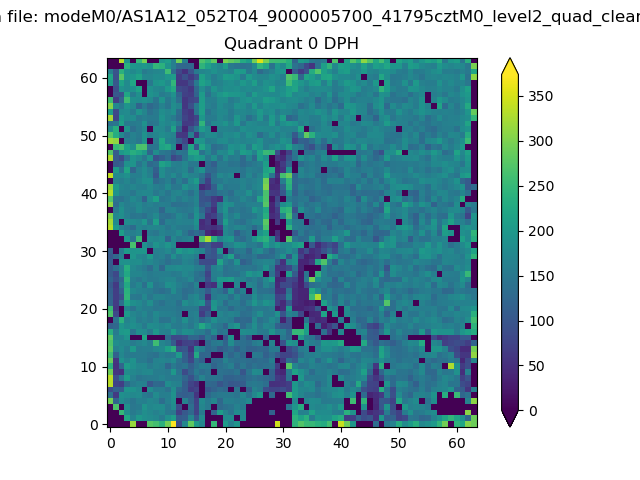 |
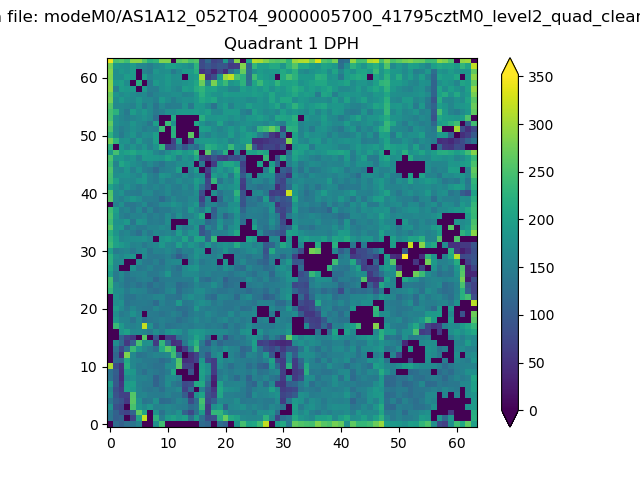 |
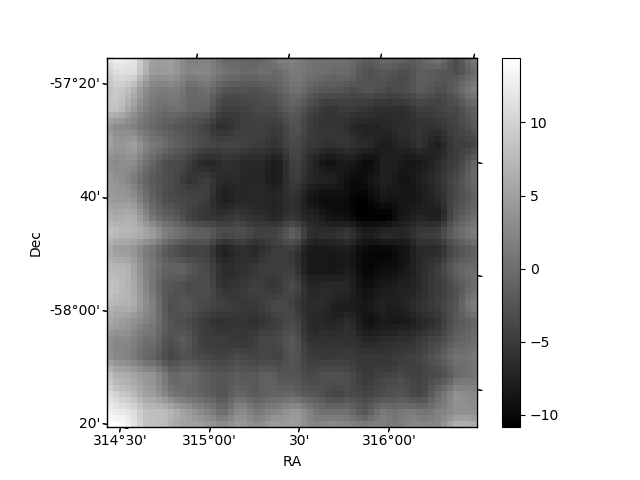
Quadrant B |
|---|---|---|---|
| Quadrant D | 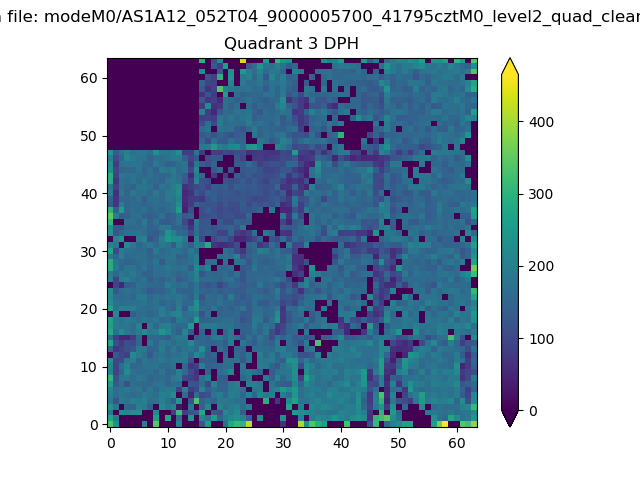 |
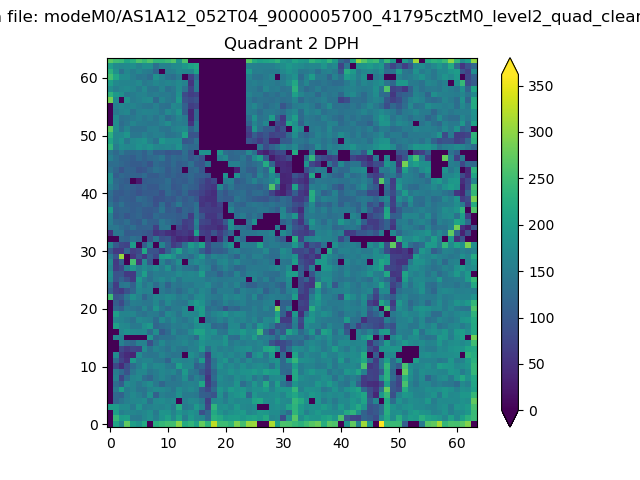 |
Quadrant C |
| Plot type | Count rate plots | Images |
|---|---|---|
| Comparison with Poisson distribution Blue bars denote a histogram of data divided into 1 sec bins. Red curve is a Poisson curve with rate = median count rate of data. |
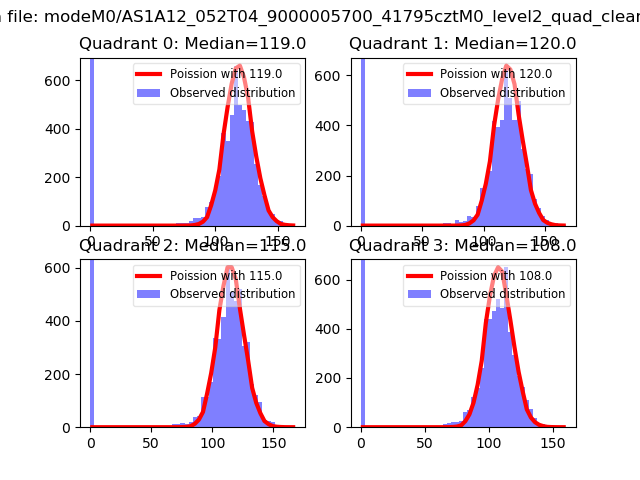 |
 |
| Quadrant-wise count rates Data is divided into 100 sec bins |
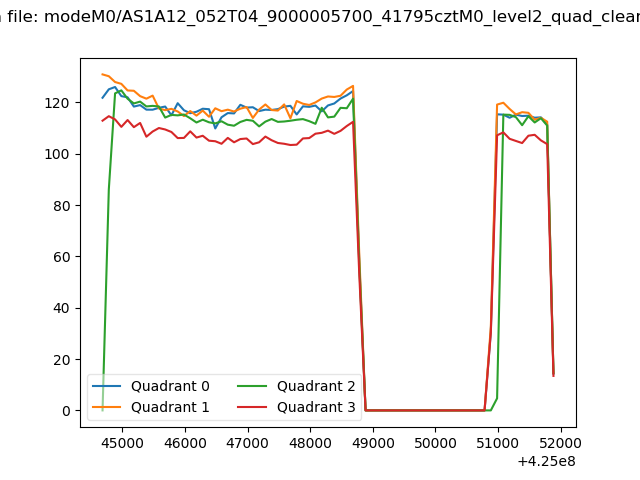 |
|
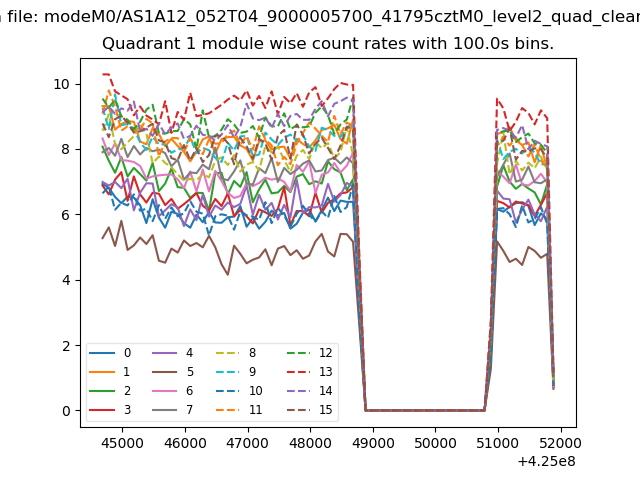
| Module-wise count rates for Quadrant A Data is divided into 100 sec bins |
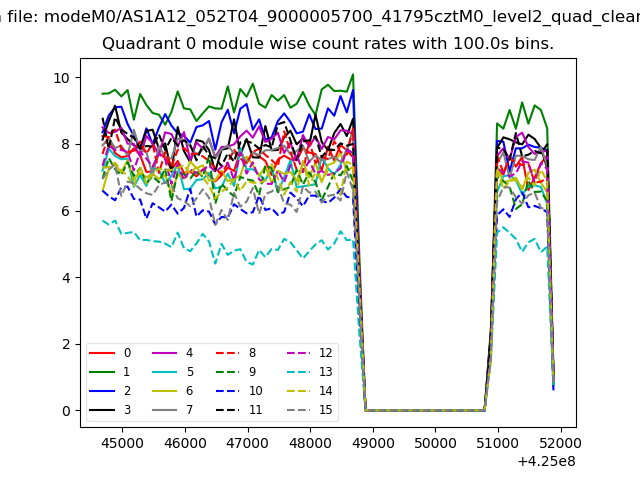 |
 |
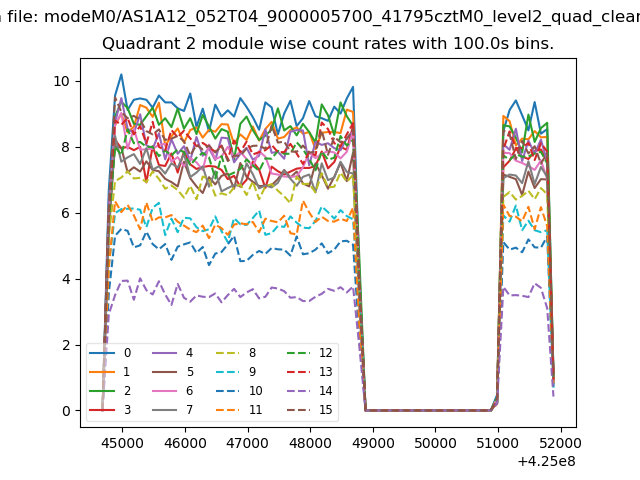
| Module-wise count rates for Quadrant B Data is divided into 100 sec bins |
 |
 |
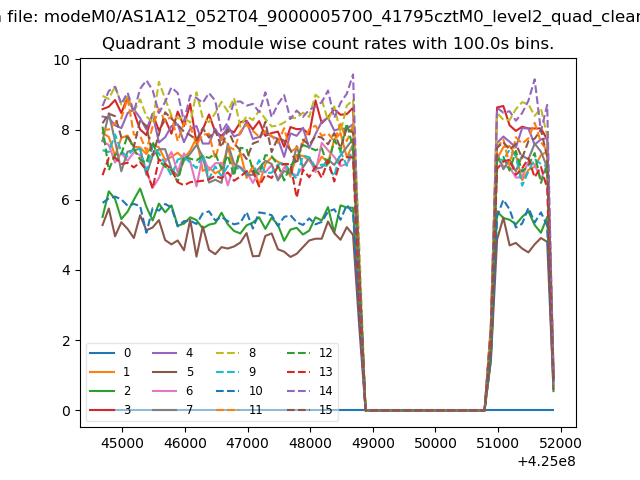
| Module-wise count rates for Quadrant C Data is divided into 100 sec bins |
 |
 |
| Module-wise count rates for Quadrant D Data is divided into 100 sec bins |
 |
 |
| Parameter | Plot |
|---|---|
| CZT HV Monitor | 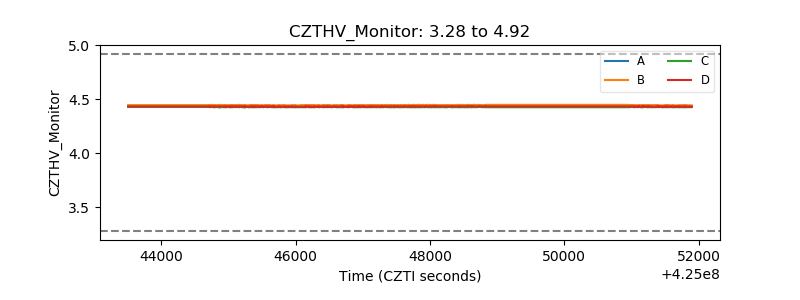 |
| D_VDD |  |
| Temperature 1 | 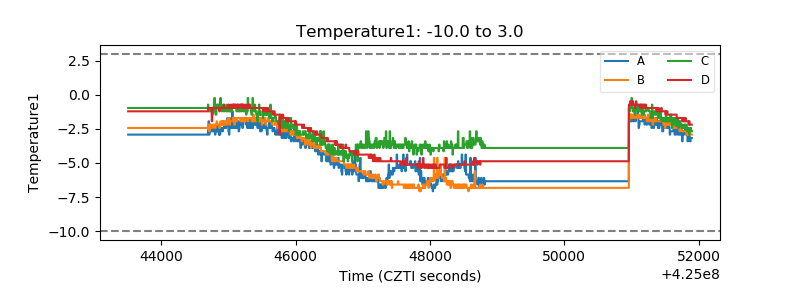 |
| Veto HV Monitor | 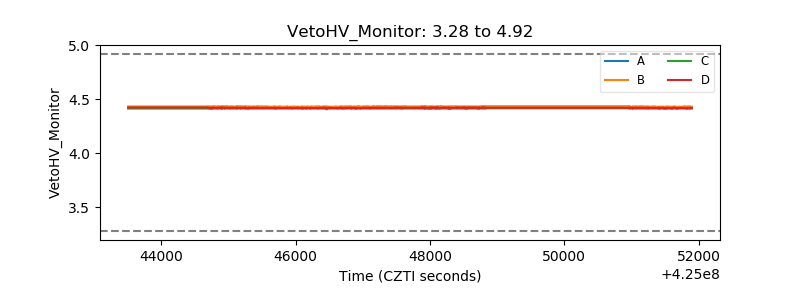 |
| Veto LLD | 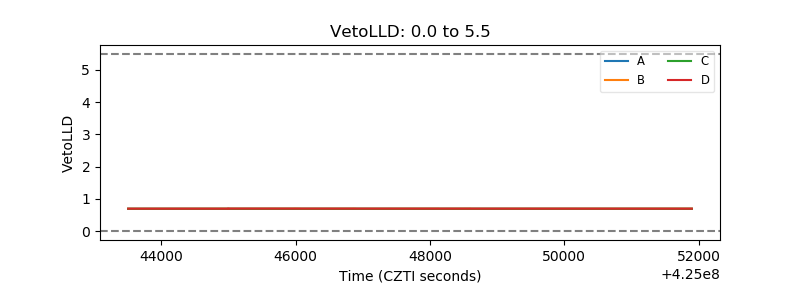 |
| Alpha Counter | 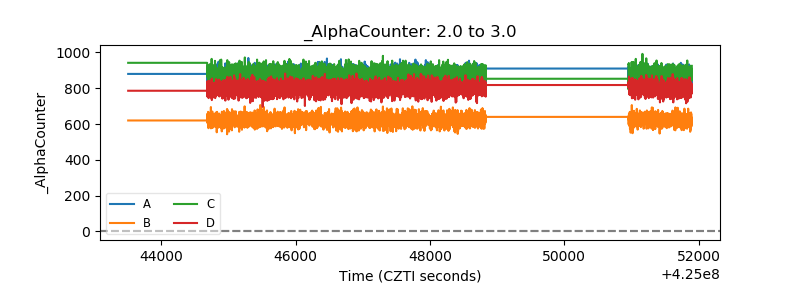 |
| _CPM_Rate | 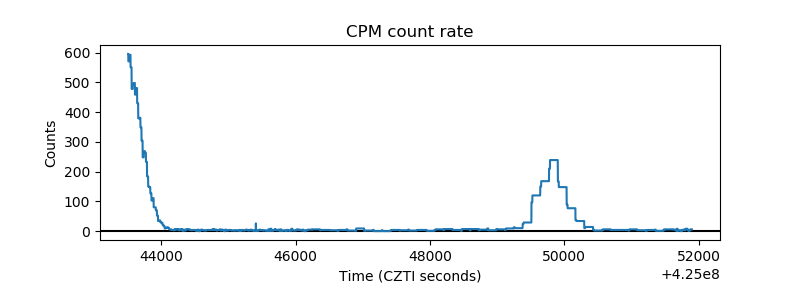 |
| CZT Counter | 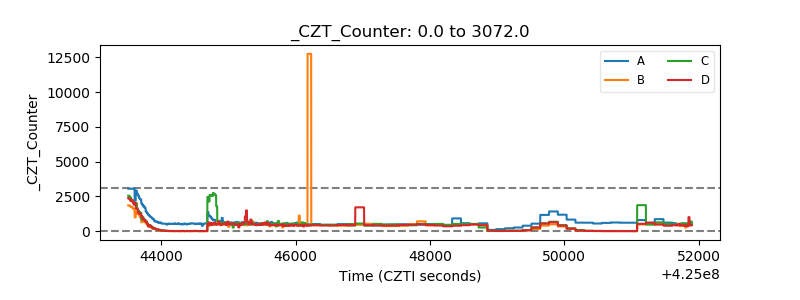 |
| +2.5 Volts monitor | 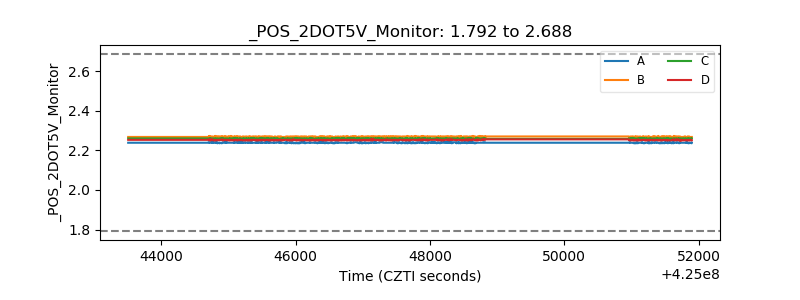 |
| +5 Volts monitor | 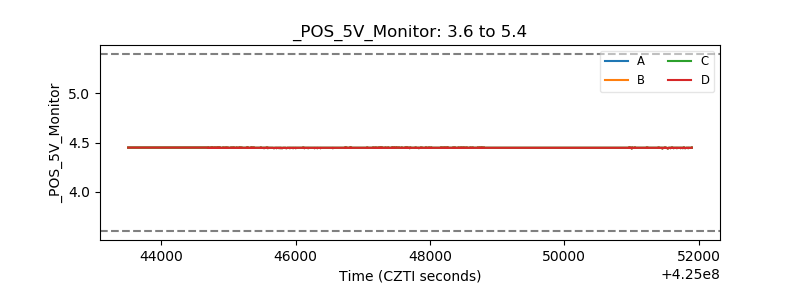 |
| _ROLL_ROT | 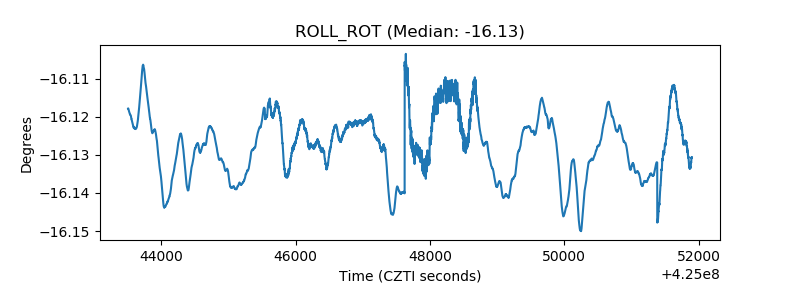 |
| _Roll_DEC | 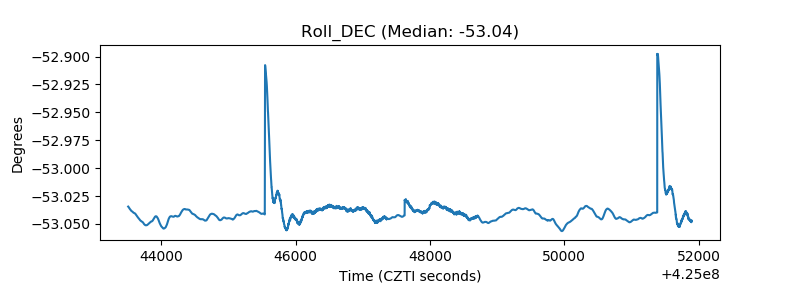 |
| _Roll_RA | 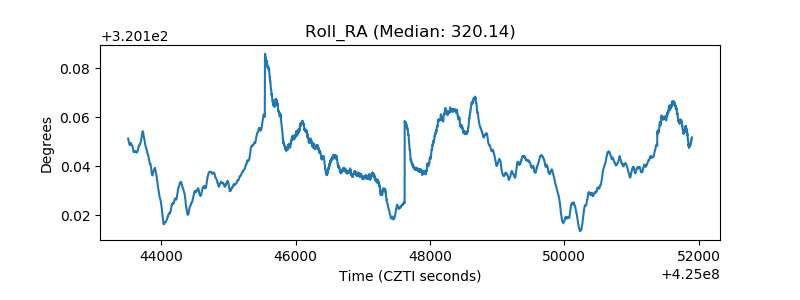 |
| Veto Counter | 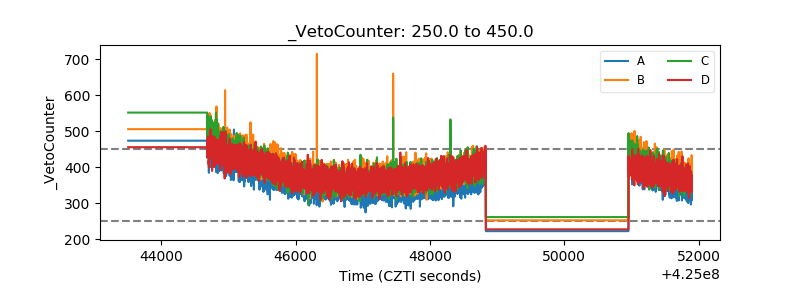 |