| Param | Original file | Final file |
|---|---|---|
| Filename | modeM0/AS1A12_052T04_9000005700_41796cztM0_level2.fits | modeM0/AS1A12_052T04_9000005700_41796cztM0_level2_quad_clean.evt |
| Size (bytes) | 304,997,760 | 85,838,400 |
| Size | 290.9 MB | 81.9 MB |
| Events in quadrant A | 2,968,302 | 579,470 |
| Events in quadrant B | 2,372,791 | 587,603 |
| Events in quadrant C | 2,984,846 | 540,869 |
| Events in quadrant D | 2,562,343 | 530,036 |
| Mode M9 | |||
|---|---|---|---|
| Quadrant | BADHDUFLAG | Total packets | Discarded packets |
| A | 0 | 27 | 0 |
| B | 0 | 28 | 0 |
| C | 0 | 28 | 0 |
| D | 0 | 28 | 0 |
| Mode SS | |||
|---|---|---|---|
| Quadrant | BADHDUFLAG | Total packets | Discarded packets |
| A | 0 | 106 | 0 |
| B | 0 | 106 | 0 |
| C | 0 | 106 | 0 |
| D | 0 | 106 | 0 |
| Mode M0 | |||
|---|---|---|---|
| Quadrant | BADHDUFLAG | Total packets | Discarded packets |
| A | 0 | 11982 | 2 |
| B | 0 | 10674 | 3 |
| C | 0 | 12105 | 2 |
| D | 0 | 11329 | 2 |
| Quadrant | Total seconds | Saturated seconds | Saturation percentage |
|---|---|---|---|
| A | 5153 | 66 | 1.280807% |
| B | 5152 | 17 | 0.329969% |
| C | 5152 | 263 | 5.104814% |
| D | 5152 | 62 | 1.203416% |
Noise dominated data is calculated using 1-second bins in cleaned event files. If a bin has >2000 counts, and if more than 50% of those come from <1% of pixels, then it is considered to be noise-dominated and hence unusable.
| Quadrant | # 1 sec bins | Bins with >0 counts | Bins with >2000 counts | High rate bins dominated by noise | Noise dominated (total time) | Noise dominated (detector-on time) | Marked lightcurve |
|---|---|---|---|---|---|---|---|
| A | 7066 | 5154 | 54 | 54 | 0.76% | 1.05% | 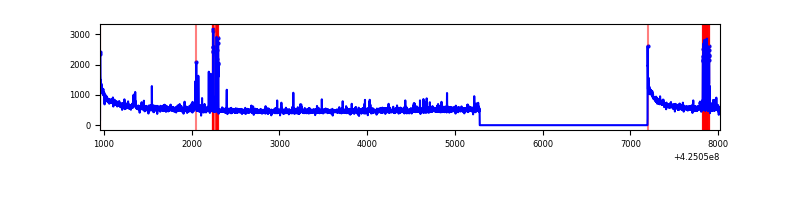 |
| B | 7065 | 5153 | 3 | 3 | 0.04% | 0.06% | 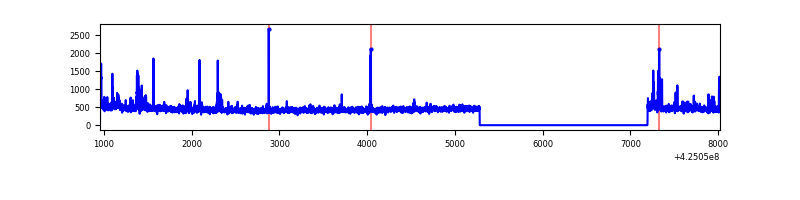 |
| C | 7065 | 5153 | 234 | 234 | 3.31% | 4.54% | 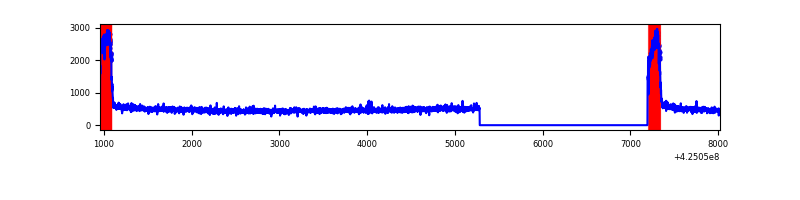 |
| D | 7065 | 5153 | 58 | 58 | 0.82% | 1.13% | 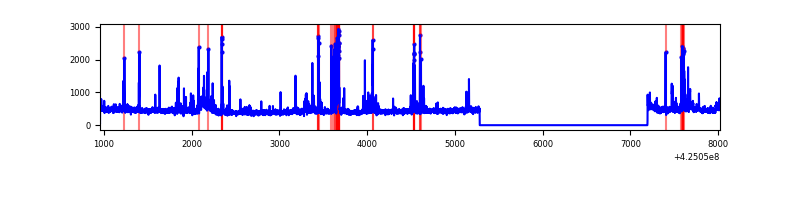 |
Top three noisy pixels from each quadrant. If the there are fewer than three noisy pixels in the level2.evt file, extra rows are filled as -1
| Pixel properties | Quadrant properties | ||||||
|---|---|---|---|---|---|---|---|
| Quadrant | DetID | PixID | Counts | Sigma | Mean | Median | Sigma |
| A | 10 | 83 | 557859 | 4812.61 | 564 | 553 | 115.8 |
| A | 15 | 223 | 186349 | 1604.44 | 564 | 553 | 115.8 |
| A | 2 | 79 | 25388 | 214.46 | 564 | 553 | 115.8 |
| B | 0 | 190 | 40104 | 365.61 | 560 | 544 | 108.2 |
| B | 0 | 186 | 33239 | 302.16 | 560 | 544 | 108.2 |
| B | 15 | 85 | 23445 | 211.65 | 560 | 544 | 108.2 |
| C | 0 | 10 | 723944 | 5913.42 | 527 | 530 | 122.3 |
| C | 15 | 214 | 200530 | 1634.87 | 527 | 530 | 122.3 |
| C | 13 | 61 | 3507 | 24.33 | 527 | 530 | 122.3 |
| D | 12 | 6 | 157133 | 1163.97 | 550 | 535 | 134.5 |
| D | 13 | 249 | 137713 | 1019.62 | 550 | 535 | 134.5 |
| D | 2 | 249 | 59655 | 439.43 | 550 | 535 | 134.5 |
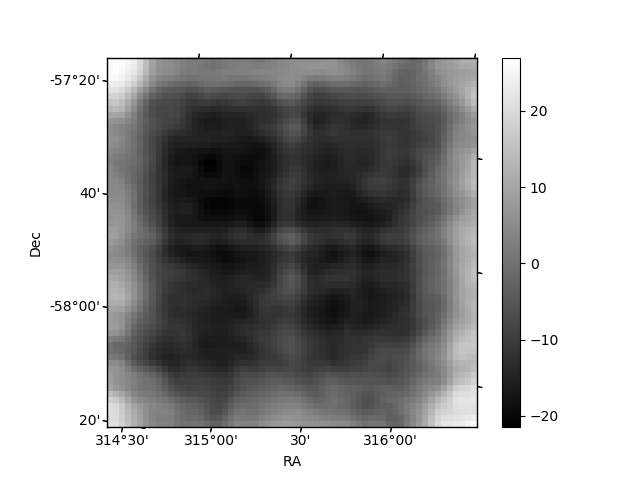
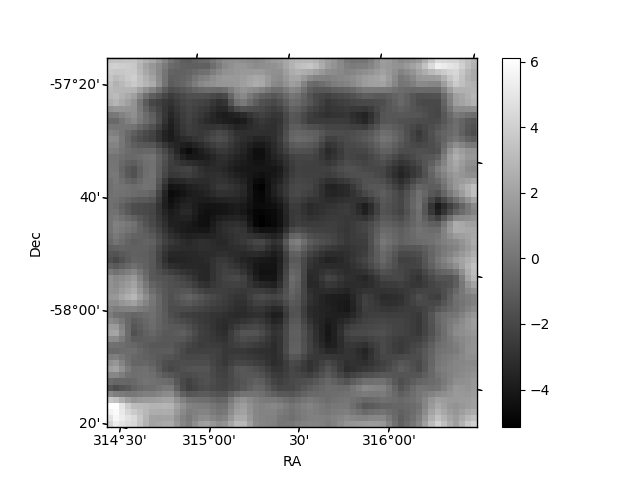
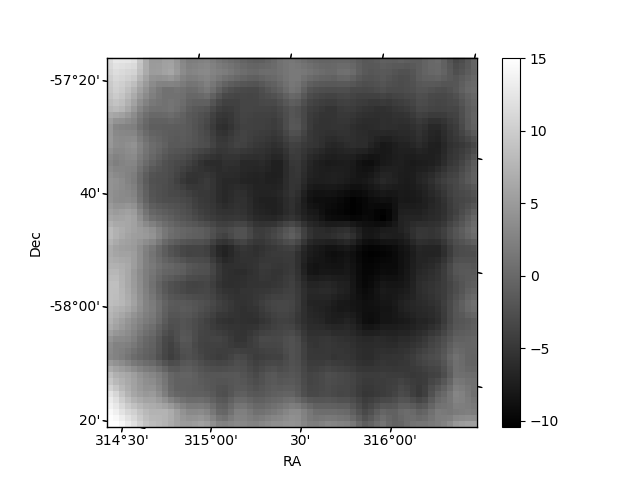
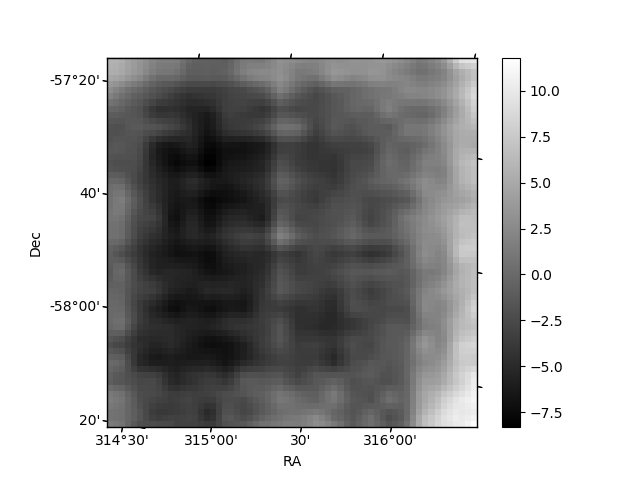
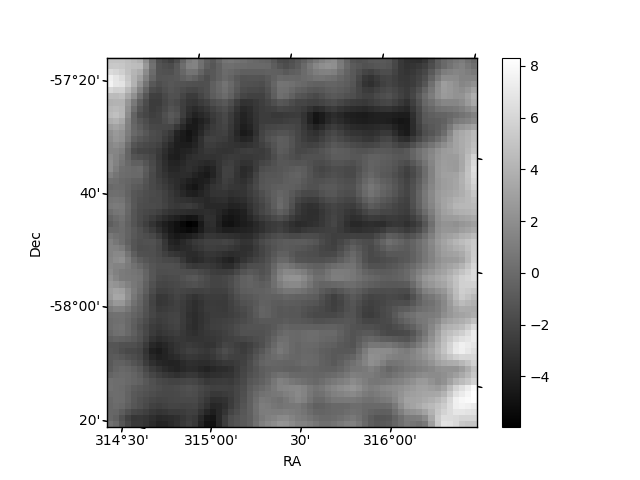
Histogram calculated using DETX and DETY for each event in the final _common_clean file
| Quadrant A | 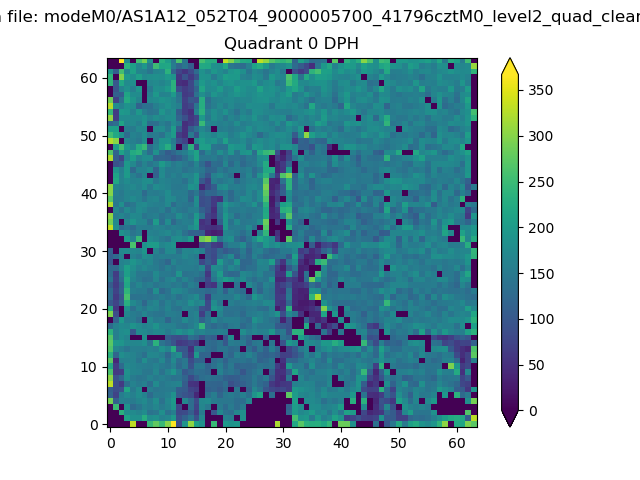 |
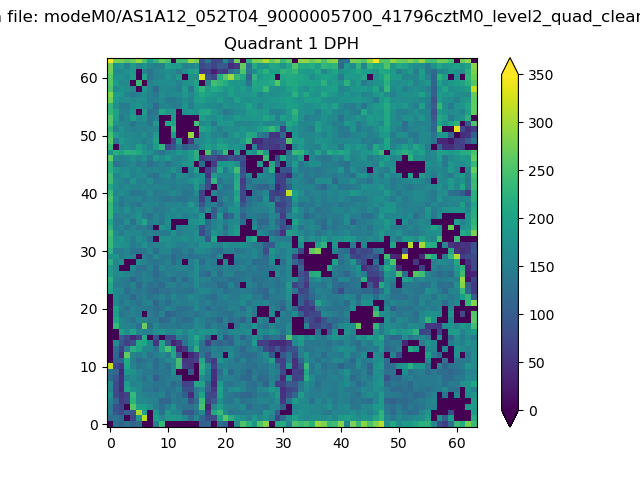 |
Quadrant B |
|---|---|---|---|
| Quadrant D | 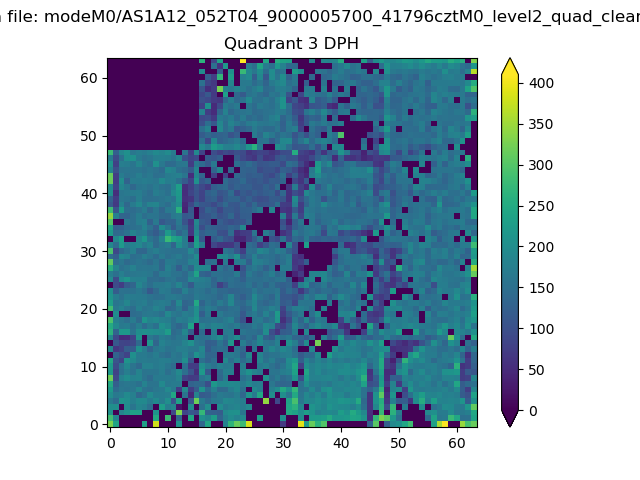 |
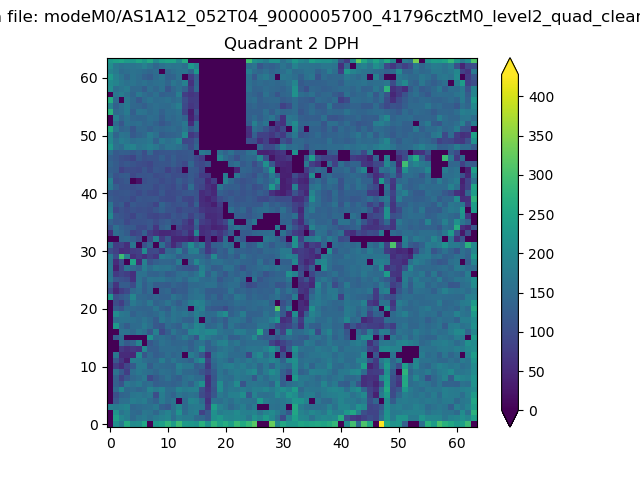 |
Quadrant C |
| Plot type | Count rate plots | Images |
|---|---|---|
| Comparison with Poisson distribution Blue bars denote a histogram of data divided into 1 sec bins. Red curve is a Poisson curve with rate = median count rate of data. |
 |
 |
| Quadrant-wise count rates Data is divided into 100 sec bins |
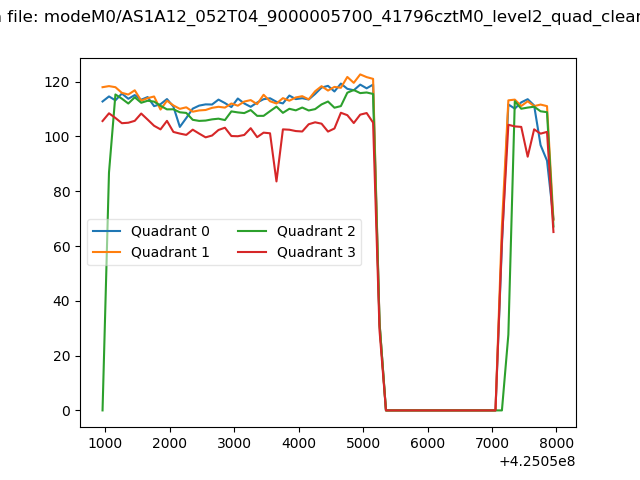 |
|
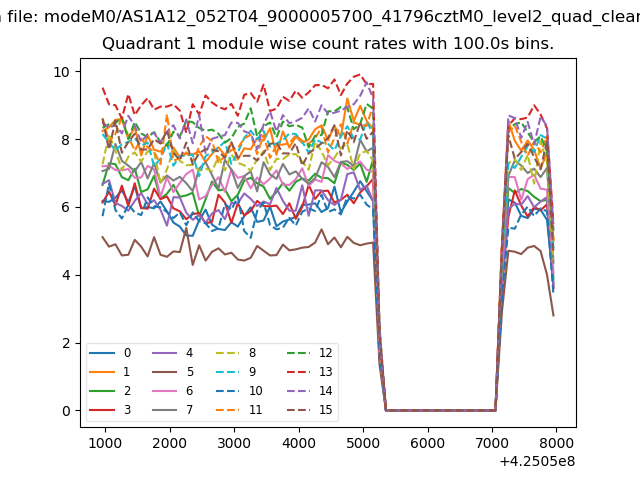
| Module-wise count rates for Quadrant A Data is divided into 100 sec bins |
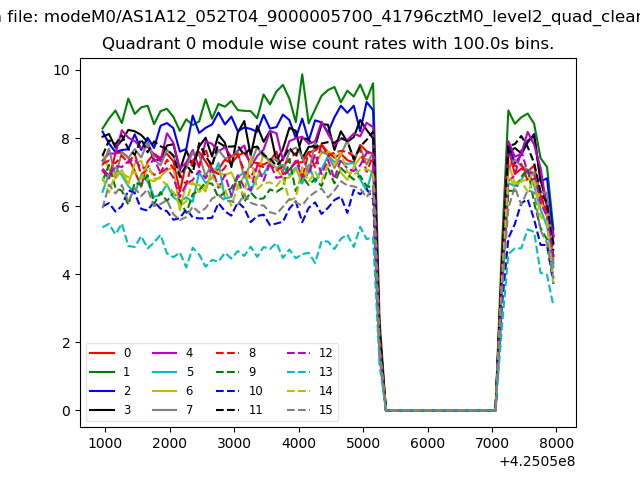 |
 |
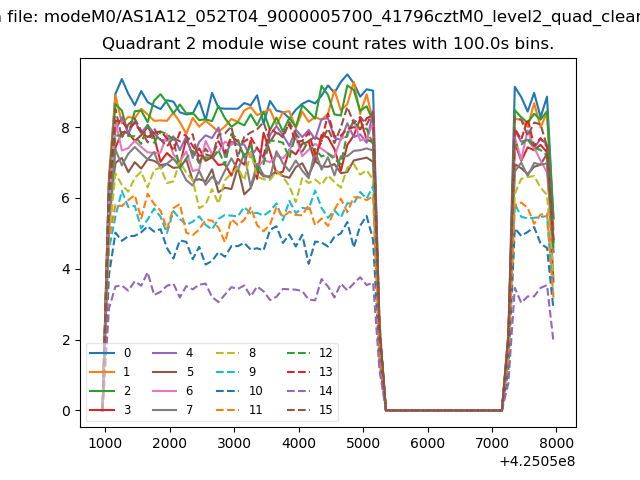
| Module-wise count rates for Quadrant B Data is divided into 100 sec bins |
 |
 |
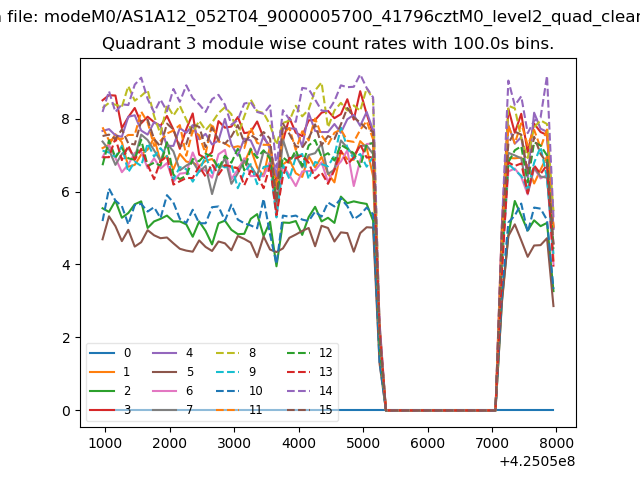
| Module-wise count rates for Quadrant C Data is divided into 100 sec bins |
 |
 |
| Module-wise count rates for Quadrant D Data is divided into 100 sec bins |
 |
 |
| Parameter | Plot |
|---|---|
| CZT HV Monitor | 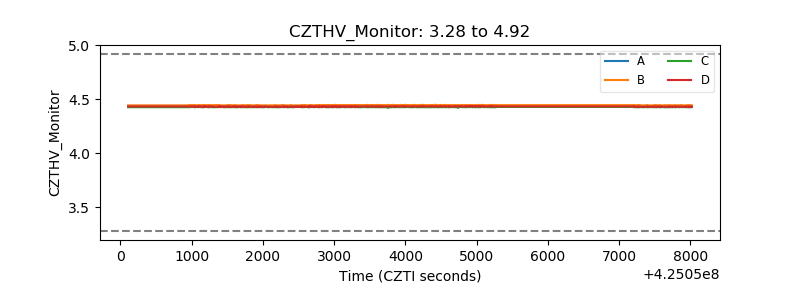 |
| D_VDD | 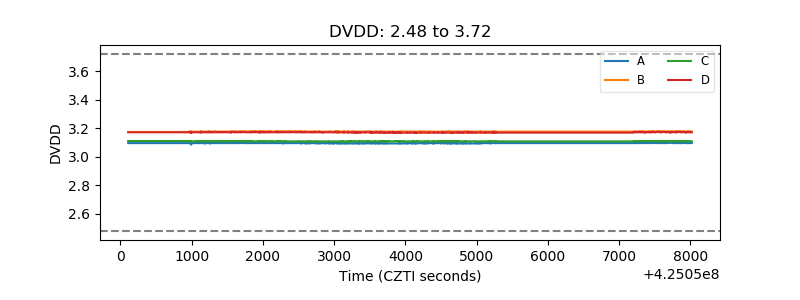 |
| Temperature 1 | 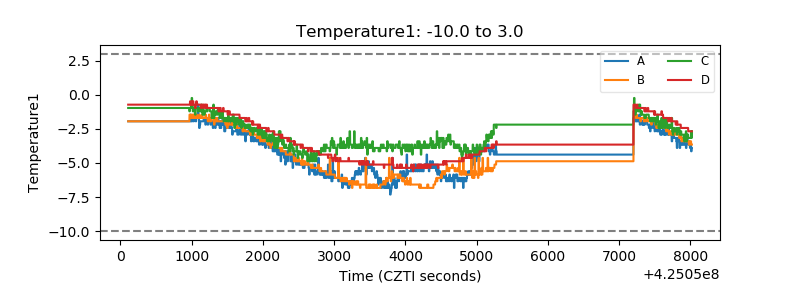 |
| Veto HV Monitor | 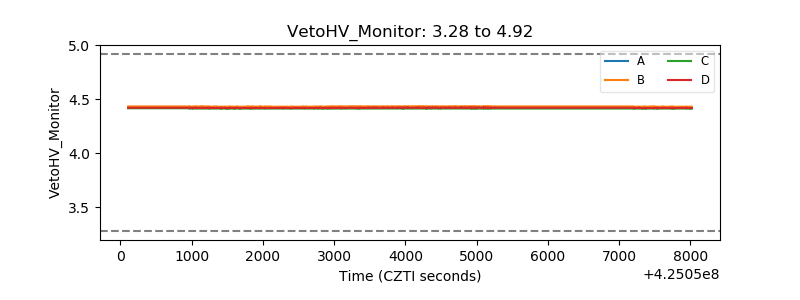 |
| Veto LLD | 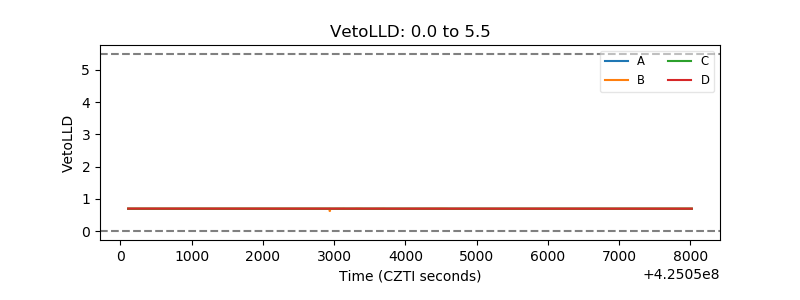 |
| Alpha Counter | 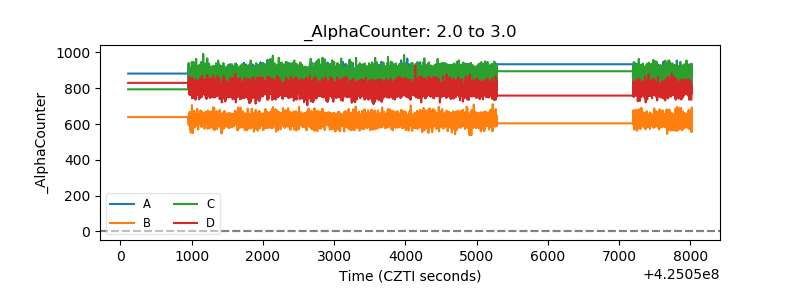 |
| _CPM_Rate | 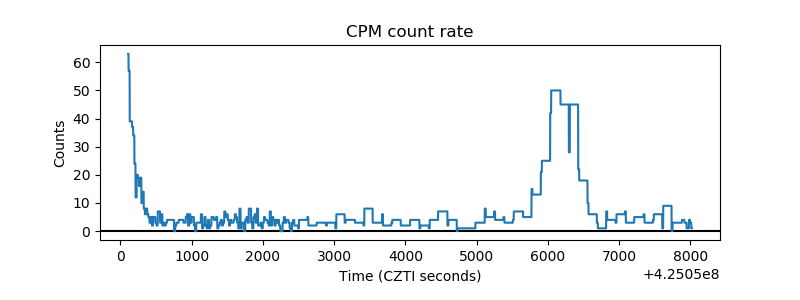 |
| CZT Counter | 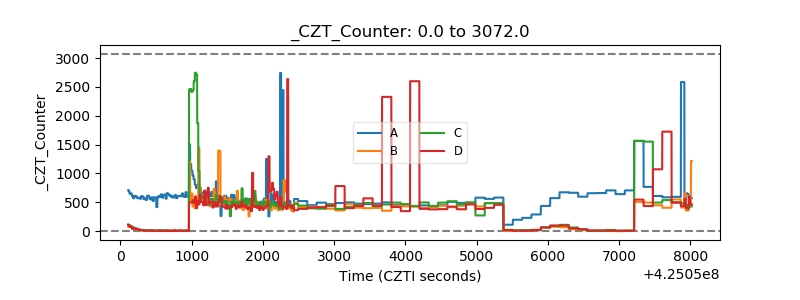 |
| +2.5 Volts monitor | 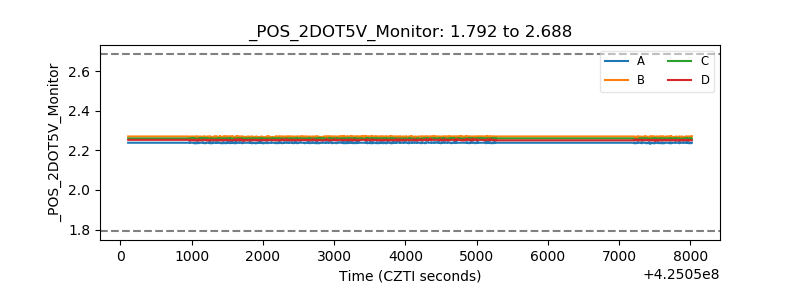 |
| +5 Volts monitor | 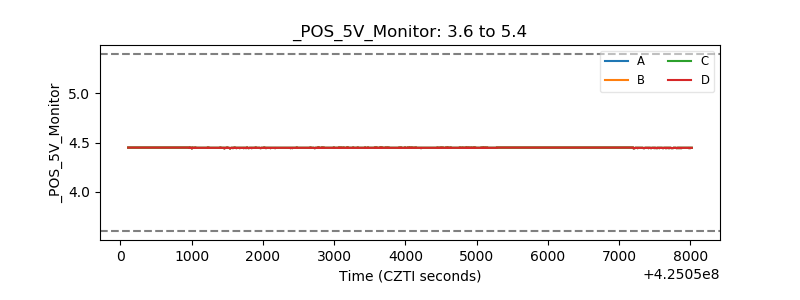 |
| _ROLL_ROT | 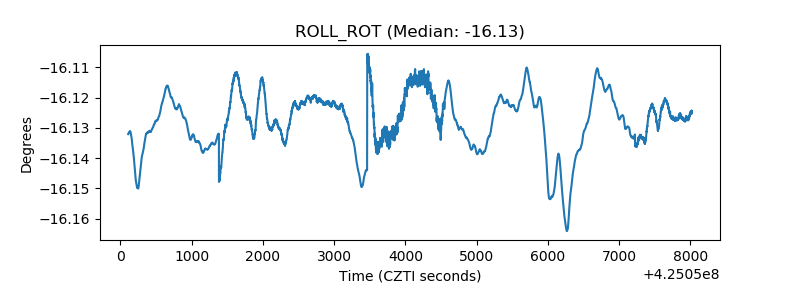 |
| _Roll_DEC | 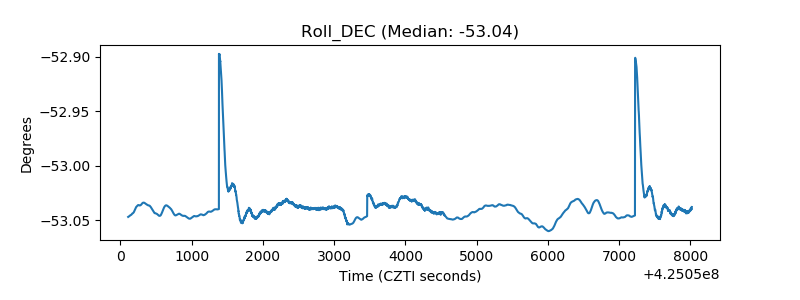 |
| _Roll_RA | 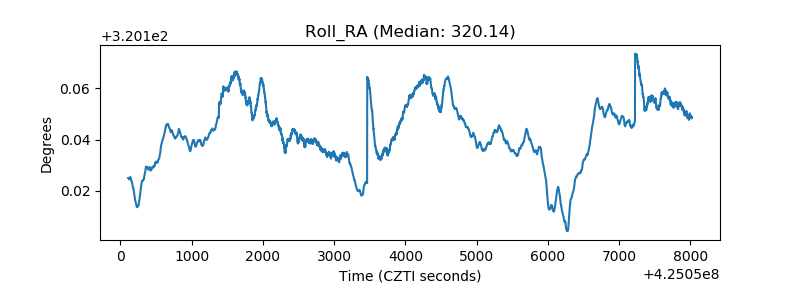 |
| Veto Counter | 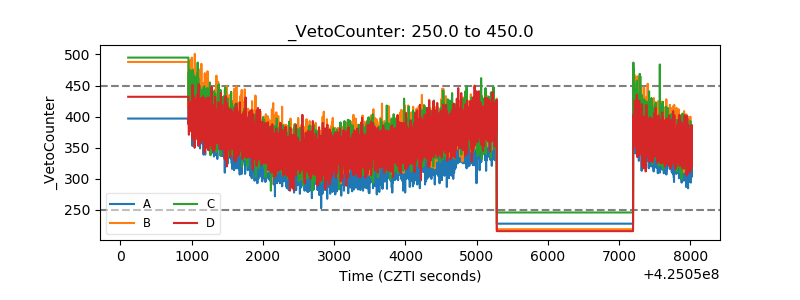 |