| Param | Original file | Final file |
|---|---|---|
| Filename | modeM0/AS1A12_052T04_9000005700_41797cztM0_level2.fits | modeM0/AS1A12_052T04_9000005700_41797cztM0_level2_quad_clean.evt |
| Size (bytes) | 280,609,920 | 76,737,600 |
| Size | 267.6 MB | 73.2 MB |
| Events in quadrant A | 2,832,596 | 507,200 |
| Events in quadrant B | 2,100,726 | 527,548 |
| Events in quadrant C | 2,602,129 | 490,840 |
| Events in quadrant D | 2,485,518 | 468,382 |
| Mode M9 | |||
|---|---|---|---|
| Quadrant | BADHDUFLAG | Total packets | Discarded packets |
| A | 0 | 16 | 0 |
| B | 0 | 16 | 0 |
| C | 0 | 16 | 0 |
| D | 0 | 16 | 0 |
| Mode SS | |||
|---|---|---|---|
| Quadrant | BADHDUFLAG | Total packets | Discarded packets |
| A | 0 | 96 | 0 |
| B | 0 | 96 | 0 |
| C | 0 | 96 | 0 |
| D | 0 | 97 | 1 |
| Mode M0 | |||
|---|---|---|---|
| Quadrant | BADHDUFLAG | Total packets | Discarded packets |
| A | 0 | 11715 | 409 |
| B | 0 | 9755 | 91 |
| C | 0 | 10675 | 83 |
| D | 0 | 10852 | 122 |
| Quadrant | Total seconds | Saturated seconds | Saturation percentage |
|---|---|---|---|
| A | 4670 | 108 | 2.312634% |
| B | 4708 | 11 | 0.233645% |
| C | 4707 | 131 | 2.783089% |
| D | 4689 | 59 | 1.258264% |
Noise dominated data is calculated using 1-second bins in cleaned event files. If a bin has >2000 counts, and if more than 50% of those come from <1% of pixels, then it is considered to be noise-dominated and hence unusable.
| Quadrant | # 1 sec bins | Bins with >0 counts | Bins with >2000 counts | High rate bins dominated by noise | Noise dominated (total time) | Noise dominated (detector-on time) | Marked lightcurve |
|---|---|---|---|---|---|---|---|
| A | 6338 | 4709 | 108 | 108 | 1.70% | 2.29% | 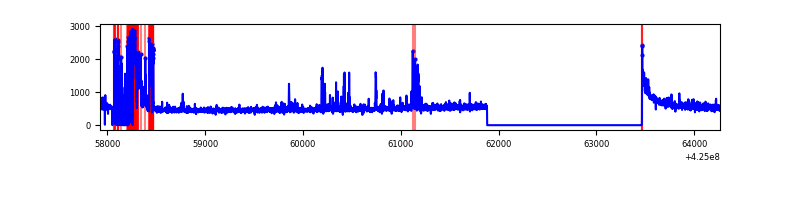 |
| B | 6338 | 4738 | 7 | 7 | 0.11% | 0.15% | 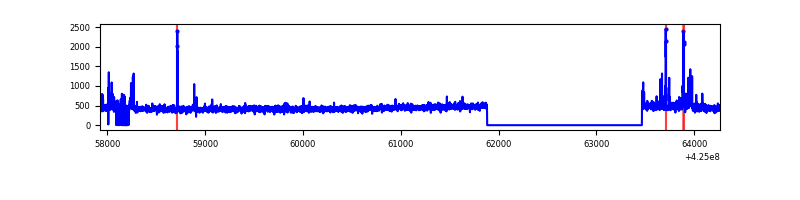 |
| C | 6338 | 4732 | 124 | 124 | 1.96% | 2.62% | 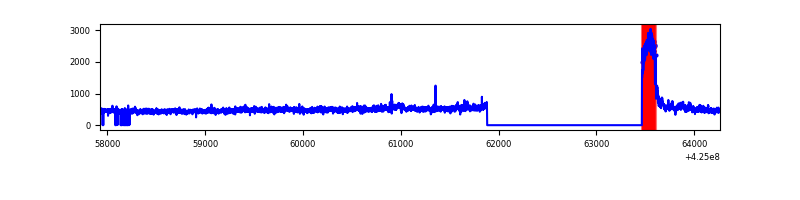 |
| D | 6338 | 4719 | 59 | 59 | 0.93% | 1.25% | 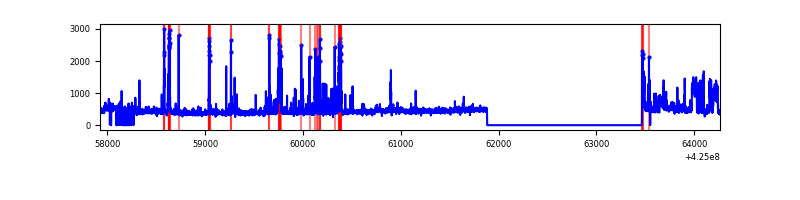 |
Top three noisy pixels from each quadrant. If the there are fewer than three noisy pixels in the level2.evt file, extra rows are filled as -1
| Pixel properties | Quadrant properties | ||||||
|---|---|---|---|---|---|---|---|
| Quadrant | DetID | PixID | Counts | Sigma | Mean | Median | Sigma |
| A | 10 | 83 | 414423 | 3989.8 | 499 | 490 | 103.7 |
| A | 15 | 223 | 395977 | 3812.01 | 499 | 490 | 103.7 |
| A | 2 | 79 | 84374 | 808.54 | 499 | 490 | 103.7 |
| B | 4 | 141 | 27090 | 270.76 | 503 | 488 | 98.2 |
| B | 0 | 186 | 25950 | 259.16 | 503 | 488 | 98.2 |
| B | 15 | 85 | 16175 | 159.67 | 503 | 488 | 98.2 |
| C | 0 | 10 | 525814 | 4589.59 | 484 | 489 | 114.5 |
| C | 15 | 214 | 181831 | 1584.32 | 484 | 489 | 114.5 |
| C | 13 | 61 | 3335 | 24.86 | 484 | 489 | 114.5 |
| D | 12 | 6 | 141203 | 1154.79 | 492 | 477 | 121.9 |
| D | 13 | 249 | 125021 | 1022.0 | 492 | 477 | 121.9 |
| D | 15 | 217 | 119566 | 977.24 | 492 | 477 | 121.9 |
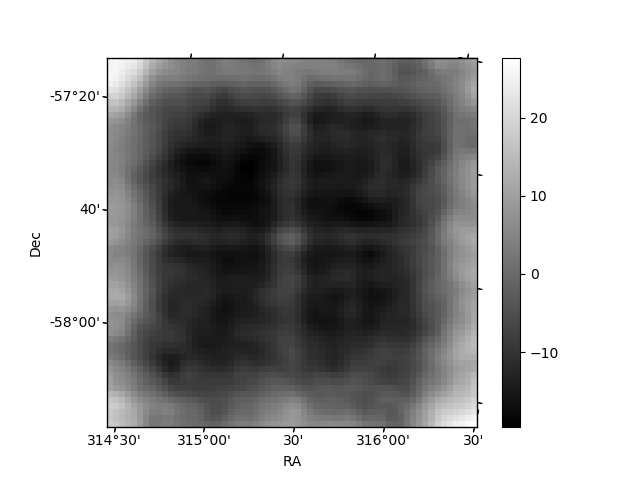
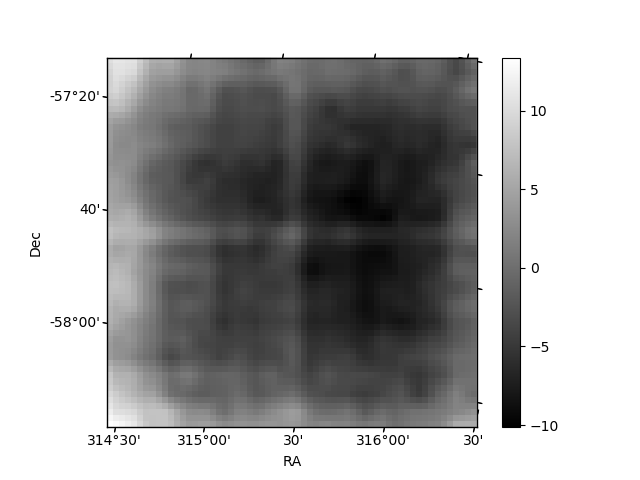
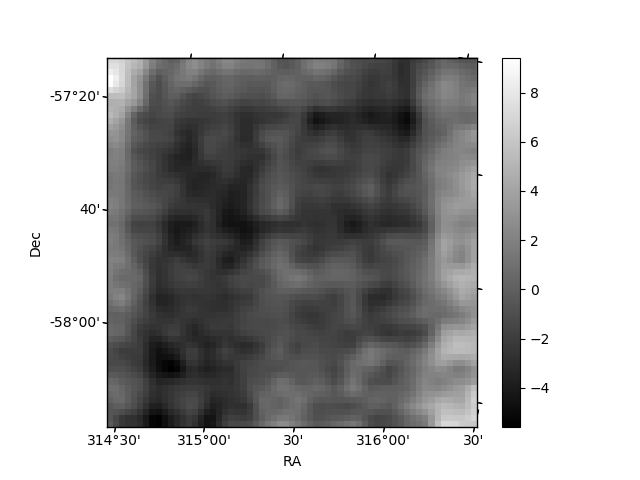
Histogram calculated using DETX and DETY for each event in the final _common_clean file
| Quadrant A | 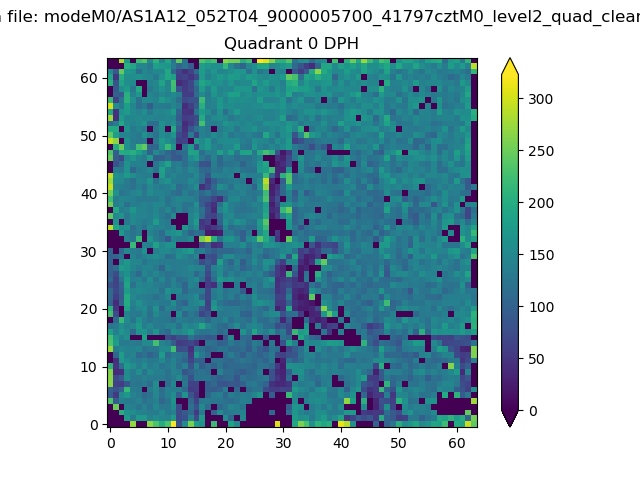 |
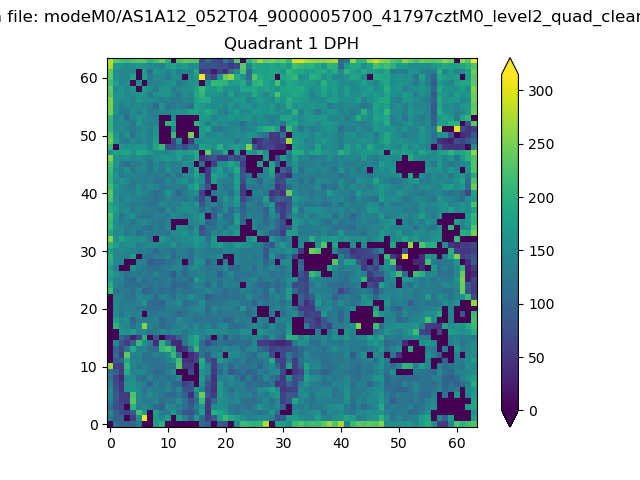 |
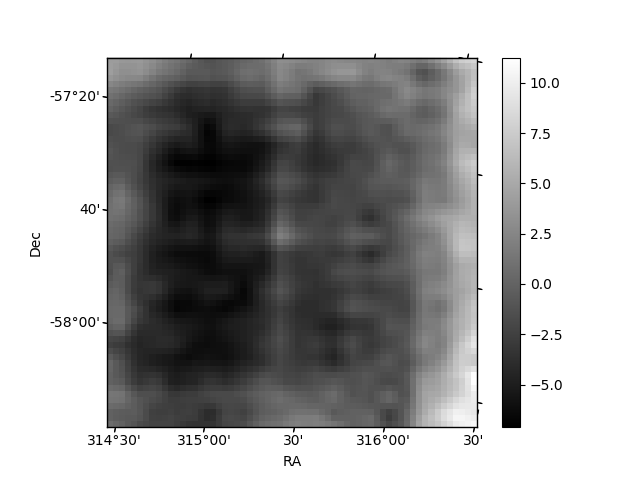
Quadrant B |
|---|---|---|---|
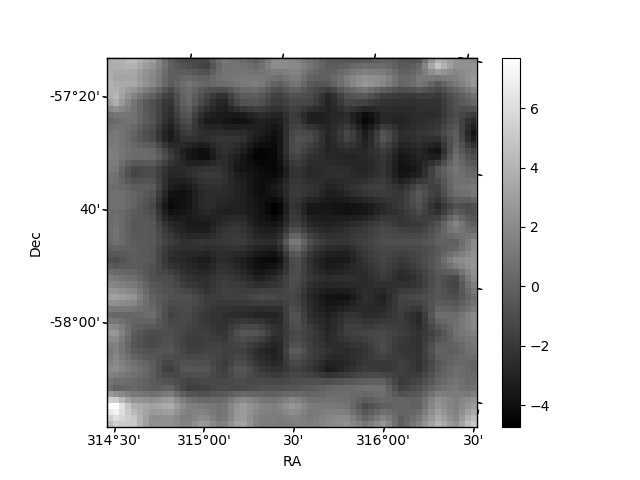
| Quadrant D |  |
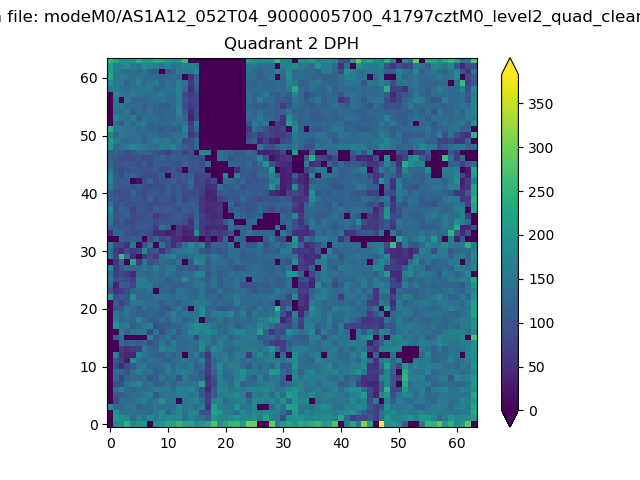 |
Quadrant C |
| Plot type | Count rate plots | Images |
|---|---|---|
| Comparison with Poisson distribution Blue bars denote a histogram of data divided into 1 sec bins. Red curve is a Poisson curve with rate = median count rate of data. |
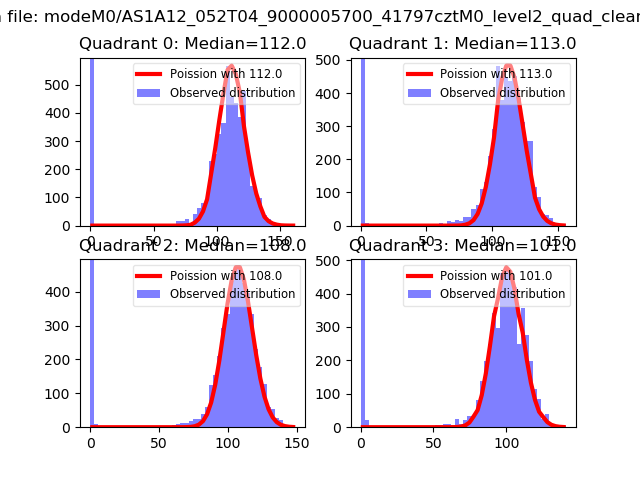 |
 |
| Quadrant-wise count rates Data is divided into 100 sec bins |
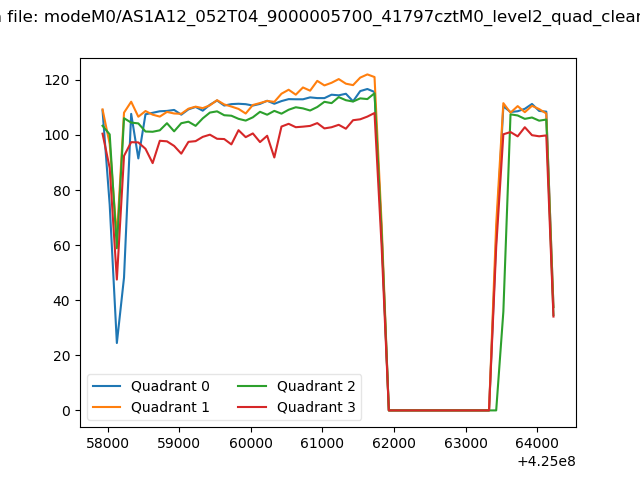 |
|
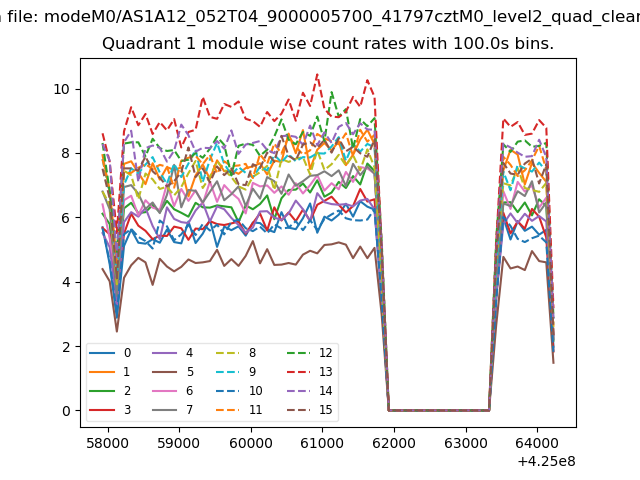
| Module-wise count rates for Quadrant A Data is divided into 100 sec bins |
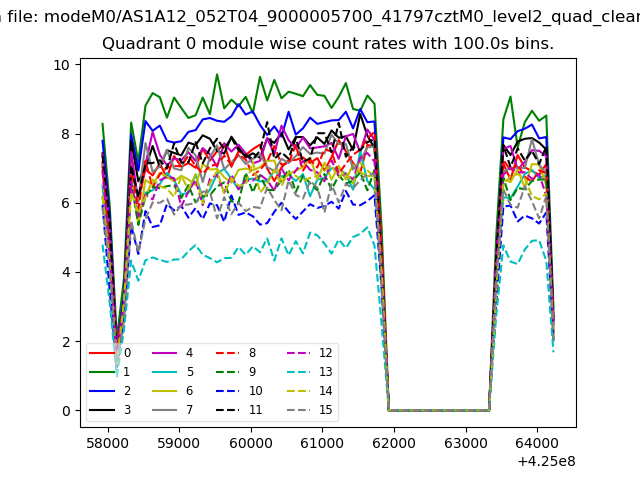 |
 |
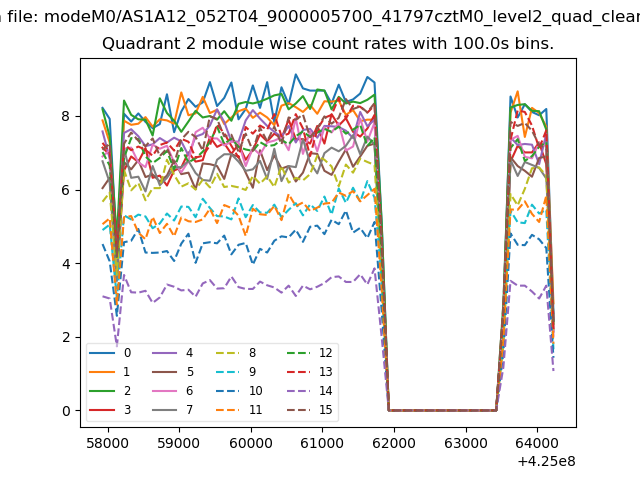
| Module-wise count rates for Quadrant B Data is divided into 100 sec bins |
 |
 |
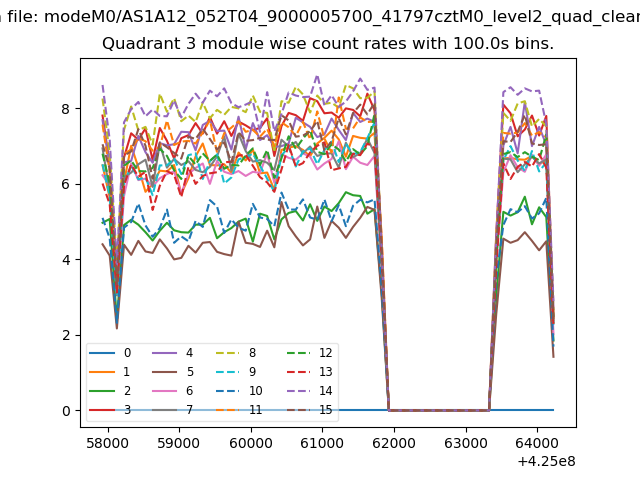
| Module-wise count rates for Quadrant C Data is divided into 100 sec bins |
 |
 |
| Module-wise count rates for Quadrant D Data is divided into 100 sec bins |
 |
 |
| Parameter | Plot |
|---|---|
| CZT HV Monitor | 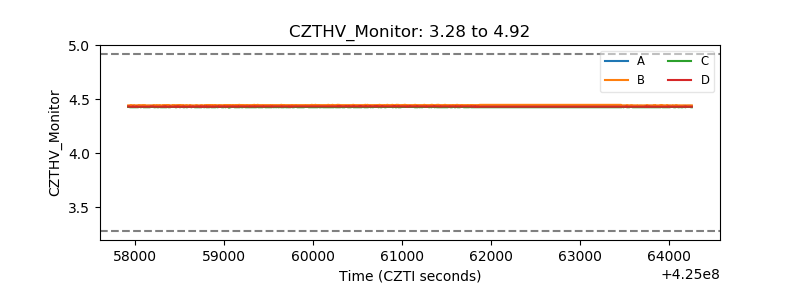 |
| D_VDD | 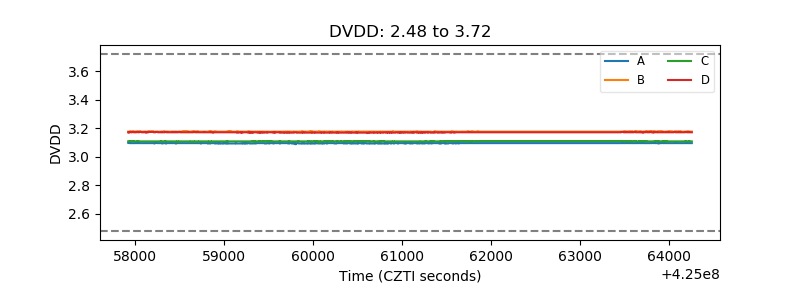 |
| Temperature 1 | 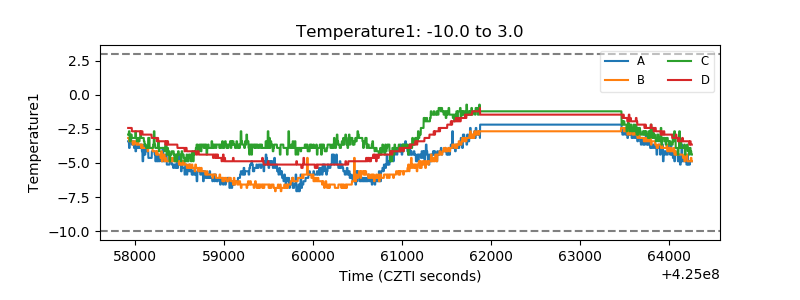 |
| Veto HV Monitor | 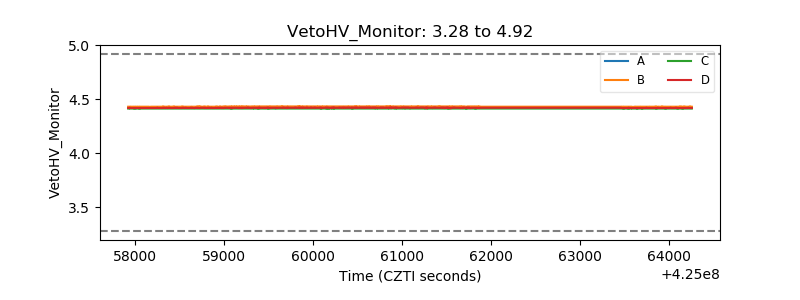 |
| Veto LLD | 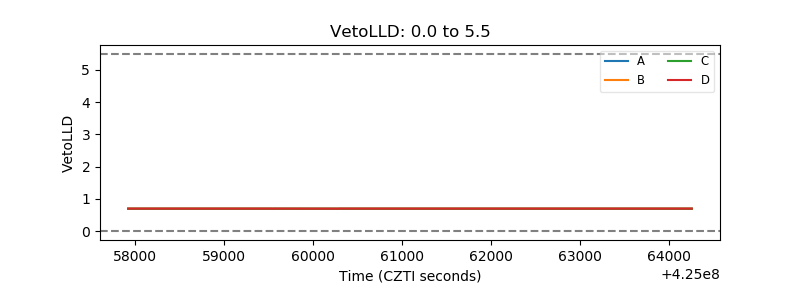 |
| Alpha Counter | 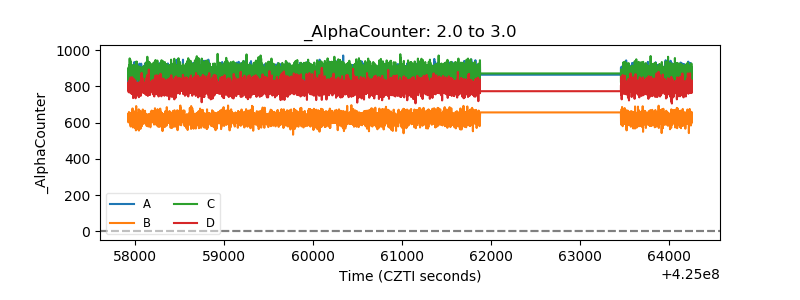 |
| _CPM_Rate | 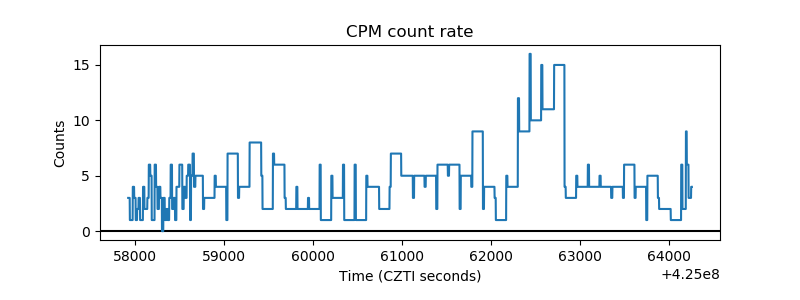 |
| CZT Counter | 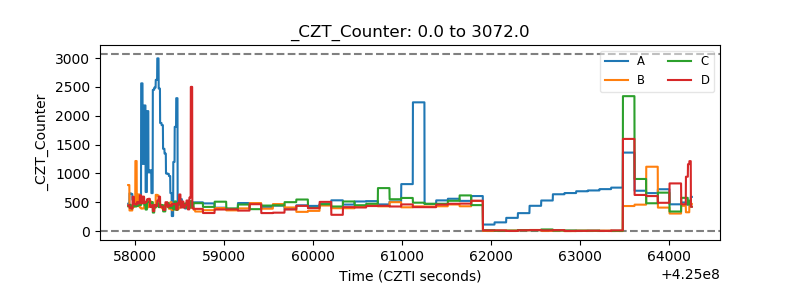 |
| +2.5 Volts monitor | 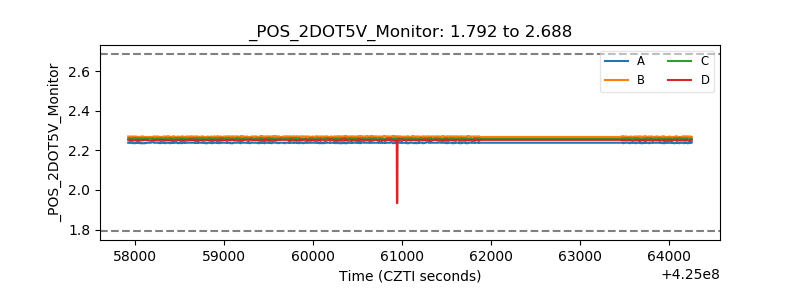 |
| +5 Volts monitor | 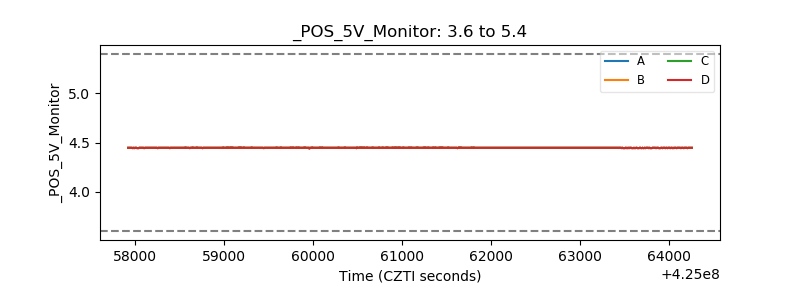 |
| _ROLL_ROT | 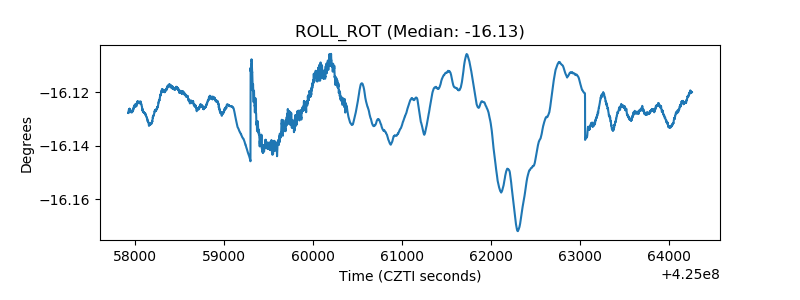 |
| _Roll_DEC | 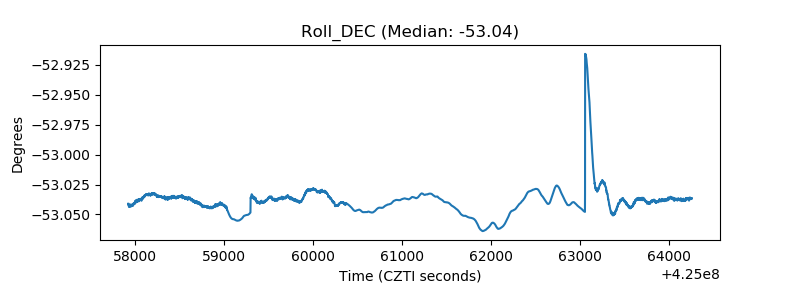 |
| _Roll_RA | 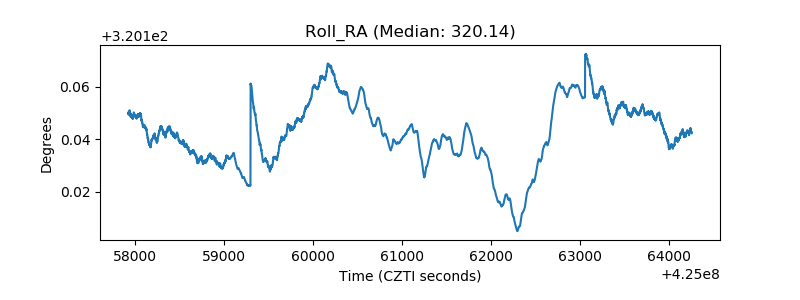 |
| Veto Counter | 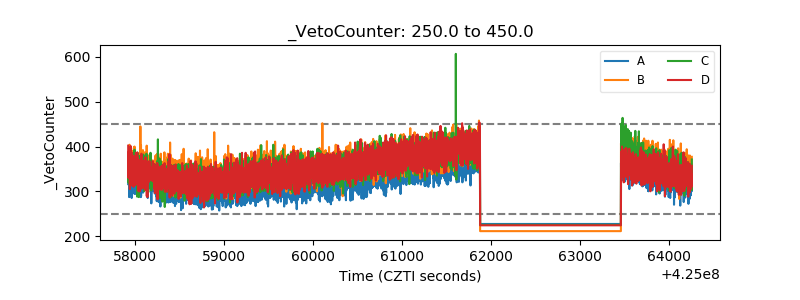 |