| Param | Original file | Final file |
|---|---|---|
| Filename | modeM0/AS1A12_052T04_9000005700_41798cztM0_level2.fits | modeM0/AS1A12_052T04_9000005700_41798cztM0_level2_quad_clean.evt |
| Size (bytes) | 359,383,680 | 92,361,600 |
| Size | 342.7 MB | 88.1 MB |
| Events in quadrant A | 3,102,135 | 629,641 |
| Events in quadrant B | 2,576,187 | 636,242 |
| Events in quadrant C | 3,403,546 | 586,420 |
| Events in quadrant D | 3,775,563 | 544,265 |
| Mode M9 | |||
|---|---|---|---|
| Quadrant | BADHDUFLAG | Total packets | Discarded packets |
| A | 0 | 29 | 0 |
| B | 0 | 30 | 0 |
| C | 0 | 30 | 0 |
| D | 0 | 30 | 0 |
| Mode SS | |||
|---|---|---|---|
| Quadrant | BADHDUFLAG | Total packets | Discarded packets |
| A | 0 | 118 | 0 |
| B | 0 | 118 | 0 |
| C | 0 | 118 | 0 |
| D | 0 | 118 | 0 |
| Mode M0 | |||
|---|---|---|---|
| Quadrant | BADHDUFLAG | Total packets | Discarded packets |
| A | 0 | 12770 | 2 |
| B | 0 | 11782 | 2 |
| C | 0 | 13757 | 2 |
| D | 0 | 15271 | 2 |
| Quadrant | Total seconds | Saturated seconds | Saturation percentage |
|---|---|---|---|
| A | 5723 | 15 | 0.262100% |
| B | 5723 | 17 | 0.297047% |
| C | 5723 | 249 | 4.350865% |
| D | 5723 | 302 | 5.276953% |
Noise dominated data is calculated using 1-second bins in cleaned event files. If a bin has >2000 counts, and if more than 50% of those come from <1% of pixels, then it is considered to be noise-dominated and hence unusable.
| Quadrant | # 1 sec bins | Bins with >0 counts | Bins with >2000 counts | High rate bins dominated by noise | Noise dominated (total time) | Noise dominated (detector-on time) | Marked lightcurve |
|---|---|---|---|---|---|---|---|
| A | 7095 | 5724 | 9 | 9 | 0.13% | 0.16% | 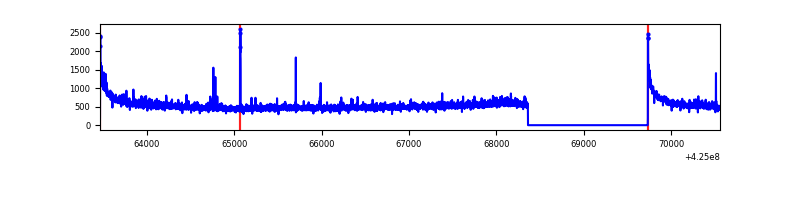 |
| B | 7094 | 5722 | 8 | 8 | 0.11% | 0.14% | 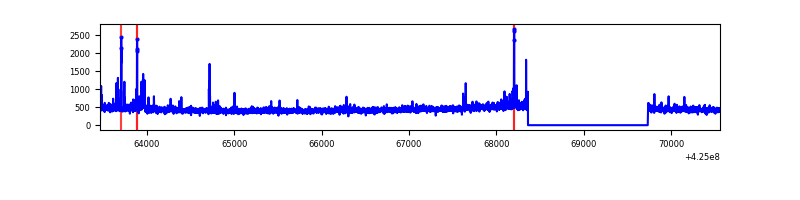 |
| C | 7094 | 5722 | 240 | 240 | 3.38% | 4.19% | 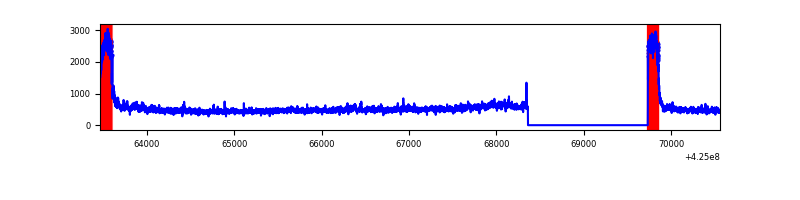 |
| D | 7094 | 5722 | 305 | 305 | 4.30% | 5.33% | 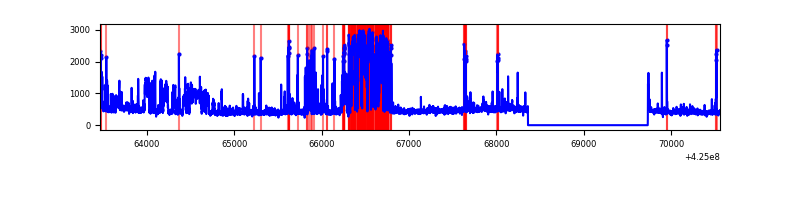 |
Top three noisy pixels from each quadrant. If the there are fewer than three noisy pixels in the level2.evt file, extra rows are filled as -1
| Pixel properties | Quadrant properties | ||||||
|---|---|---|---|---|---|---|---|
| Quadrant | DetID | PixID | Counts | Sigma | Mean | Median | Sigma |
| A | 10 | 83 | 573611 | 4440.78 | 621 | 607 | 129.0 |
| A | 12 | 189 | 74471 | 572.45 | 621 | 607 | 129.0 |
| A | 15 | 223 | 40978 | 312.88 | 621 | 607 | 129.0 |
| B | 5 | 255 | 30925 | 254.42 | 615 | 599 | 119.2 |
| B | 0 | 186 | 26144 | 214.31 | 615 | 599 | 119.2 |
| B | 0 | 245 | 22269 | 181.8 | 615 | 599 | 119.2 |
| C | 0 | 10 | 886656 | 6436.46 | 586 | 590 | 137.7 |
| C | 15 | 214 | 223674 | 1620.5 | 586 | 590 | 137.7 |
| C | 12 | 249 | 4749 | 30.21 | 586 | 590 | 137.7 |
| D | 12 | 6 | 548787 | 3741.95 | 592 | 573 | 146.5 |
| D | 13 | 249 | 410816 | 2800.2 | 592 | 573 | 146.5 |
| D | 15 | 217 | 273807 | 1865.02 | 592 | 573 | 146.5 |
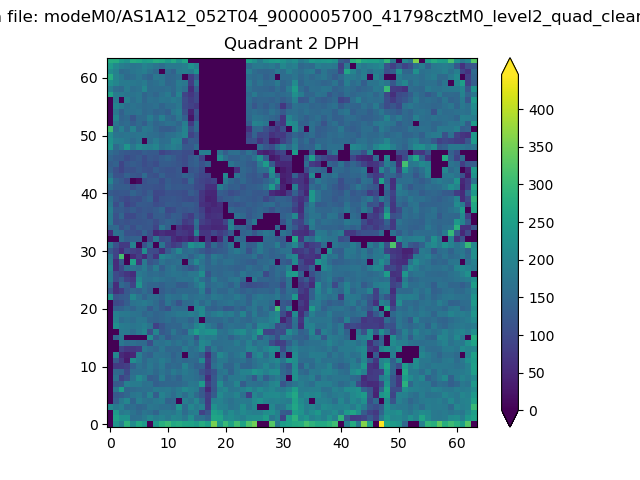
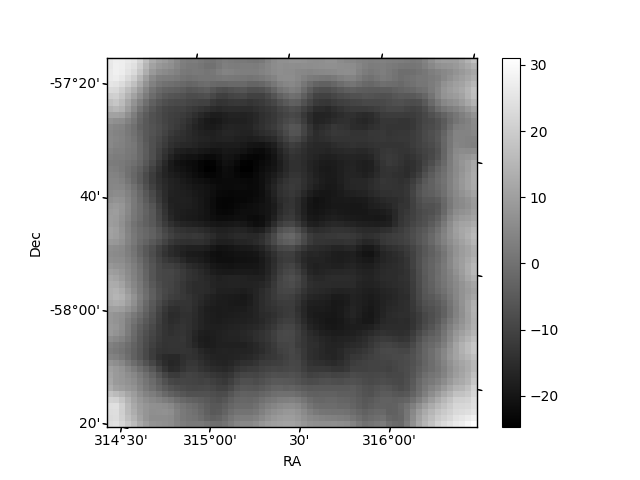
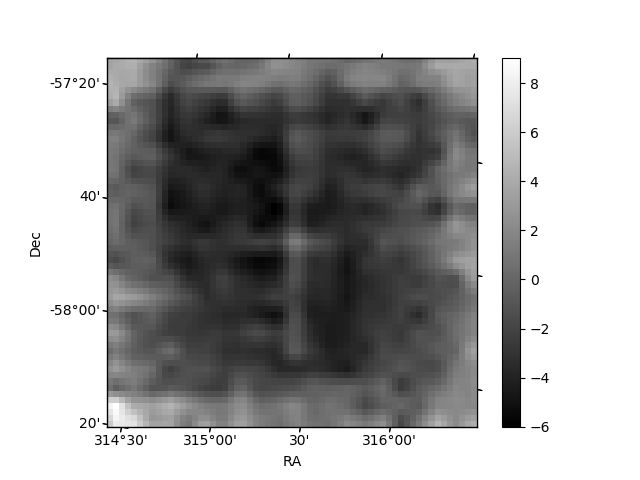
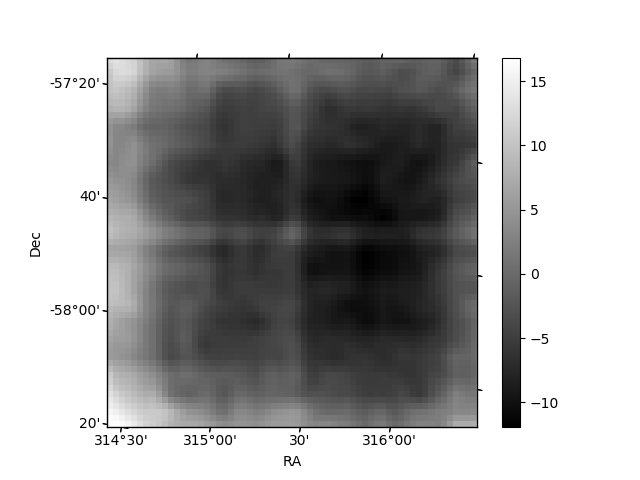
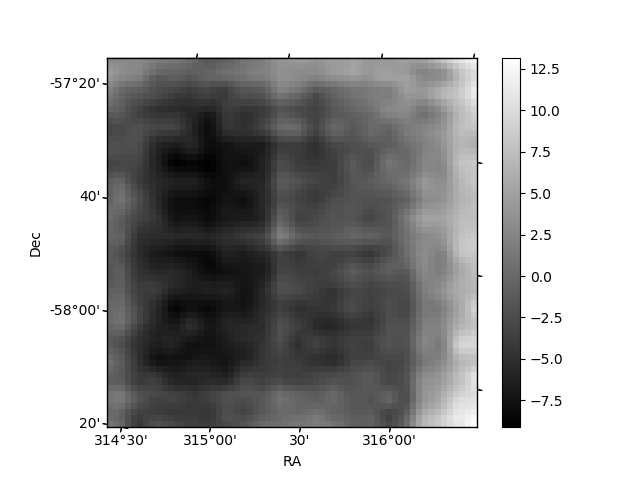
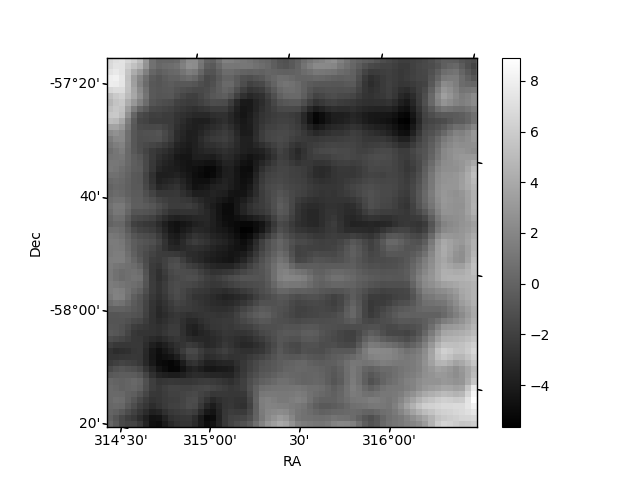
Histogram calculated using DETX and DETY for each event in the final _common_clean file
| Quadrant A | 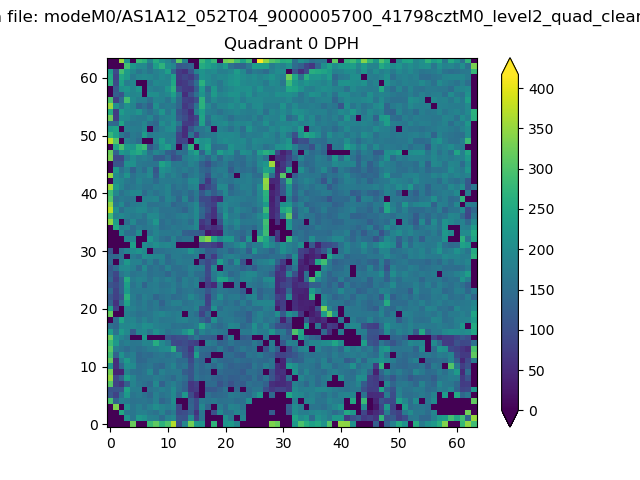 |
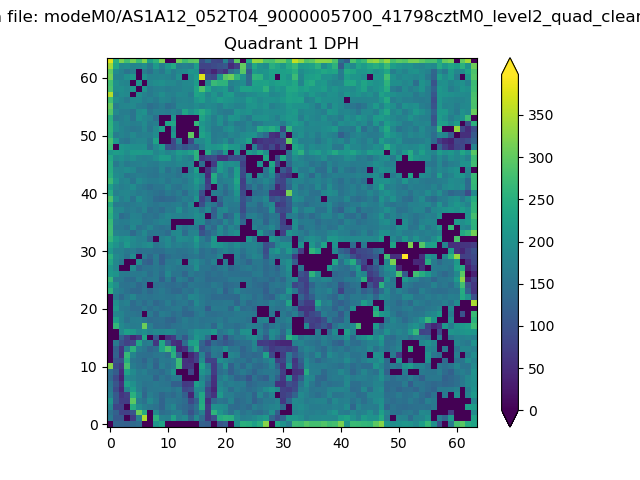 |
Quadrant B |
|---|---|---|---|
| Quadrant D | 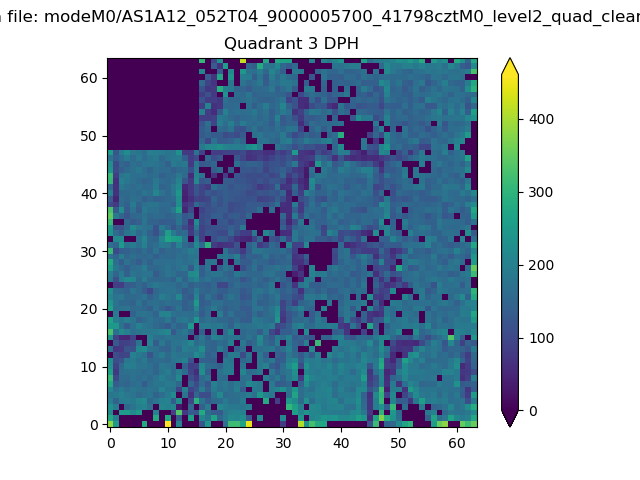 |
 |
Quadrant C |
| Plot type | Count rate plots | Images |
|---|---|---|
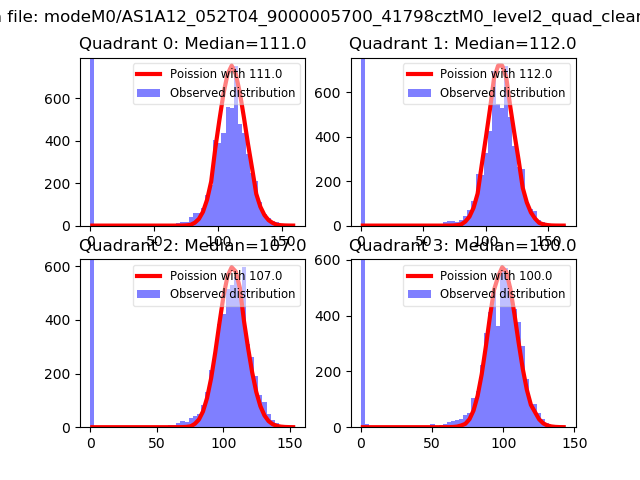
| Comparison with Poisson distribution Blue bars denote a histogram of data divided into 1 sec bins. Red curve is a Poisson curve with rate = median count rate of data. |
 |
 |
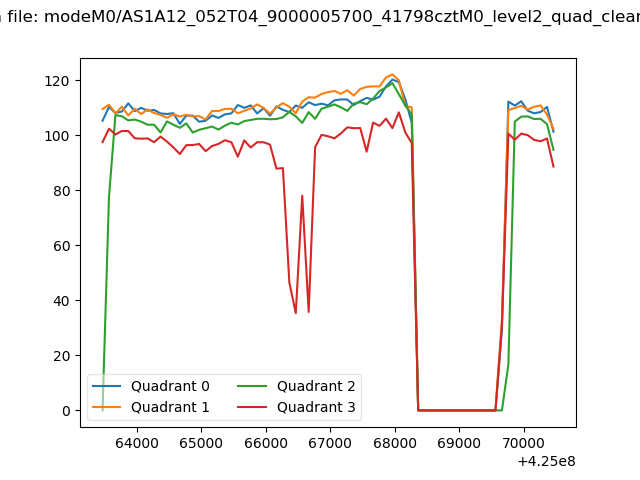
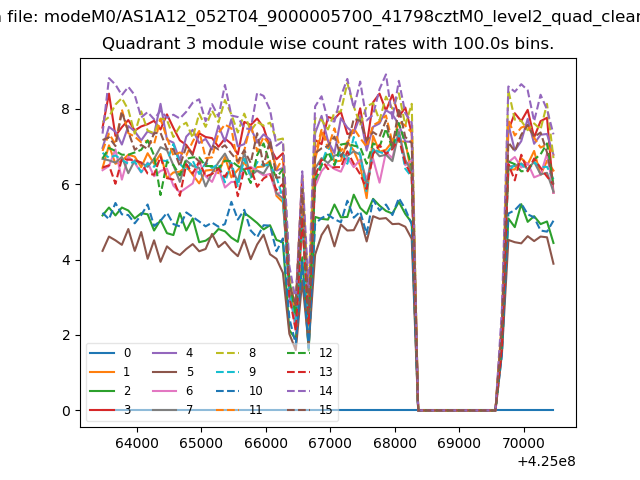
| Quadrant-wise count rates Data is divided into 100 sec bins |
 |
|
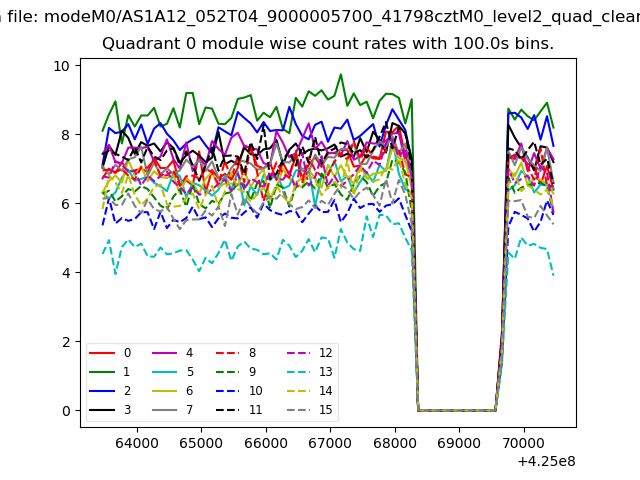
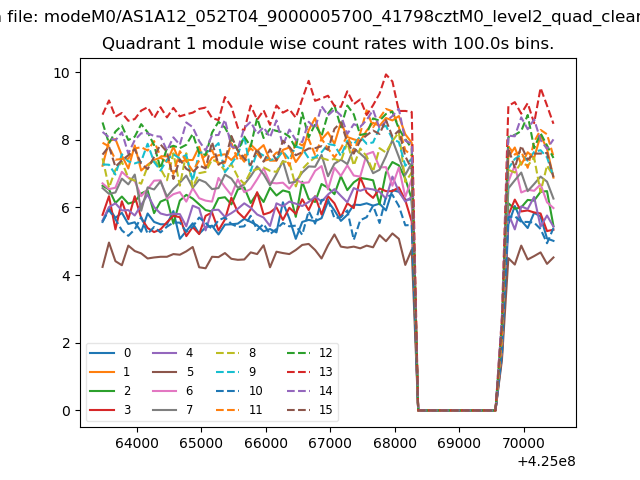
| Module-wise count rates for Quadrant A Data is divided into 100 sec bins |
 |
 |
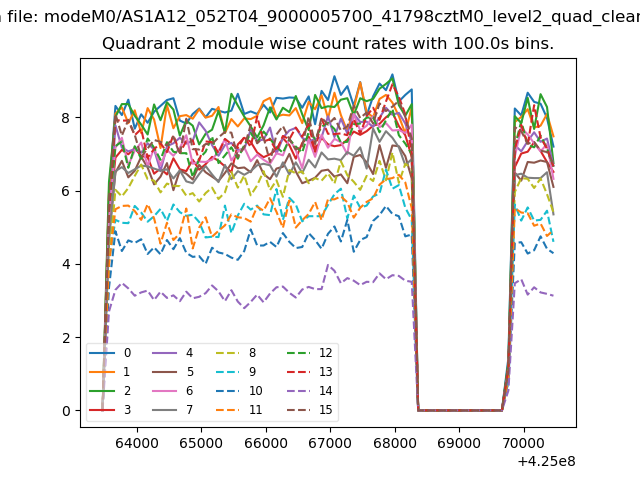
| Module-wise count rates for Quadrant B Data is divided into 100 sec bins |
 |
 |
| Module-wise count rates for Quadrant C Data is divided into 100 sec bins |
 |
 |
| Module-wise count rates for Quadrant D Data is divided into 100 sec bins |
 |
 |
| Parameter | Plot |
|---|---|
| CZT HV Monitor | 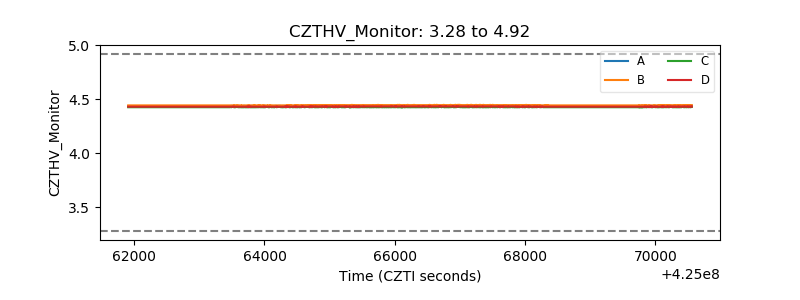 |
| D_VDD | 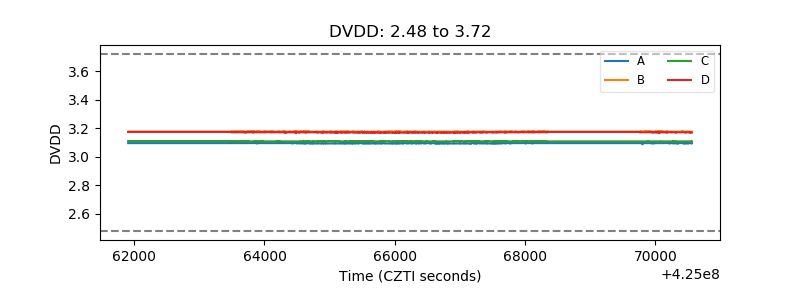 |
| Temperature 1 | 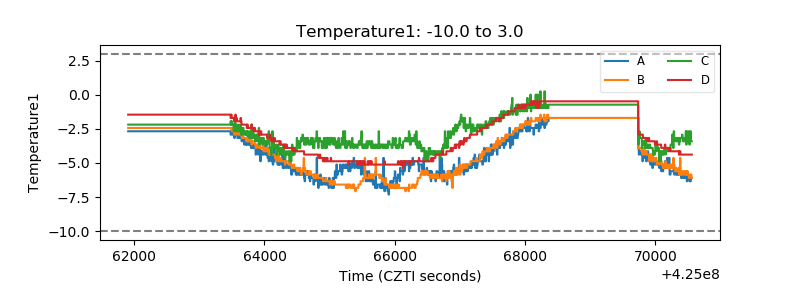 |
| Veto HV Monitor | 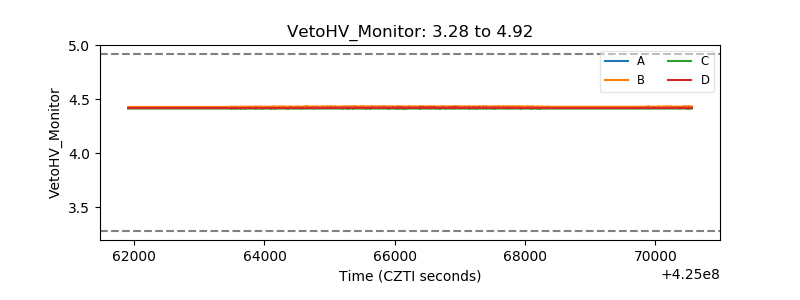 |
| Veto LLD |  |
| Alpha Counter | 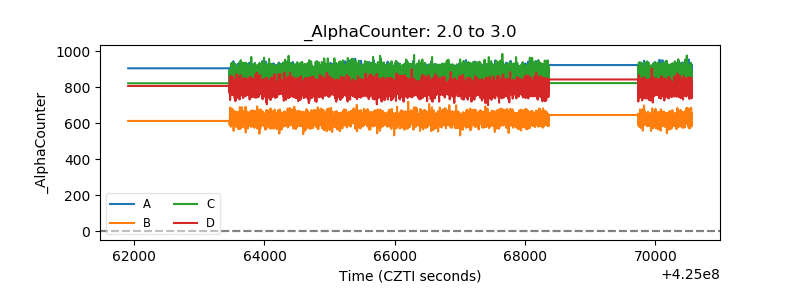 |
| _CPM_Rate | 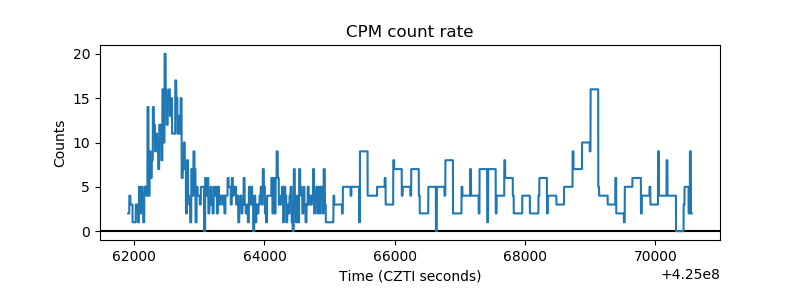 |
| CZT Counter | 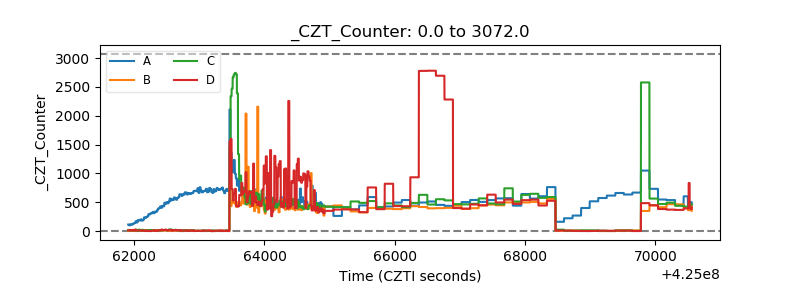 |
| +2.5 Volts monitor | 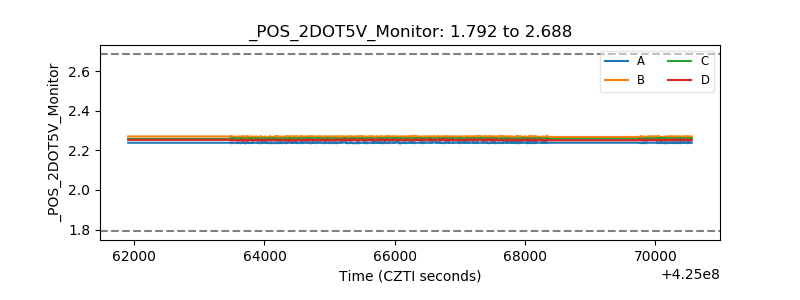 |
| +5 Volts monitor | 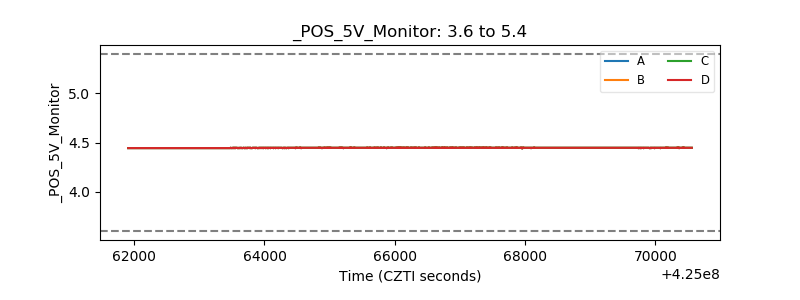 |
| _ROLL_ROT | 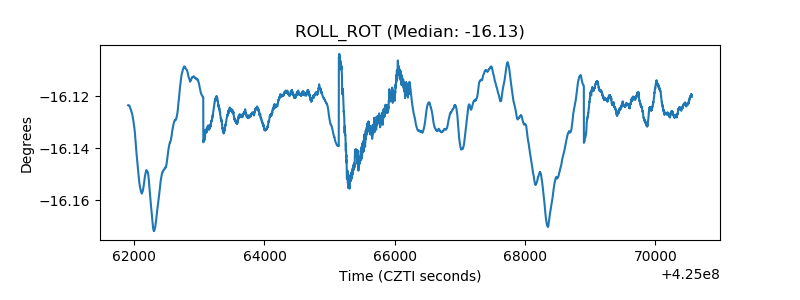 |
| _Roll_DEC | 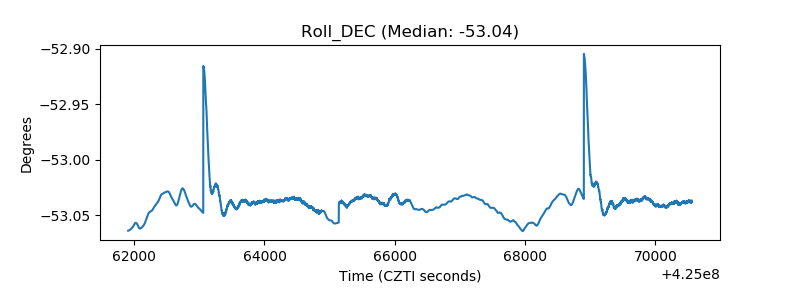 |
| _Roll_RA | 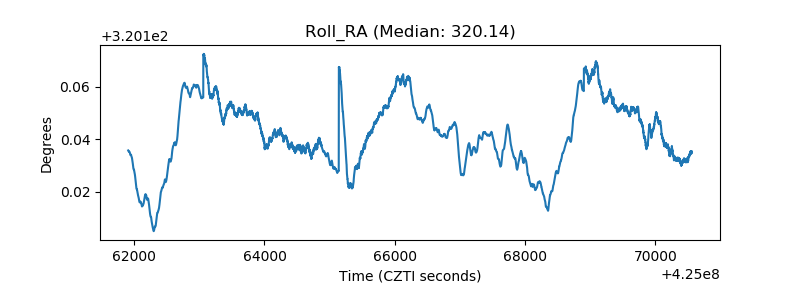 |
| Veto Counter | 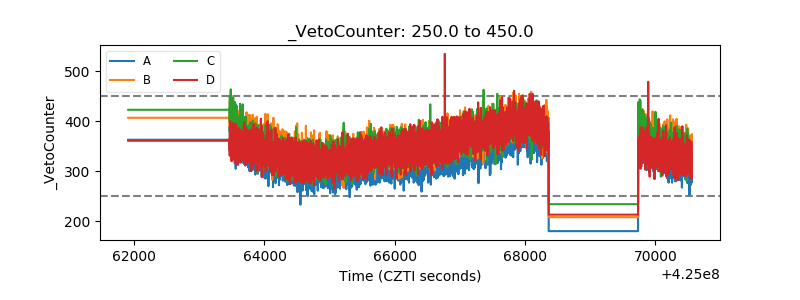 |