| Param | Original file | Final file |
|---|---|---|
| Filename | modeM0/AS1A12_052T04_9000005700_41799cztM0_level2.fits | modeM0/AS1A12_052T04_9000005700_41799cztM0_level2_quad_clean.evt |
| Size (bytes) | 352,376,640 | 96,995,520 |
| Size | 336.1 MB | 92.5 MB |
| Events in quadrant A | 3,358,760 | 652,774 |
| Events in quadrant B | 2,736,444 | 663,076 |
| Events in quadrant C | 3,465,813 | 613,966 |
| Events in quadrant D | 3,014,857 | 587,637 |
| Mode M9 | |||
|---|---|---|---|
| Quadrant | BADHDUFLAG | Total packets | Discarded packets |
| A | 0 | 18 | 0 |
| B | 0 | 19 | 0 |
| C | 0 | 19 | 0 |
| D | 0 | 19 | 0 |
| Mode SS | |||
|---|---|---|---|
| Quadrant | BADHDUFLAG | Total packets | Discarded packets |
| A | 0 | 122 | 0 |
| B | 0 | 122 | 0 |
| C | 0 | 121 | 0 |
| D | 0 | 122 | 0 |
| Mode M0 | |||
|---|---|---|---|
| Quadrant | BADHDUFLAG | Total packets | Discarded packets |
| A | 0 | 13794 | 2 |
| B | 0 | 12484 | 2 |
| C | 0 | 13974 | 9 |
| D | 0 | 13429 | 5 |
| Quadrant | Total seconds | Saturated seconds | Saturation percentage |
|---|---|---|---|
| A | 6008 | 24 | 0.399467% |
| B | 6008 | 29 | 0.482690% |
| C | 6007 | 233 | 3.878808% |
| D | 6006 | 89 | 1.481851% |
Noise dominated data is calculated using 1-second bins in cleaned event files. If a bin has >2000 counts, and if more than 50% of those come from <1% of pixels, then it is considered to be noise-dominated and hence unusable.
| Quadrant | # 1 sec bins | Bins with >0 counts | Bins with >2000 counts | High rate bins dominated by noise | Noise dominated (total time) | Noise dominated (detector-on time) | Marked lightcurve |
|---|---|---|---|---|---|---|---|
| A | 7321 | 6009 | 17 | 17 | 0.23% | 0.28% | 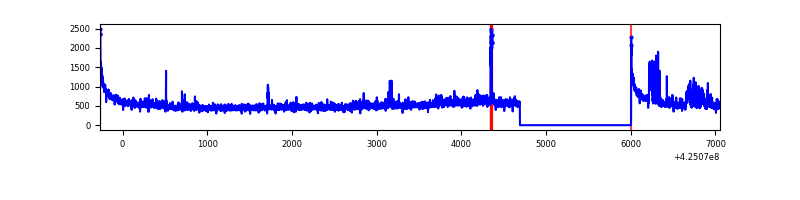 |
| B | 7320 | 6007 | 19 | 19 | 0.26% | 0.32% | 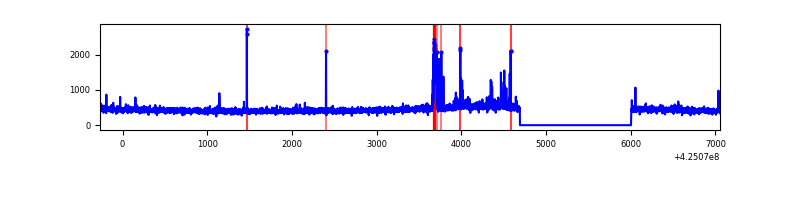 |
| C | 7320 | 6007 | 228 | 228 | 3.11% | 3.80% | 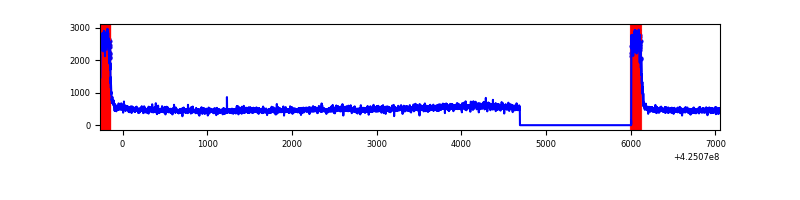 |
| D | 7320 | 6006 | 86 | 86 | 1.17% | 1.43% | 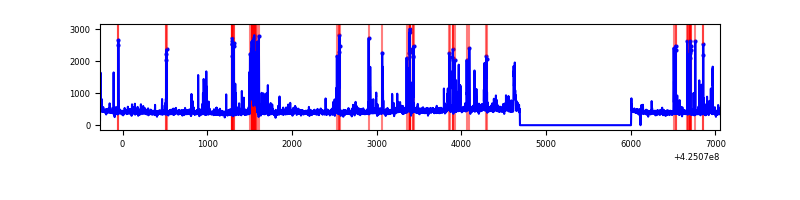 |
Top three noisy pixels from each quadrant. If the there are fewer than three noisy pixels in the level2.evt file, extra rows are filled as -1
| Pixel properties | Quadrant properties | ||||||
|---|---|---|---|---|---|---|---|
| Quadrant | DetID | PixID | Counts | Sigma | Mean | Median | Sigma |
| A | 10 | 83 | 587758 | 4371.82 | 651 | 638 | 134.3 |
| A | 15 | 223 | 168952 | 1253.3 | 651 | 638 | 134.3 |
| A | 12 | 189 | 68134 | 502.59 | 651 | 638 | 134.3 |
| B | 5 | 255 | 93456 | 736.5 | 648 | 631 | 126.0 |
| B | 15 | 35 | 25416 | 196.65 | 648 | 631 | 126.0 |
| B | 0 | 183 | 23174 | 178.86 | 648 | 631 | 126.0 |
| C | 0 | 10 | 795842 | 5454.36 | 622 | 626 | 145.8 |
| C | 15 | 214 | 238039 | 1628.41 | 622 | 626 | 145.8 |
| C | 13 | 61 | 4173 | 24.33 | 622 | 626 | 145.8 |
| D | 13 | 249 | 323600 | 2086.27 | 634 | 618 | 154.8 |
| D | 10 | 199 | 79815 | 511.57 | 634 | 618 | 154.8 |
| D | 12 | 6 | 64650 | 413.61 | 634 | 618 | 154.8 |
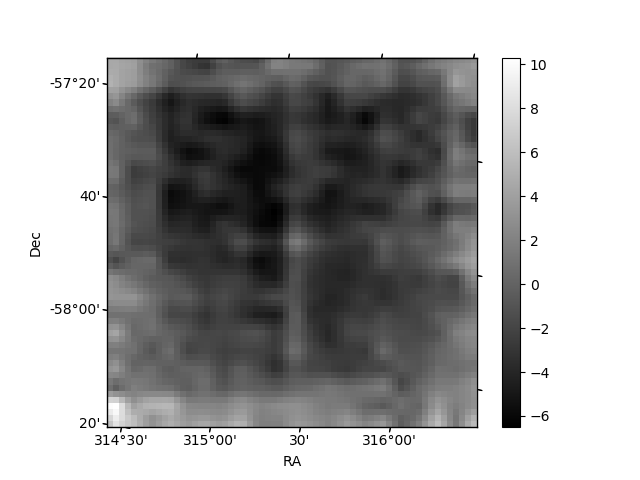
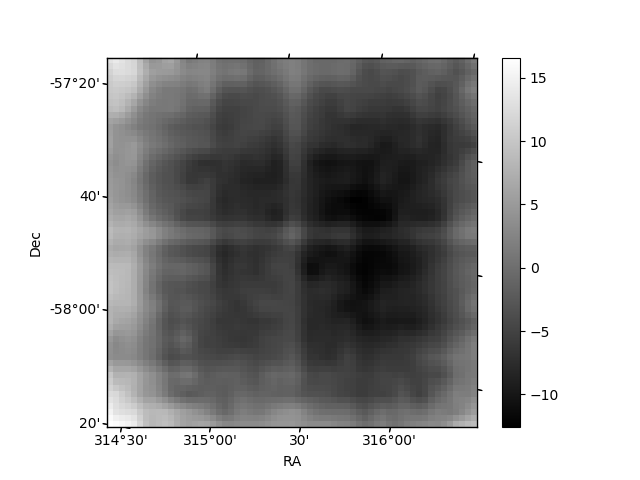
Histogram calculated using DETX and DETY for each event in the final _common_clean file
| Quadrant A | 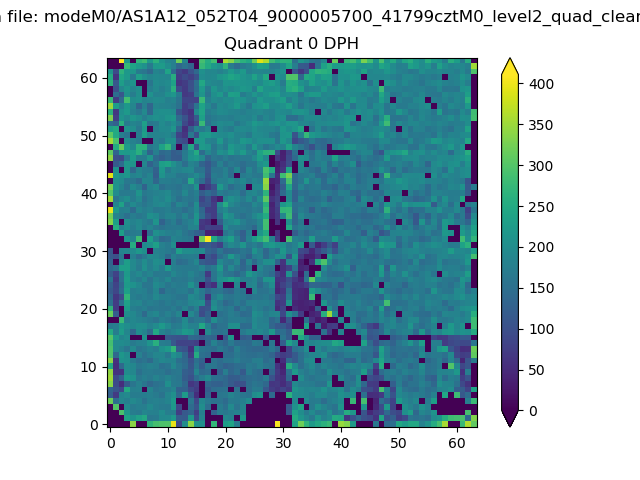 |
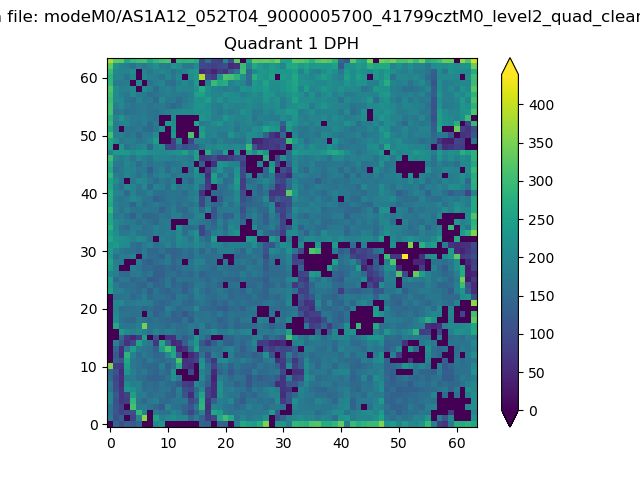 |
Quadrant B |
|---|---|---|---|
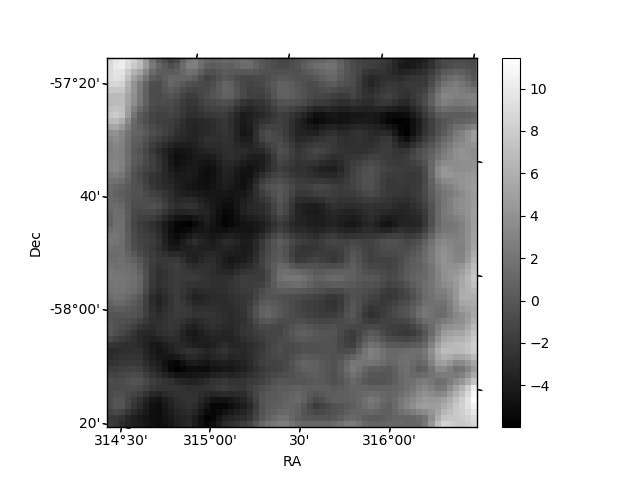
| Quadrant D | 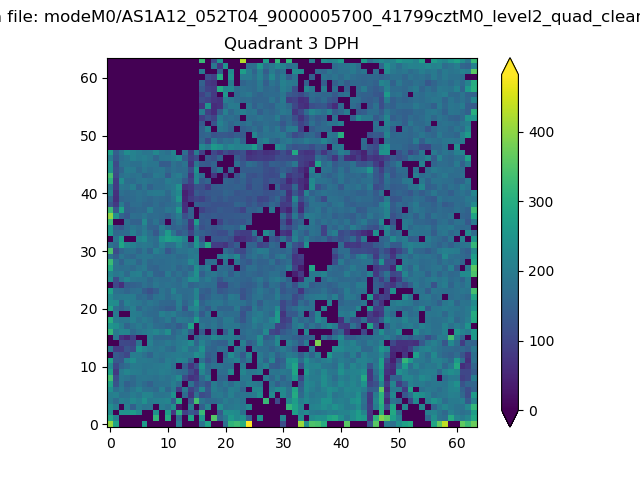 |
 |
Quadrant C |
| Plot type | Count rate plots | Images |
|---|---|---|
| Comparison with Poisson distribution Blue bars denote a histogram of data divided into 1 sec bins. Red curve is a Poisson curve with rate = median count rate of data. |
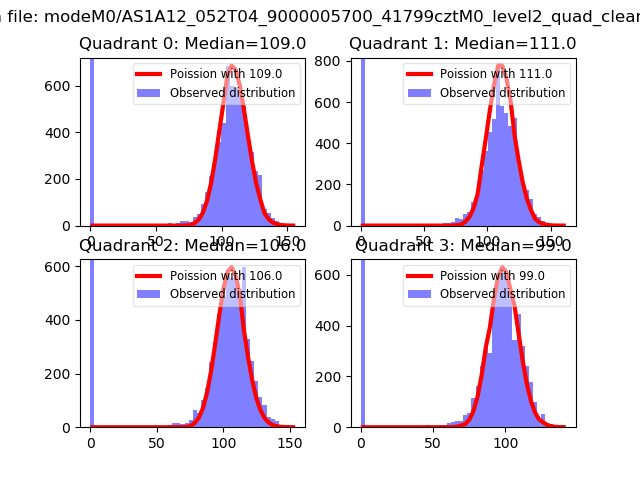 |
 |
| Quadrant-wise count rates Data is divided into 100 sec bins |
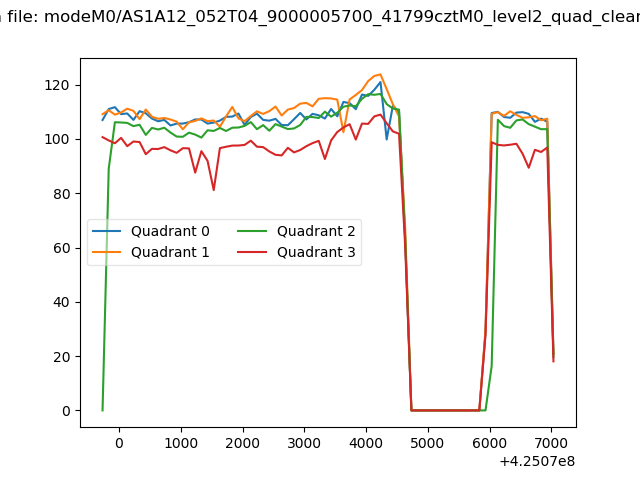 |
|
| Module-wise count rates for Quadrant A Data is divided into 100 sec bins |
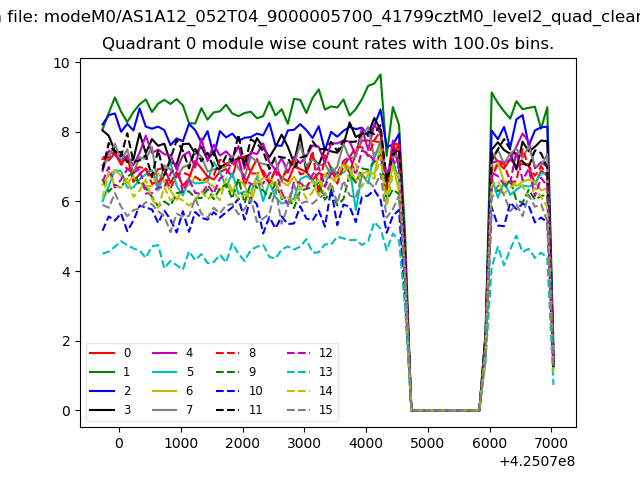 |
 |
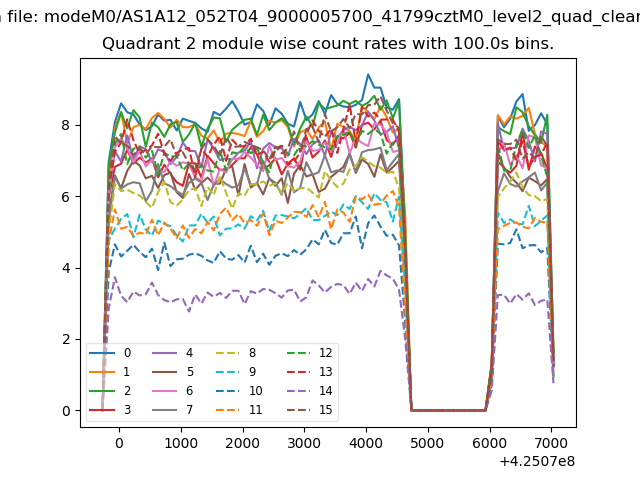
| Module-wise count rates for Quadrant B Data is divided into 100 sec bins |
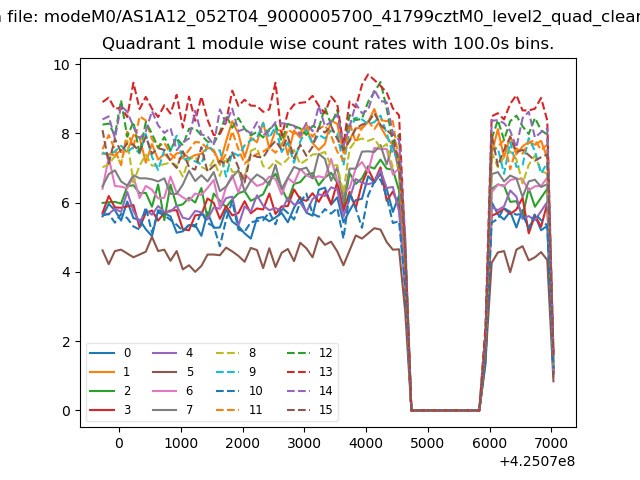 |
 |
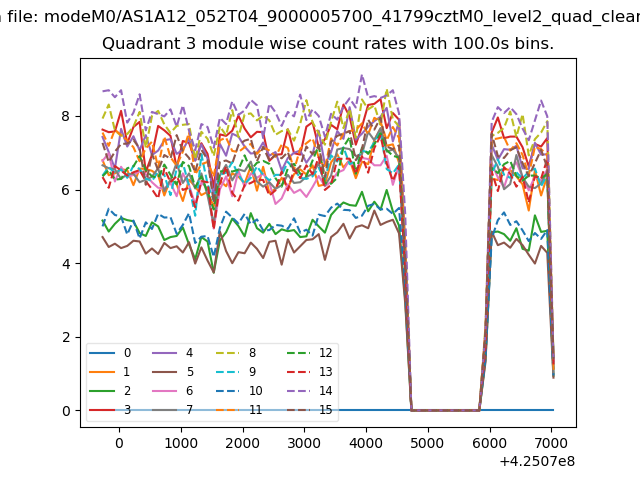
| Module-wise count rates for Quadrant C Data is divided into 100 sec bins |
 |
 |
| Module-wise count rates for Quadrant D Data is divided into 100 sec bins |
 |
 |
| Parameter | Plot |
|---|---|
| CZT HV Monitor | 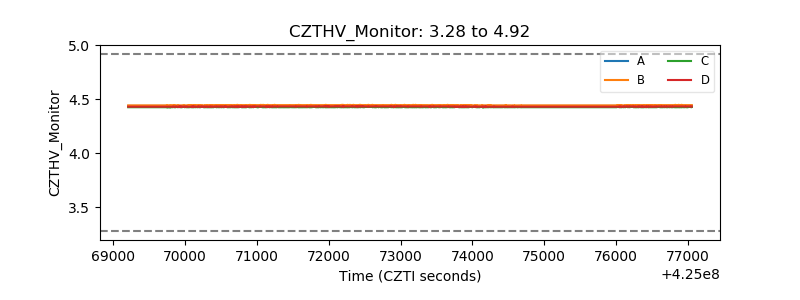 |
| D_VDD | 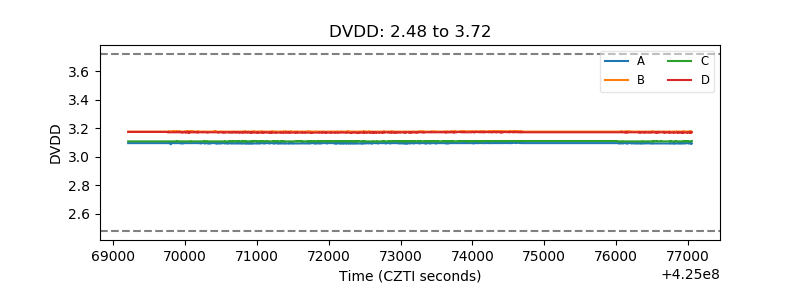 |
| Temperature 1 | 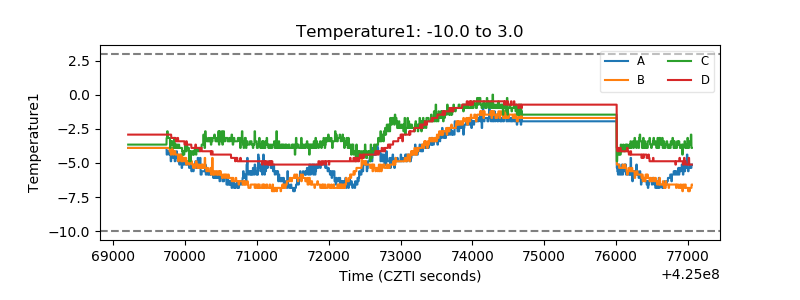 |
| Veto HV Monitor | 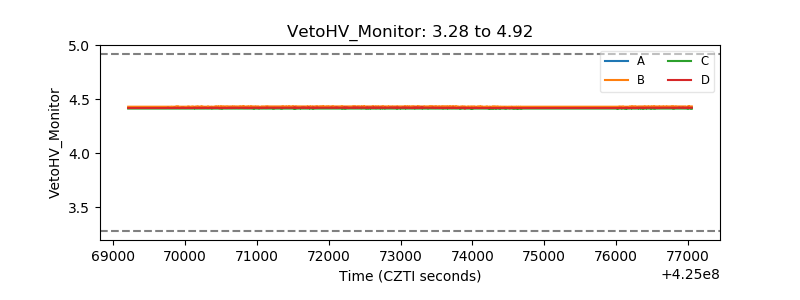 |
| Veto LLD | 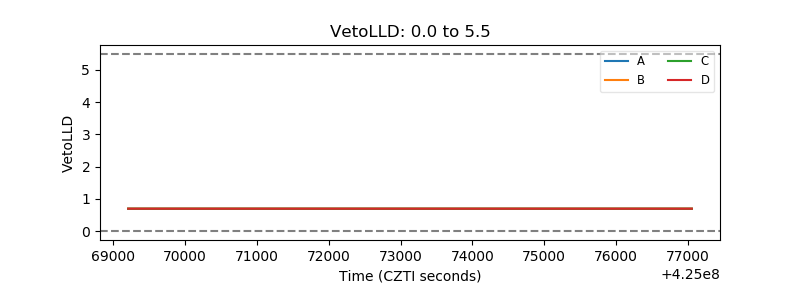 |
| Alpha Counter | 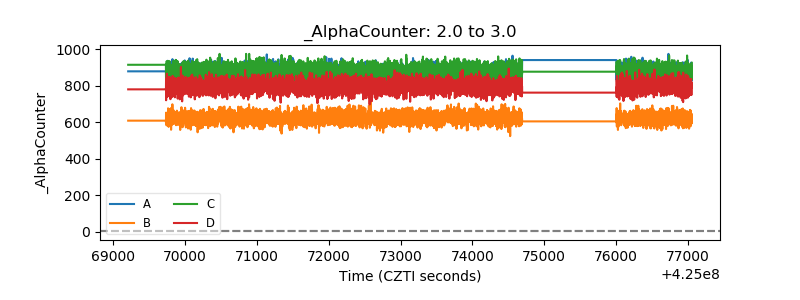 |
| _CPM_Rate | 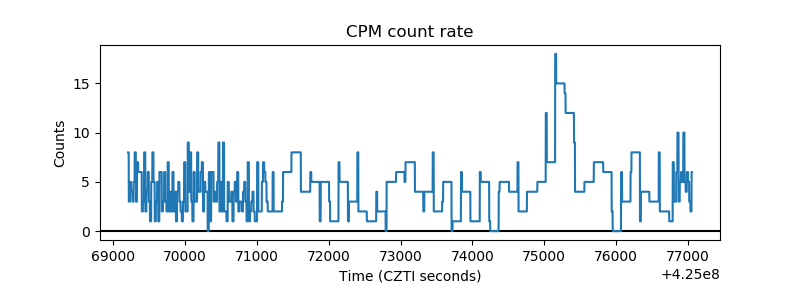 |
| CZT Counter |  |
| +2.5 Volts monitor |  |
| +5 Volts monitor |  |
| _ROLL_ROT | 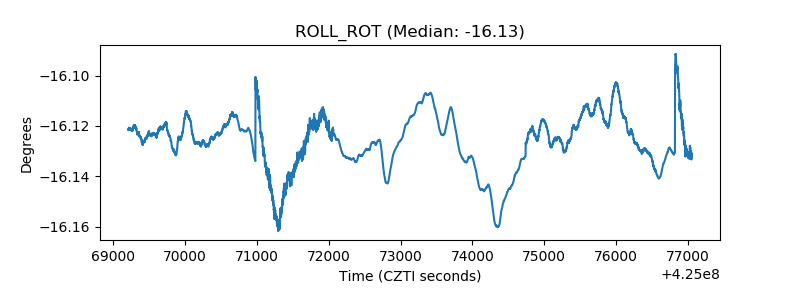 |
| _Roll_DEC | 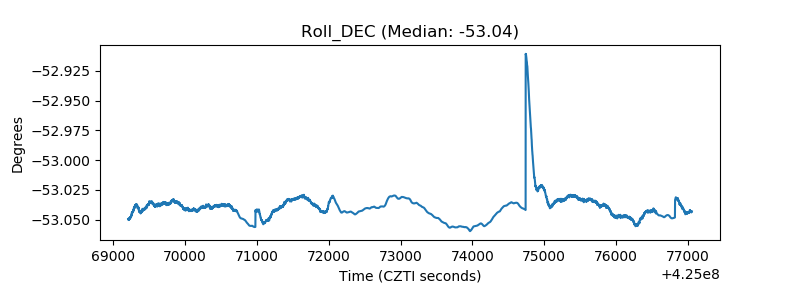 |
| _Roll_RA |  |
| Veto Counter | 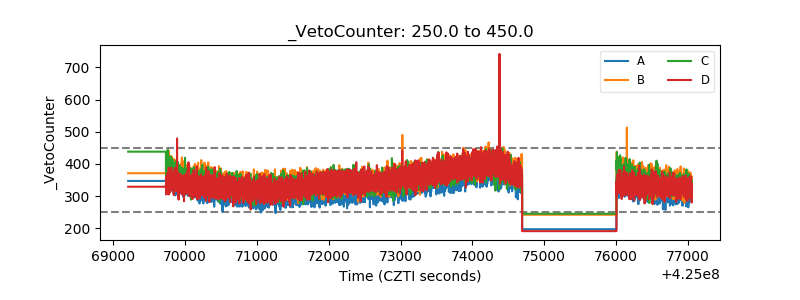 |