| Param | Original file | Final file |
|---|---|---|
| Filename | modeM0/AS1A12_052T04_9000005700_41802cztM0_level2.fits | modeM0/AS1A12_052T04_9000005700_41802cztM0_level2_quad_clean.evt |
| Size (bytes) | 148,417,920 | 38,508,480 |
| Size | 141.5 MB | 36.7 MB |
| Events in quadrant A | 1,509,464 | 258,394 |
| Events in quadrant B | 1,108,717 | 262,164 |
| Events in quadrant C | 1,441,024 | 240,761 |
| Events in quadrant D | 1,249,192 | 235,145 |
| Mode M9 | |||
|---|---|---|---|
| Quadrant | BADHDUFLAG | Total packets | Discarded packets |
| A | 0 | 13 | 0 |
| B | 0 | 13 | 0 |
| C | 0 | 13 | 0 |
| D | 0 | 13 | 0 |
| Mode SS | |||
|---|---|---|---|
| Quadrant | BADHDUFLAG | Total packets | Discarded packets |
| A | 0 | 50 | 0 |
| B | 0 | 50 | 0 |
| C | 0 | 50 | 0 |
| D | 0 | 50 | 0 |
| Mode M0 | |||
|---|---|---|---|
| Quadrant | BADHDUFLAG | Total packets | Discarded packets |
| A | 0 | 6027 | 1 |
| B | 0 | 4920 | 1 |
| C | 0 | 5736 | 1 |
| D | 0 | 5445 | 1 |
| Quadrant | Total seconds | Saturated seconds | Saturation percentage |
|---|---|---|---|
| A | 2353 | 19 | 0.807480% |
| B | 2353 | 8 | 0.339992% |
| C | 2353 | 117 | 4.972376% |
| D | 2353 | 29 | 1.232469% |
Noise dominated data is calculated using 1-second bins in cleaned event files. If a bin has >2000 counts, and if more than 50% of those come from <1% of pixels, then it is considered to be noise-dominated and hence unusable.
| Quadrant | # 1 sec bins | Bins with >0 counts | Bins with >2000 counts | High rate bins dominated by noise | Noise dominated (total time) | Noise dominated (detector-on time) | Marked lightcurve |
|---|---|---|---|---|---|---|---|
| A | 3666 | 2354 | 14 | 14 | 0.38% | 0.59% | 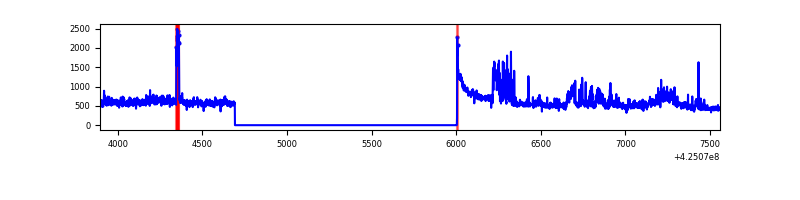 |
| B | 3666 | 2353 | 4 | 4 | 0.11% | 0.17% | 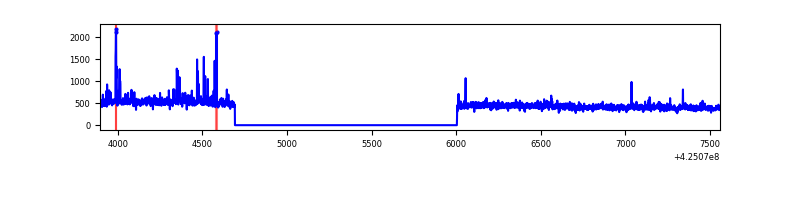 |
| C | 3666 | 2353 | 113 | 113 | 3.08% | 4.80% | 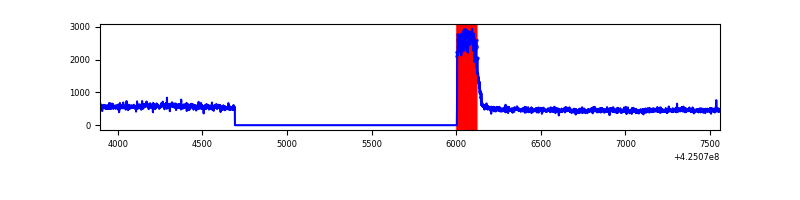 |
| D | 3666 | 2353 | 29 | 29 | 0.79% | 1.23% | 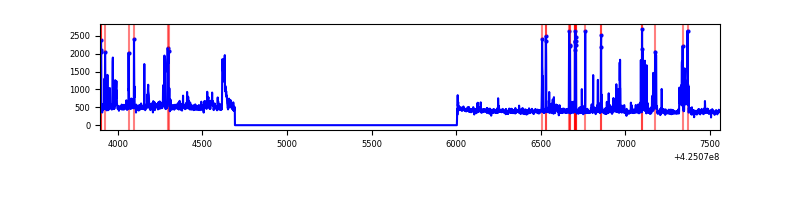 |
Top three noisy pixels from each quadrant. If the there are fewer than three noisy pixels in the level2.evt file, extra rows are filled as -1
| Pixel properties | Quadrant properties | ||||||
|---|---|---|---|---|---|---|---|
| Quadrant | DetID | PixID | Counts | Sigma | Mean | Median | Sigma |
| A | 10 | 83 | 256888 | 4677.8 | 260 | 254 | 54.9 |
| A | 15 | 223 | 194657 | 3543.48 | 260 | 254 | 54.9 |
| A | 12 | 189 | 28226 | 509.85 | 260 | 254 | 54.9 |
| B | 15 | 35 | 20645 | 387.99 | 260 | 254 | 52.6 |
| B | 0 | 186 | 14013 | 261.8 | 260 | 254 | 52.6 |
| B | 5 | 255 | 12650 | 235.87 | 260 | 254 | 52.6 |
| C | 0 | 10 | 386070 | 6434.23 | 246 | 246 | 60.0 |
| C | 15 | 214 | 94033 | 1564.04 | 246 | 246 | 60.0 |
| C | 13 | 61 | 1622 | 22.94 | 246 | 246 | 60.0 |
| D | 13 | 249 | 104050 | 1618.17 | 252 | 244 | 64.2 |
| D | 10 | 199 | 63649 | 988.38 | 252 | 244 | 64.2 |
| D | 2 | 249 | 48801 | 756.93 | 252 | 244 | 64.2 |
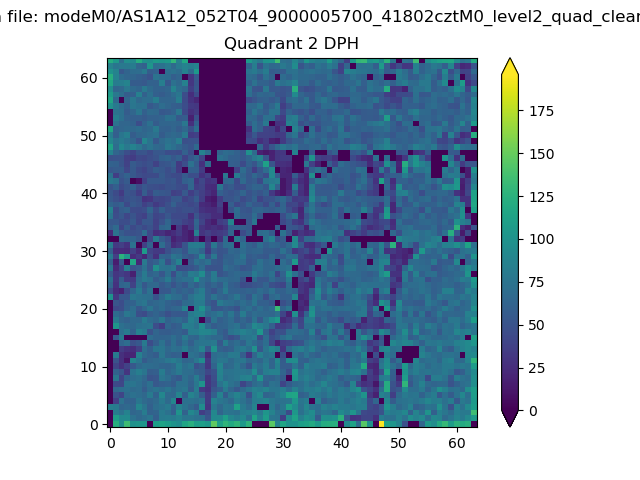
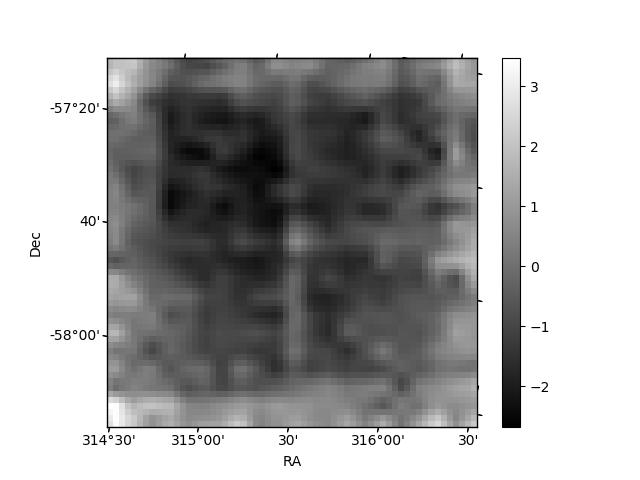
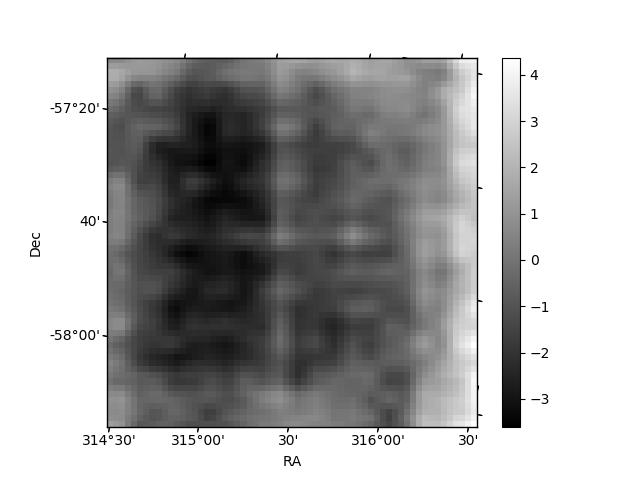
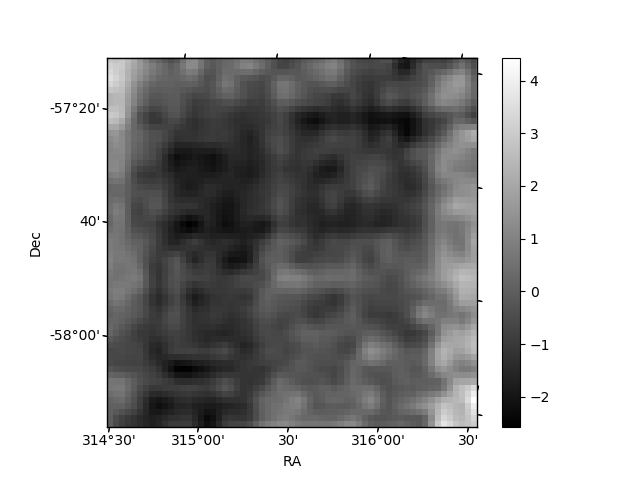
Histogram calculated using DETX and DETY for each event in the final _common_clean file
| Quadrant A | 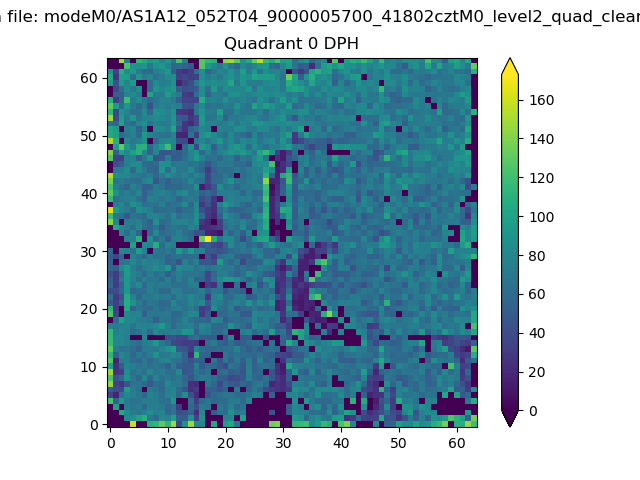 |
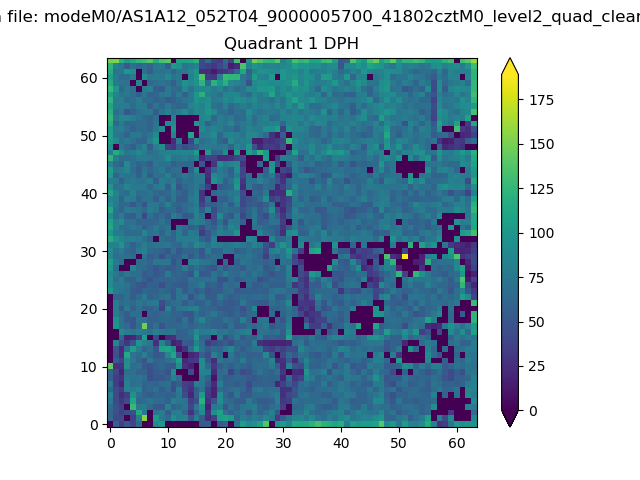 |
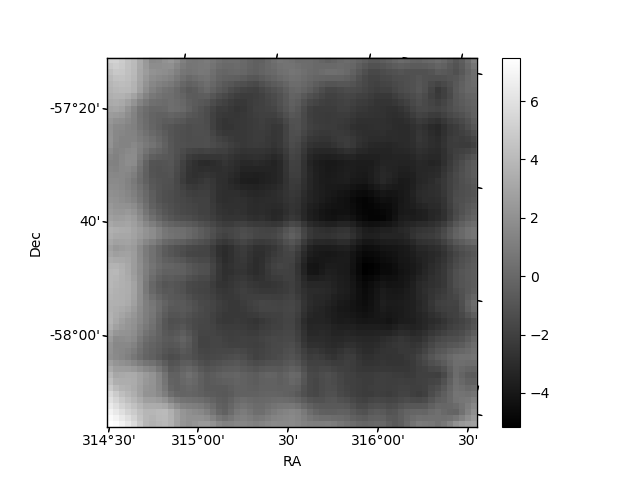
Quadrant B |
|---|---|---|---|
| Quadrant D | 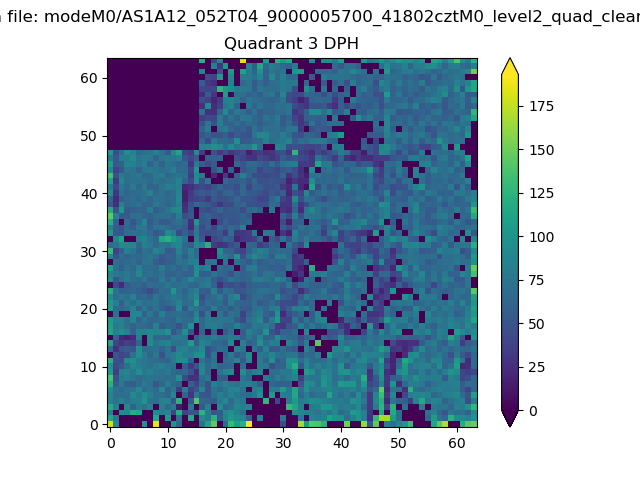 |
 |
Quadrant C |
| Plot type | Count rate plots | Images |
|---|---|---|
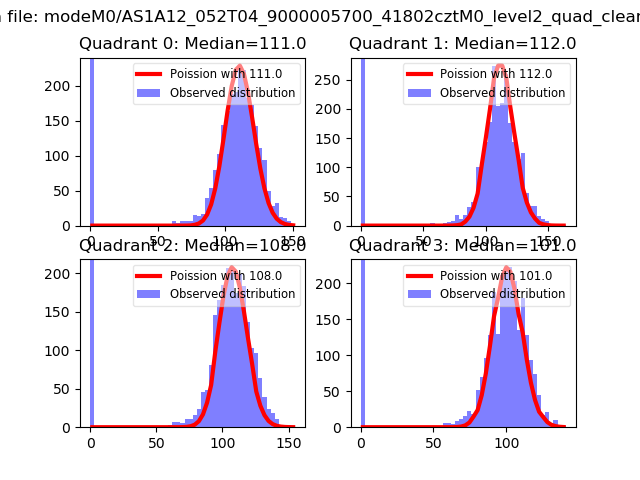
| Comparison with Poisson distribution Blue bars denote a histogram of data divided into 1 sec bins. Red curve is a Poisson curve with rate = median count rate of data. |
 |
 |
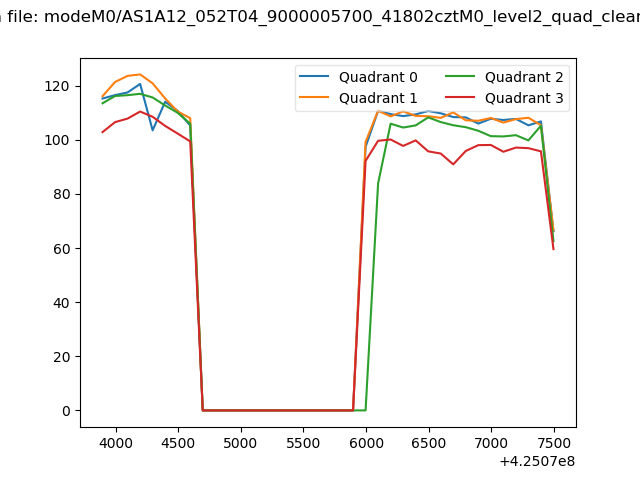
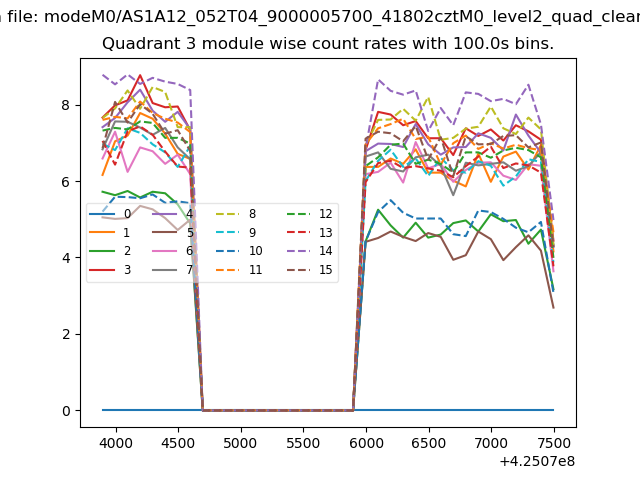
| Quadrant-wise count rates Data is divided into 100 sec bins |
 |
|
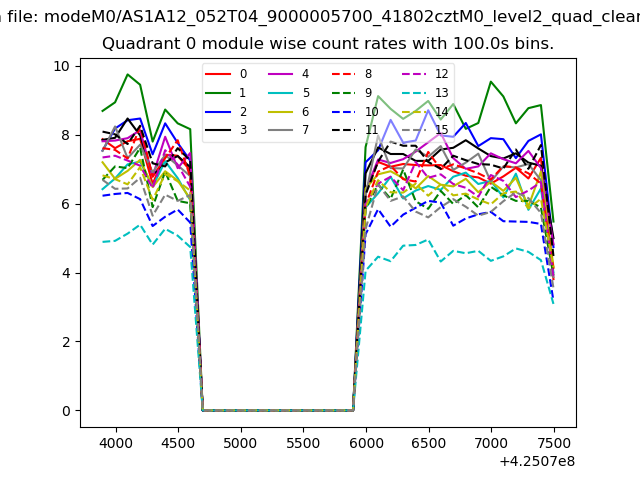
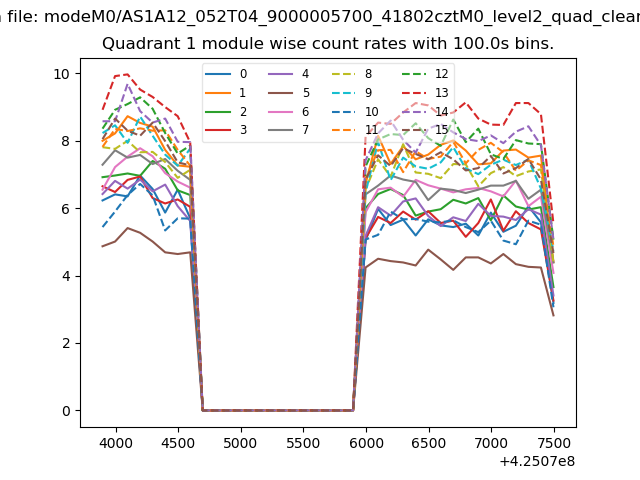
| Module-wise count rates for Quadrant A Data is divided into 100 sec bins |
 |
 |
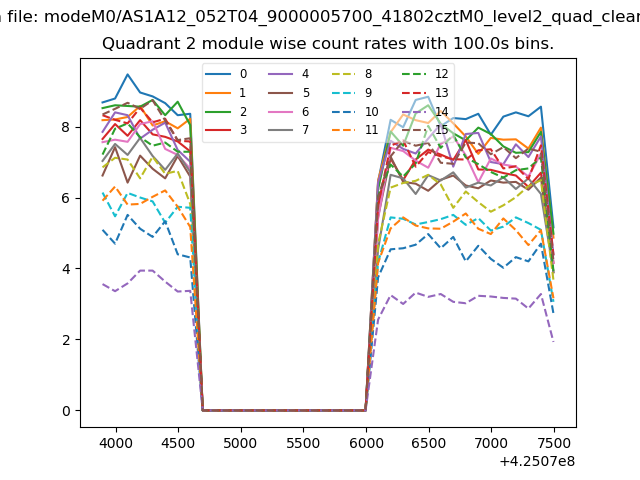
| Module-wise count rates for Quadrant B Data is divided into 100 sec bins |
 |
 |
| Module-wise count rates for Quadrant C Data is divided into 100 sec bins |
 |
 |
| Module-wise count rates for Quadrant D Data is divided into 100 sec bins |
 |
 |
| Parameter | Plot |
|---|---|
| CZT HV Monitor |  |
| D_VDD | 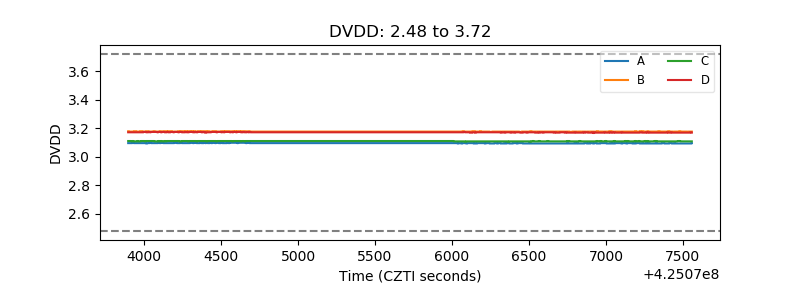 |
| Temperature 1 | 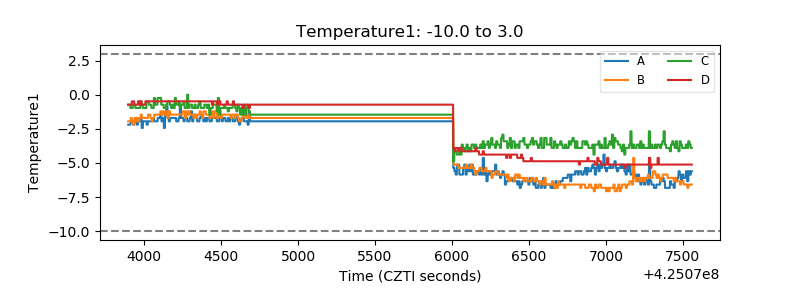 |
| Veto HV Monitor | 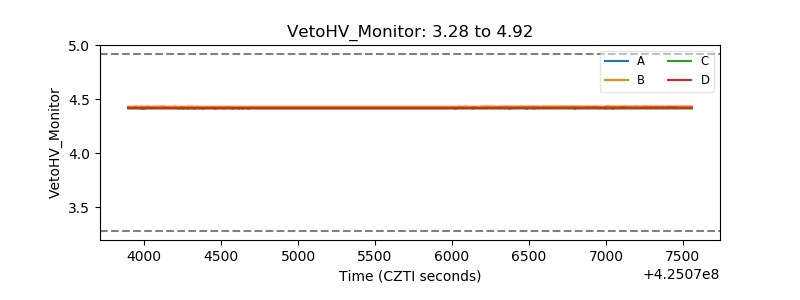 |
| Veto LLD | 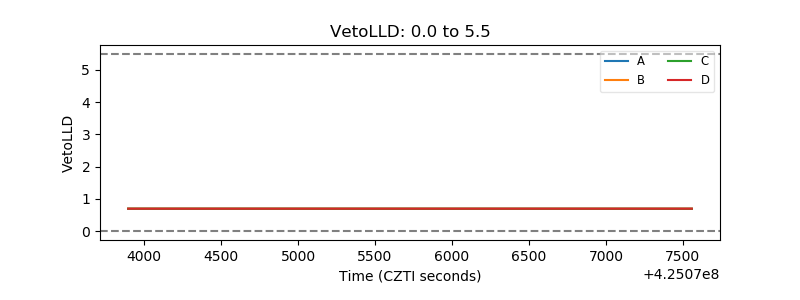 |
| Alpha Counter | 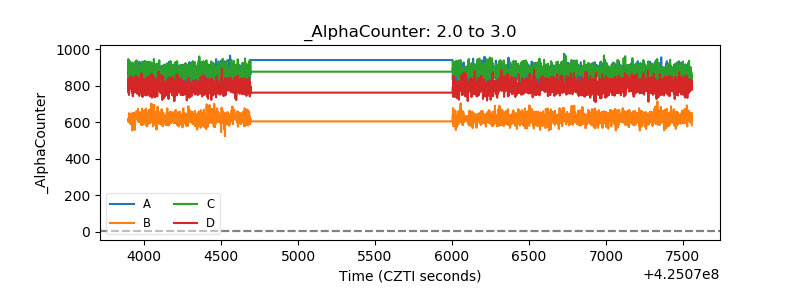 |
| _CPM_Rate | 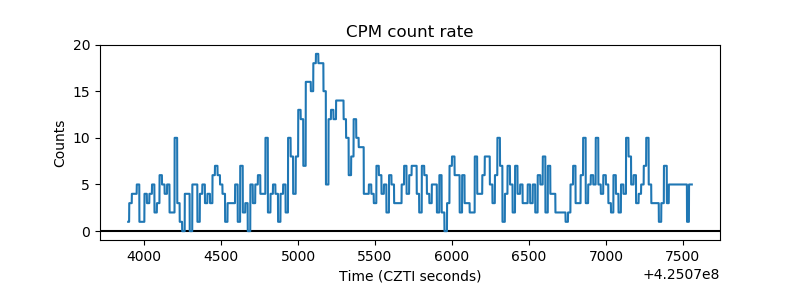 |
| CZT Counter | 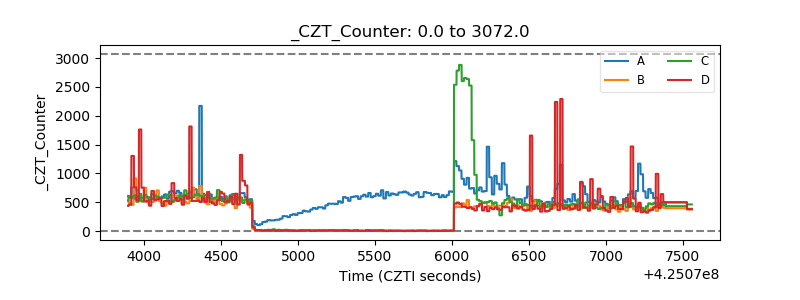 |
| +2.5 Volts monitor | 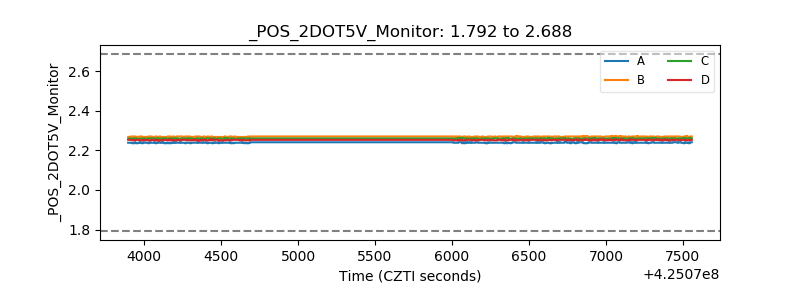 |
| +5 Volts monitor | 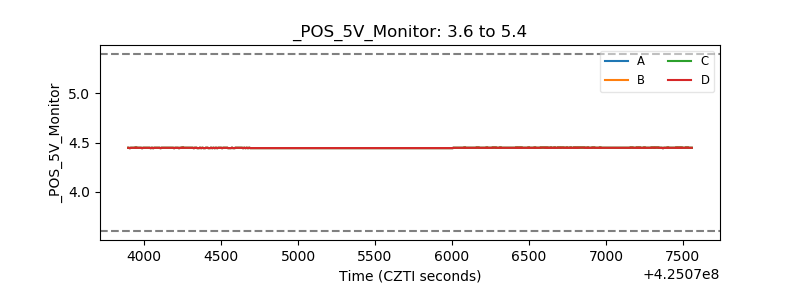 |
| _ROLL_ROT | 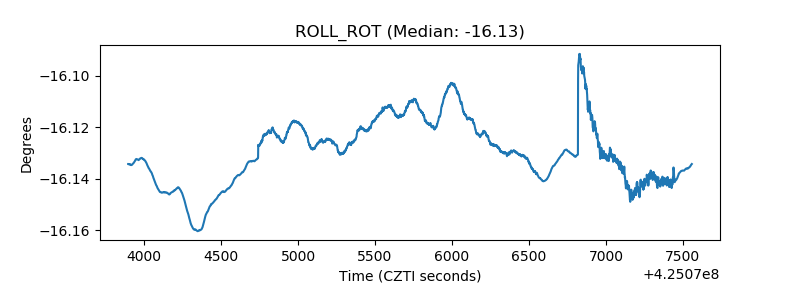 |
| _Roll_DEC | 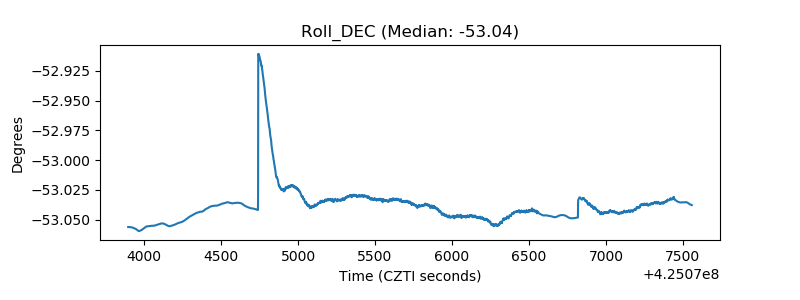 |
| _Roll_RA |  |
| Veto Counter | 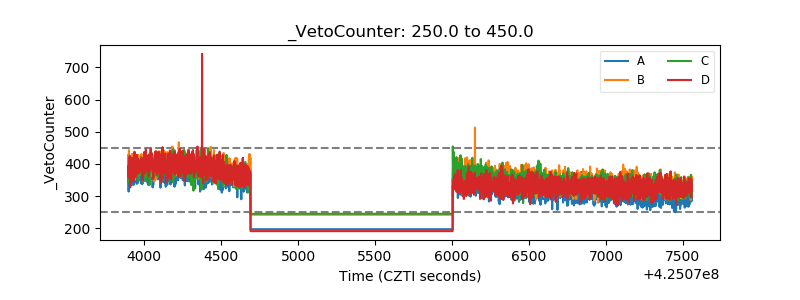 |