| Param | Original file | Final file |
|---|---|---|
| Filename | modeM0/AS1A12_087T01_9000005702_41802cztM0_level2.fits | modeM0/AS1A12_087T01_9000005702_41802cztM0_level2_quad_clean.evt |
| Size (bytes) | 598,904,640 | 167,181,120 |
| Size | 571.2 MB | 159.4 MB |
| Events in quadrant A | 5,817,924 | 1,120,126 |
| Events in quadrant B | 4,577,515 | 1,146,663 |
| Events in quadrant C | 5,561,864 | 1,065,252 |
| Events in quadrant D | 5,405,892 | 1,010,501 |
| Mode M0 | |||
|---|---|---|---|
| Quadrant | BADHDUFLAG | Total packets | Discarded packets |
| A | 0 | 24068 | 3 |
| B | 0 | 21089 | 2 |
| C | 0 | 22779 | 3 |
| D | 0 | 23523 | 2 |
| Mode SS | |||
|---|---|---|---|
| Quadrant | BADHDUFLAG | Total packets | Discarded packets |
| A | 0 | 212 | 0 |
| B | 0 | 212 | 0 |
| C | 0 | 212 | 0 |
| D | 0 | 212 | 0 |
| Mode M9 | |||
|---|---|---|---|
| Quadrant | BADHDUFLAG | Total packets | Discarded packets |
| A | 0 | 27 | 0 |
| B | 0 | 27 | 0 |
| C | 0 | 27 | 0 |
| D | 0 | 27 | 0 |
| Quadrant | Total seconds | Saturated seconds | Saturation percentage |
|---|---|---|---|
| A | 10386 | 38 | 0.365877% |
| B | 10386 | 13 | 0.125168% |
| C | 10385 | 256 | 2.465094% |
| D | 10386 | 129 | 1.242057% |
Noise dominated data is calculated using 1-second bins in cleaned event files. If a bin has >2000 counts, and if more than 50% of those come from <1% of pixels, then it is considered to be noise-dominated and hence unusable.
| Quadrant | # 1 sec bins | Bins with >0 counts | Bins with >2000 counts | High rate bins dominated by noise | Noise dominated (total time) | Noise dominated (detector-on time) | Marked lightcurve |
|---|---|---|---|---|---|---|---|
| A | 13130 | 10388 | 5 | 5 | 0.04% | 0.05% | 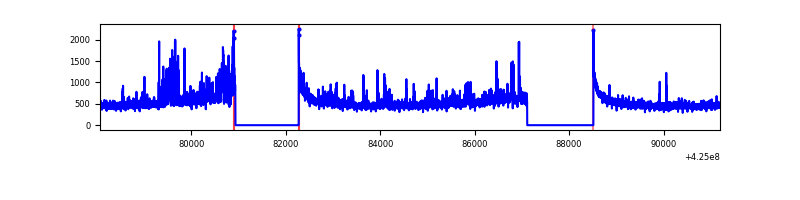 |
| B | 13130 | 10386 | 0 | 0 | 0.00% | 0.00% | 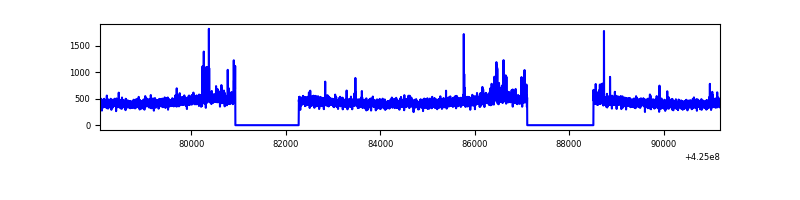 |
| C | 13130 | 10386 | 255 | 255 | 1.94% | 2.46% | 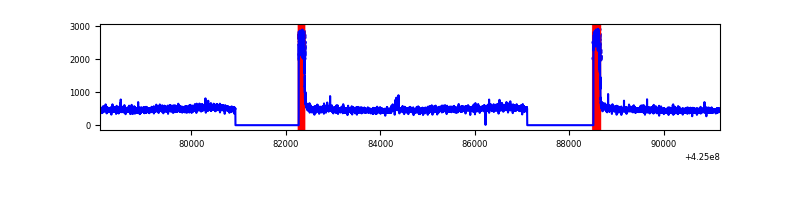 |
| D | 13130 | 10386 | 113 | 113 | 0.86% | 1.09% | 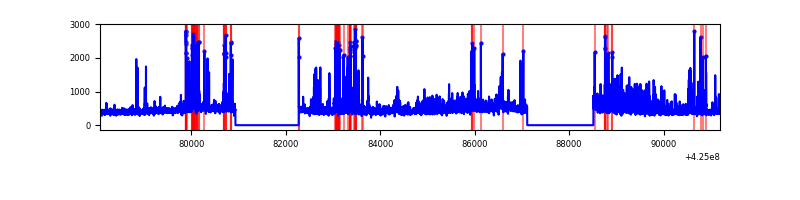 |
Top three noisy pixels from each quadrant. If the there are fewer than three noisy pixels in the level2.evt file, extra rows are filled as -1
| Pixel properties | Quadrant properties | ||||||
|---|---|---|---|---|---|---|---|
| Quadrant | DetID | PixID | Counts | Sigma | Mean | Median | Sigma |
| A | 10 | 83 | 841918 | 3600.0 | 1135 | 1111 | 233.6 |
| A | 2 | 79 | 404998 | 1729.28 | 1135 | 1111 | 233.6 |
| A | 12 | 189 | 154981 | 658.81 | 1135 | 1111 | 233.6 |
| B | 0 | 183 | 44409 | 199.87 | 1123 | 1088 | 216.7 |
| B | 0 | 186 | 42189 | 189.63 | 1123 | 1088 | 216.7 |
| B | 12 | 111 | 28120 | 124.72 | 1123 | 1088 | 216.7 |
| C | 0 | 10 | 863600 | 3385.58 | 1097 | 1102 | 254.8 |
| C | 15 | 214 | 405589 | 1587.74 | 1097 | 1102 | 254.8 |
| C | 12 | 249 | 10647 | 37.47 | 1097 | 1102 | 254.8 |
| D | 12 | 79 | 510406 | 1865.19 | 1115 | 1084 | 273.1 |
| D | 13 | 249 | 371146 | 1355.21 | 1115 | 1084 | 273.1 |
| D | 12 | 6 | 130713 | 474.72 | 1115 | 1084 | 273.1 |
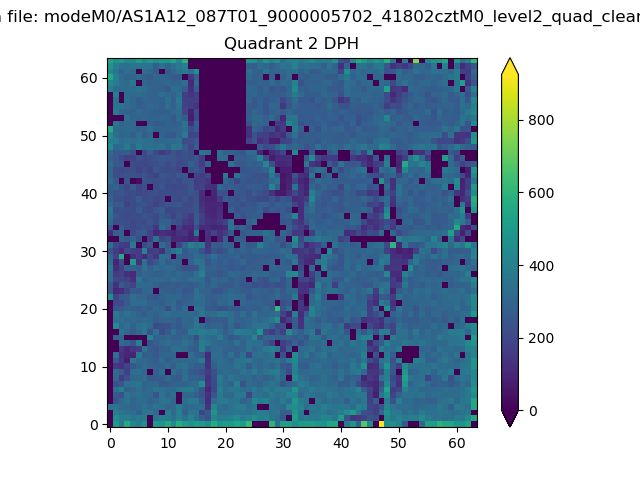
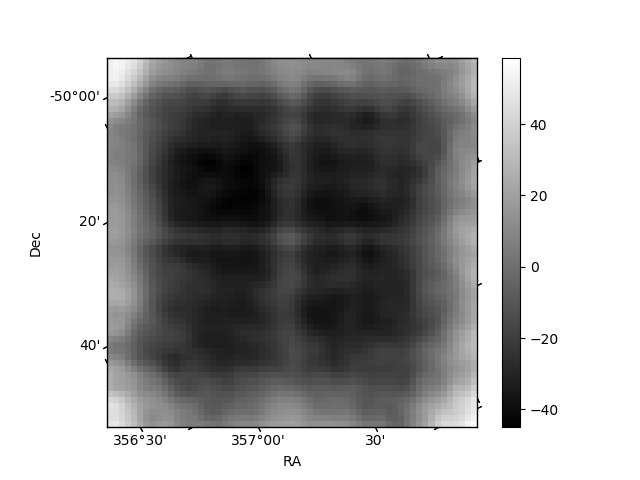
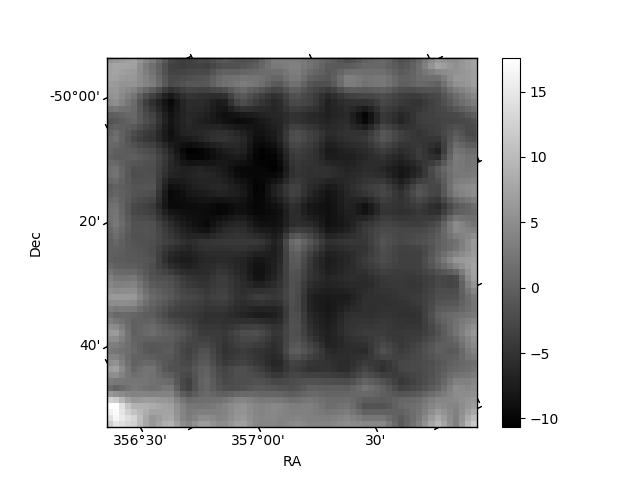
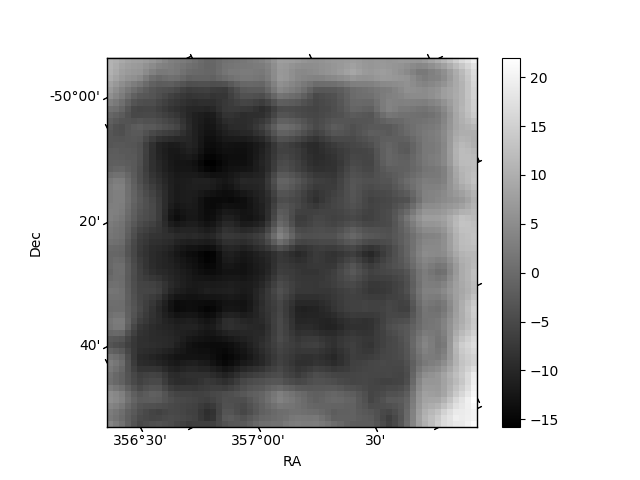
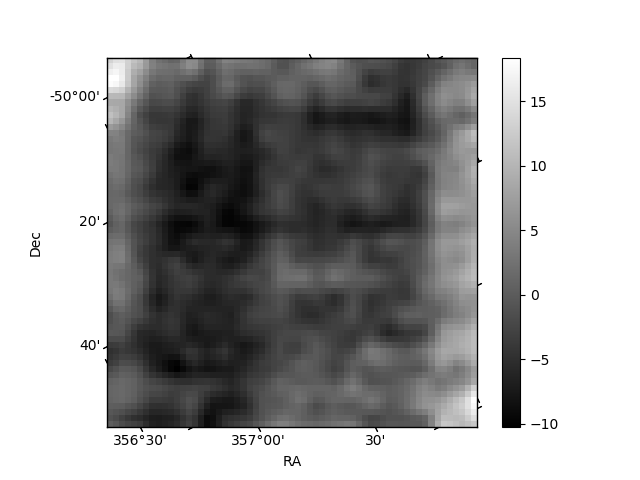
Histogram calculated using DETX and DETY for each event in the final _common_clean file
| Quadrant A | 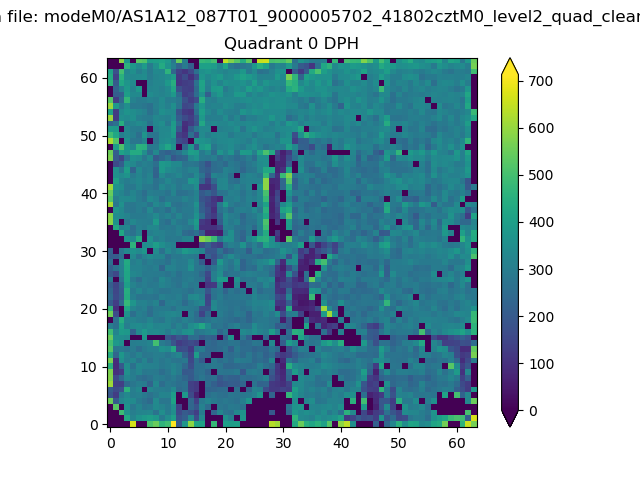 |
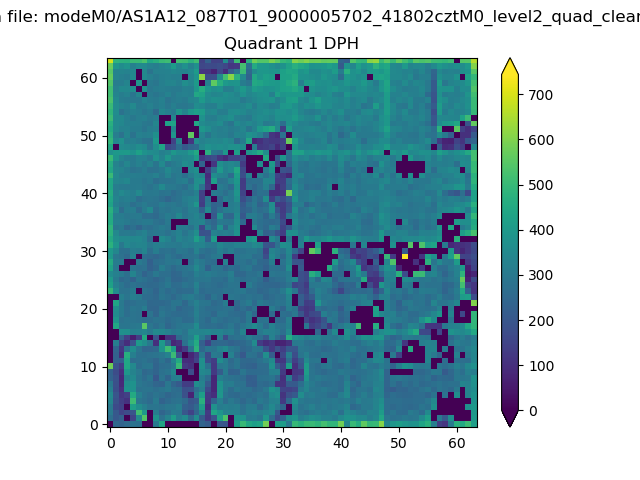 |
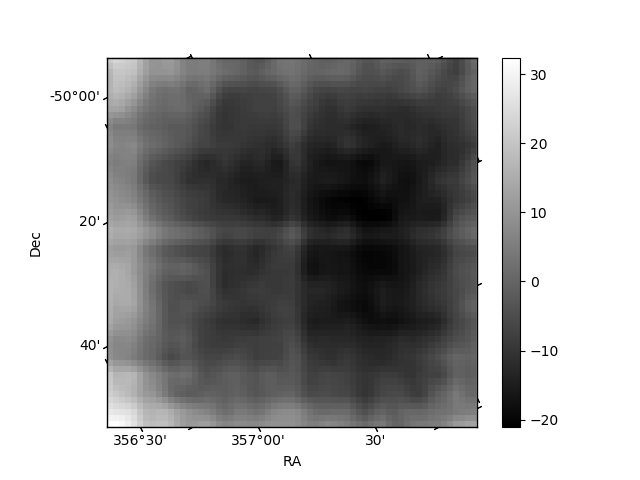
Quadrant B |
|---|---|---|---|
| Quadrant D | 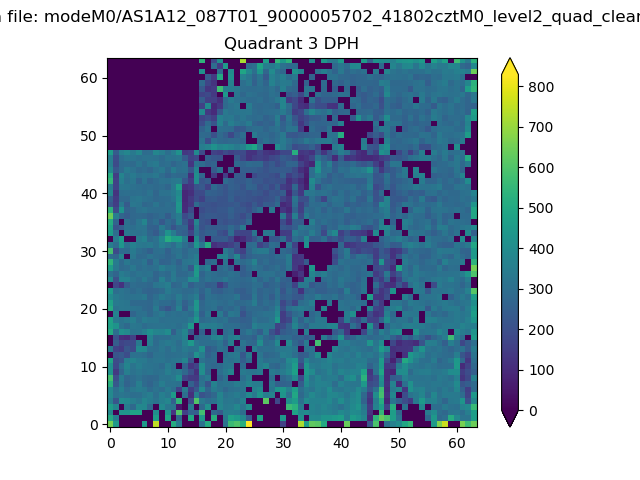 |
 |
Quadrant C |
| Plot type | Count rate plots | Images |
|---|---|---|
| Comparison with Poisson distribution Blue bars denote a histogram of data divided into 1 sec bins. Red curve is a Poisson curve with rate = median count rate of data. |
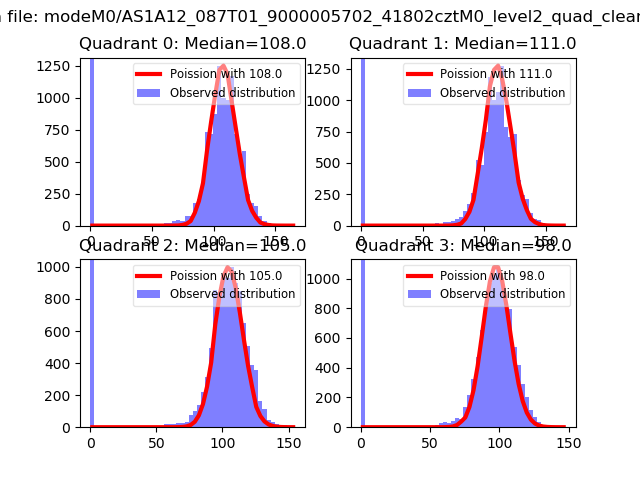 |
 |
| Quadrant-wise count rates Data is divided into 100 sec bins |
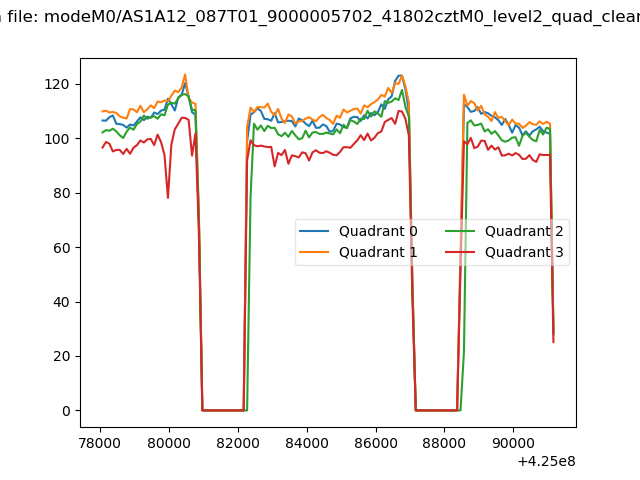 |
|
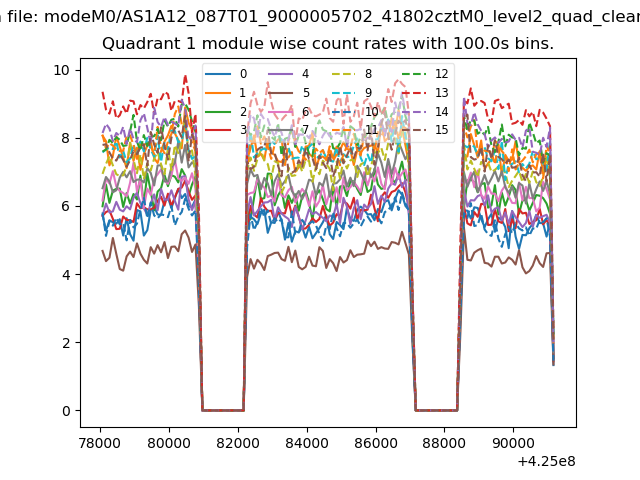
| Module-wise count rates for Quadrant A Data is divided into 100 sec bins |
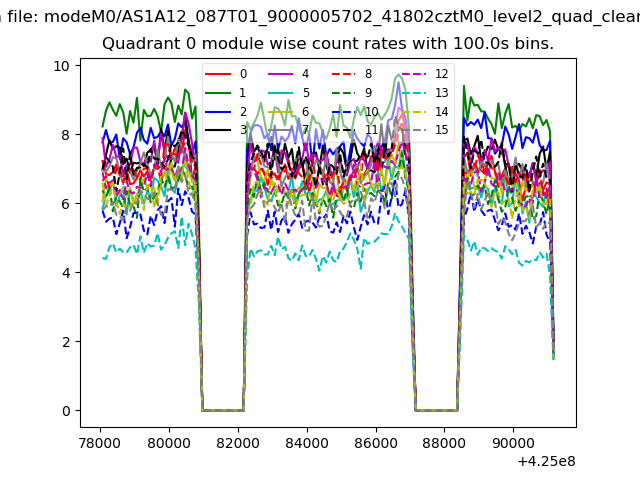 |
 |
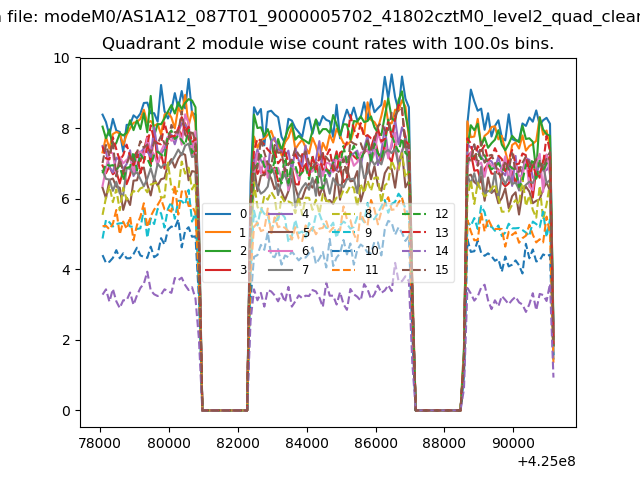
| Module-wise count rates for Quadrant B Data is divided into 100 sec bins |
 |
 |
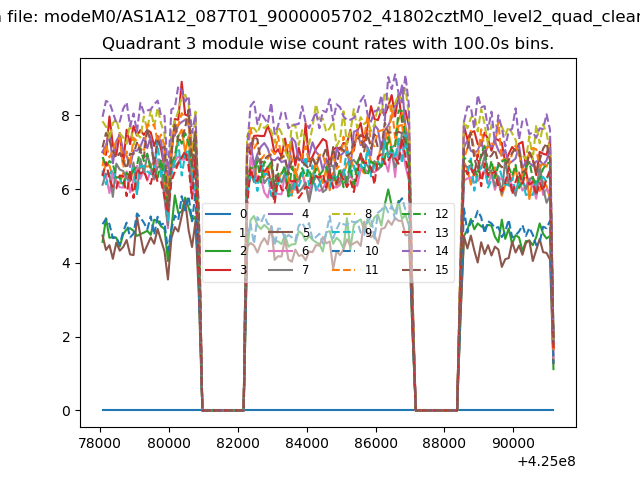
| Module-wise count rates for Quadrant C Data is divided into 100 sec bins |
 |
 |
| Module-wise count rates for Quadrant D Data is divided into 100 sec bins |
 |
 |
| Parameter | Plot |
|---|---|
| CZT HV Monitor | 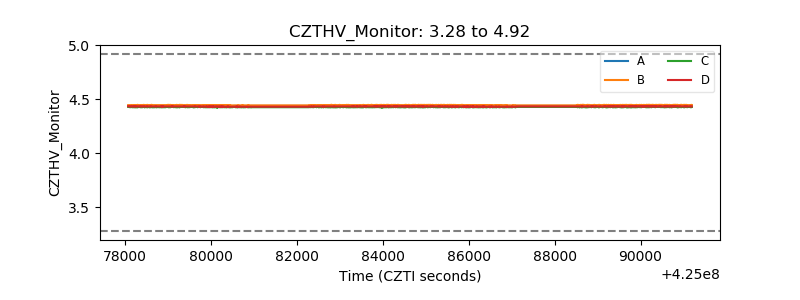 |
| D_VDD | 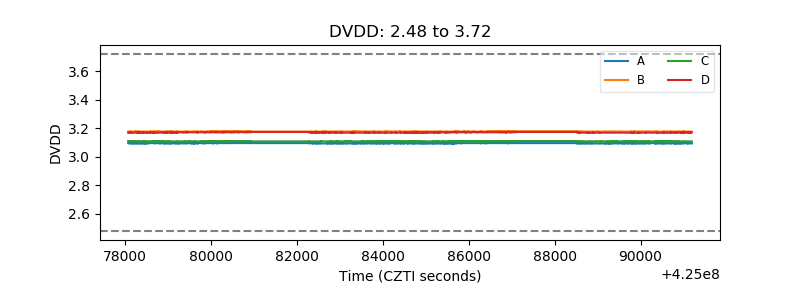 |
| Temperature 1 | 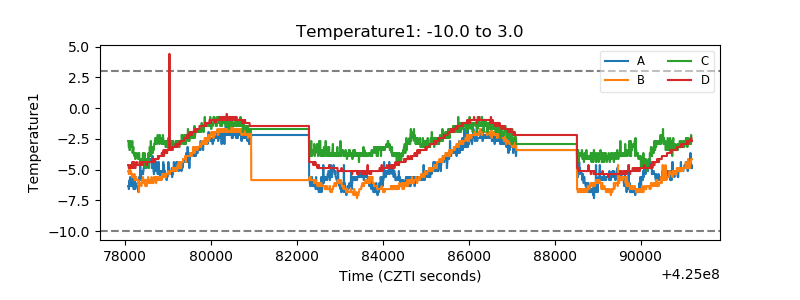 |
| Veto HV Monitor | 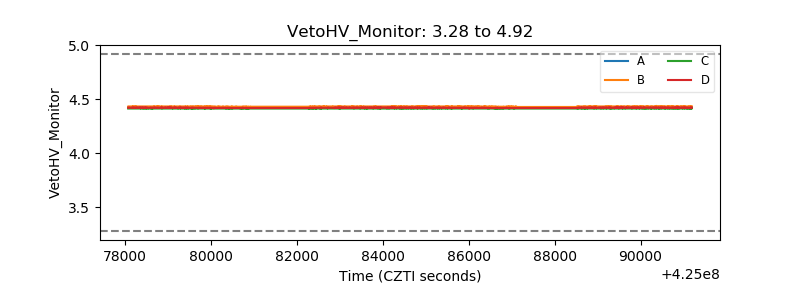 |
| Veto LLD | 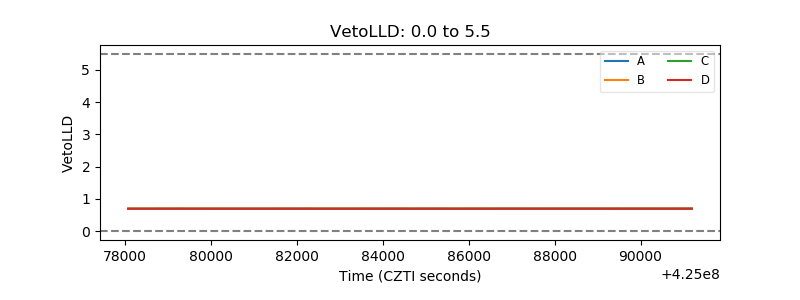 |
| Alpha Counter | 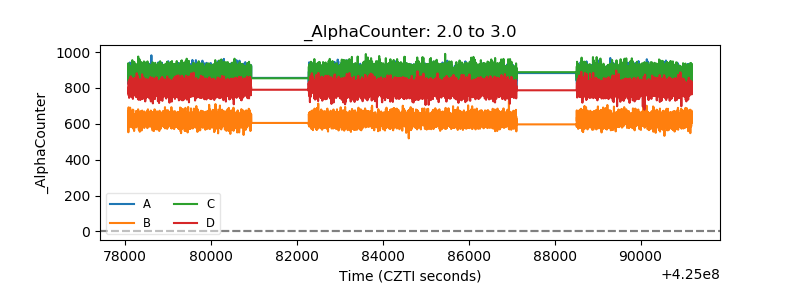 |
| _CPM_Rate | 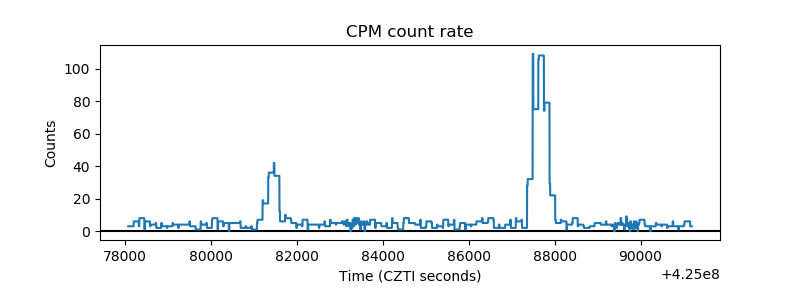 |
| CZT Counter | 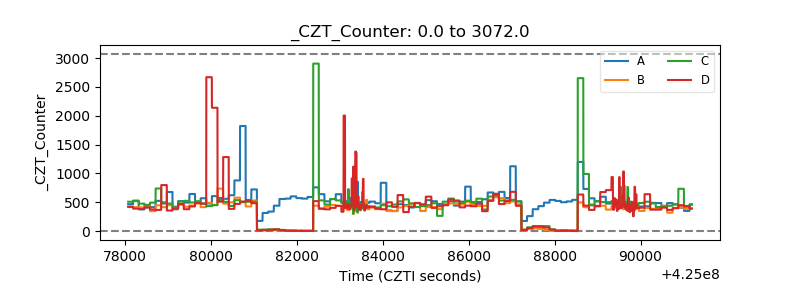 |
| +2.5 Volts monitor | 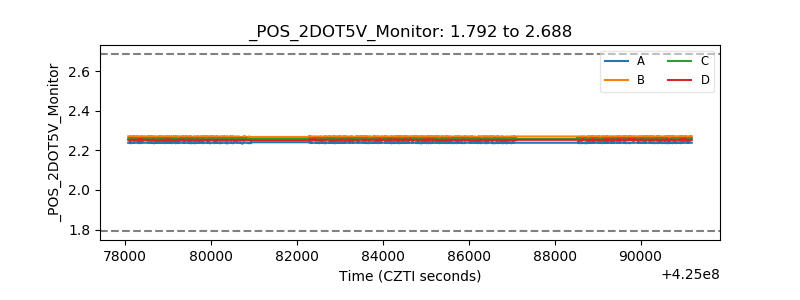 |
| +5 Volts monitor | 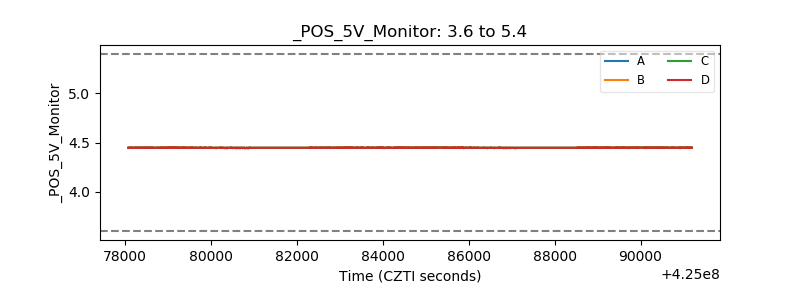 |
| _ROLL_ROT | 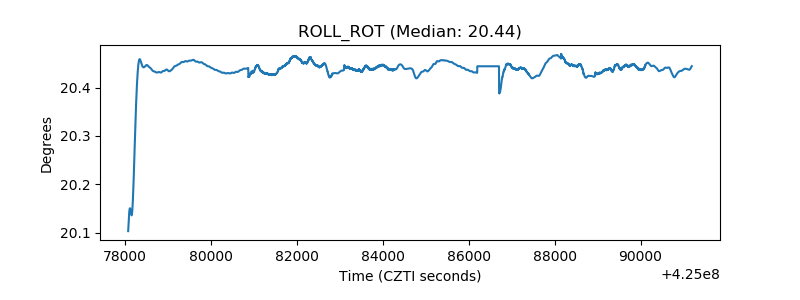 |
| _Roll_DEC | 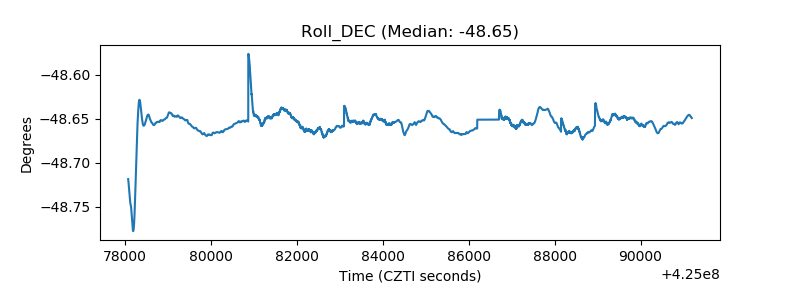 |
| _Roll_RA | 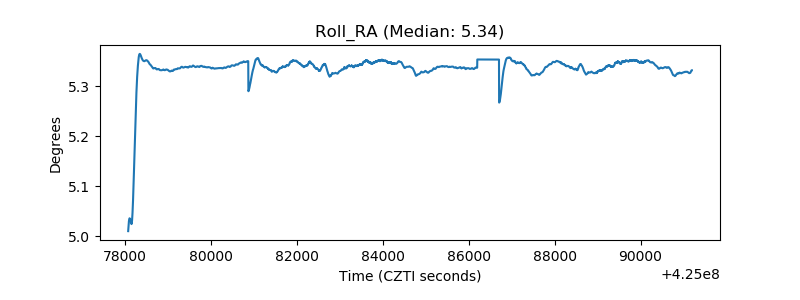 |
| Veto Counter | 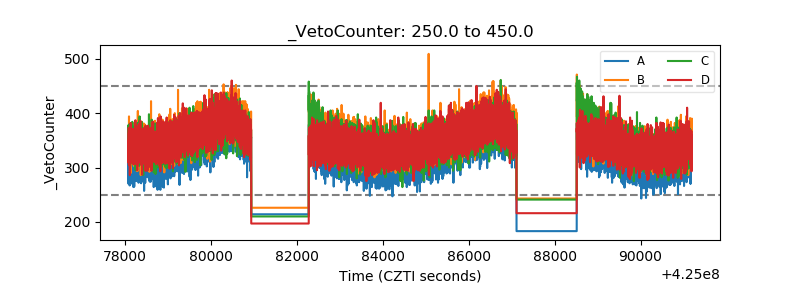 |