| Param | Original file | Final file |
|---|---|---|
| Filename | modeM0/AS1A12_087T01_9000005702_41803cztM0_level2.fits | modeM0/AS1A12_087T01_9000005702_41803cztM0_level2_quad_clean.evt |
| Size (bytes) | 469,566,720 | 128,039,040 |
| Size | 447.8 MB | 122.1 MB |
| Events in quadrant A | 4,195,537 | 857,325 |
| Events in quadrant B | 3,540,001 | 874,918 |
| Events in quadrant C | 4,389,463 | 818,189 |
| Events in quadrant D | 4,649,859 | 783,411 |
| Mode M0 | |||
|---|---|---|---|
| Quadrant | BADHDUFLAG | Total packets | Discarded packets |
| A | 0 | 17118 | 2 |
| B | 0 | 15920 | 2 |
| C | 0 | 17722 | 2 |
| D | 0 | 19236 | 2 |
| Mode SS | |||
|---|---|---|---|
| Quadrant | BADHDUFLAG | Total packets | Discarded packets |
| A | 0 | 160 | 0 |
| B | 0 | 160 | 0 |
| C | 0 | 160 | 0 |
| D | 0 | 160 | 0 |
| Mode M9 | |||
|---|---|---|---|
| Quadrant | BADHDUFLAG | Total packets | Discarded packets |
| A | 0 | 32 | 0 |
| B | 0 | 32 | 0 |
| C | 0 | 32 | 0 |
| D | 0 | 32 | 0 |
| Quadrant | Total seconds | Saturated seconds | Saturation percentage |
|---|---|---|---|
| A | 7810 | 32 | 0.409731% |
| B | 7810 | 18 | 0.230474% |
| C | 7810 | 246 | 3.149808% |
| D | 7810 | 44 | 0.563380% |
Noise dominated data is calculated using 1-second bins in cleaned event files. If a bin has >2000 counts, and if more than 50% of those come from <1% of pixels, then it is considered to be noise-dominated and hence unusable.
| Quadrant | # 1 sec bins | Bins with >0 counts | Bins with >2000 counts | High rate bins dominated by noise | Noise dominated (total time) | Noise dominated (detector-on time) | Marked lightcurve |
|---|---|---|---|---|---|---|---|
| A | 11003 | 7812 | 13 | 13 | 0.12% | 0.17% | 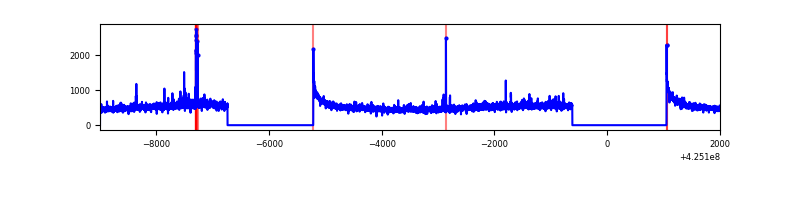 |
| B | 11003 | 7810 | 2 | 2 | 0.02% | 0.03% | 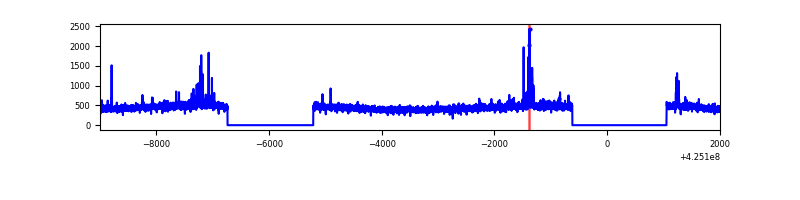 |
| C | 11003 | 7810 | 239 | 239 | 2.17% | 3.06% | 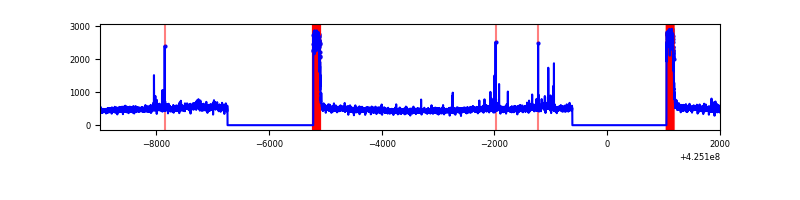 |
| D | 11003 | 7810 | 36 | 36 | 0.33% | 0.46% | 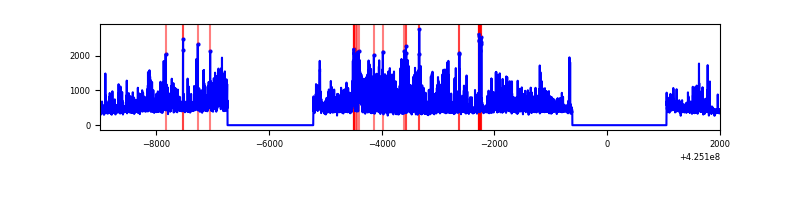 |
Top three noisy pixels from each quadrant. If the there are fewer than three noisy pixels in the level2.evt file, extra rows are filled as -1
| Pixel properties | Quadrant properties | ||||||
|---|---|---|---|---|---|---|---|
| Quadrant | DetID | PixID | Counts | Sigma | Mean | Median | Sigma |
| A | 10 | 83 | 709982 | 3953.64 | 873 | 853 | 179.4 |
| A | 12 | 189 | 60330 | 331.6 | 873 | 853 | 179.4 |
| A | 2 | 79 | 41379 | 225.95 | 873 | 853 | 179.4 |
| B | 0 | 186 | 67628 | 393.39 | 864 | 837 | 169.8 |
| B | 0 | 183 | 48514 | 280.81 | 864 | 837 | 169.8 |
| B | 12 | 111 | 21345 | 120.79 | 864 | 837 | 169.8 |
| C | 0 | 10 | 768533 | 3934.09 | 834 | 837 | 195.1 |
| C | 15 | 214 | 311976 | 1594.44 | 834 | 837 | 195.1 |
| C | 15 | 159 | 34827 | 174.18 | 834 | 837 | 195.1 |
| D | 12 | 79 | 1167065 | 5544.92 | 858 | 833 | 210.3 |
| D | 13 | 249 | 144584 | 683.47 | 858 | 833 | 210.3 |
| D | 2 | 234 | 37193 | 172.88 | 858 | 833 | 210.3 |
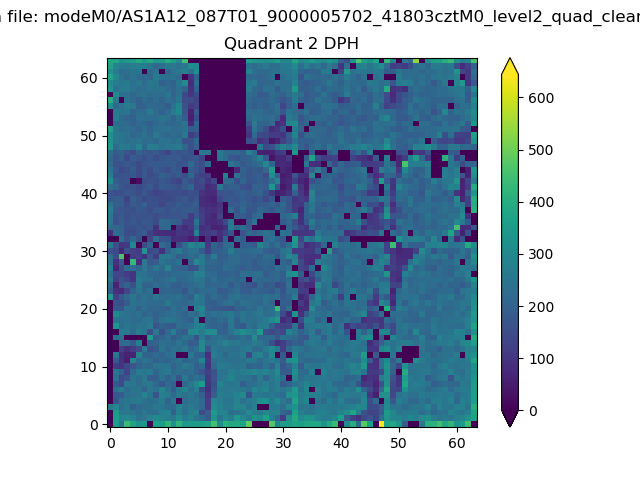
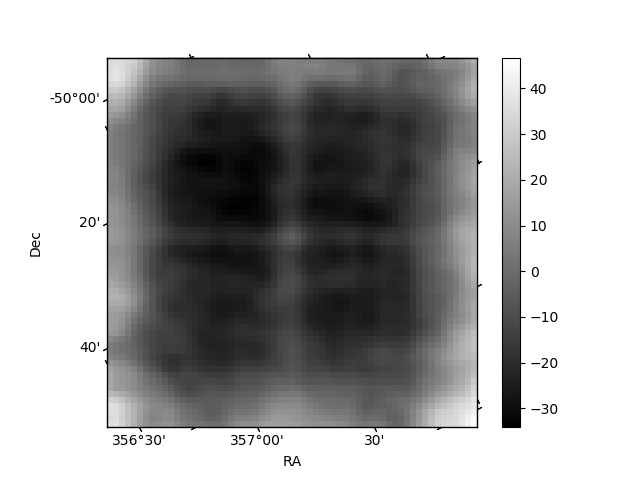
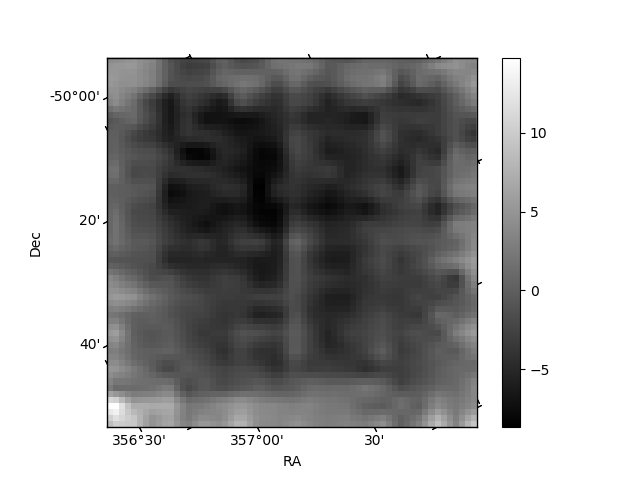
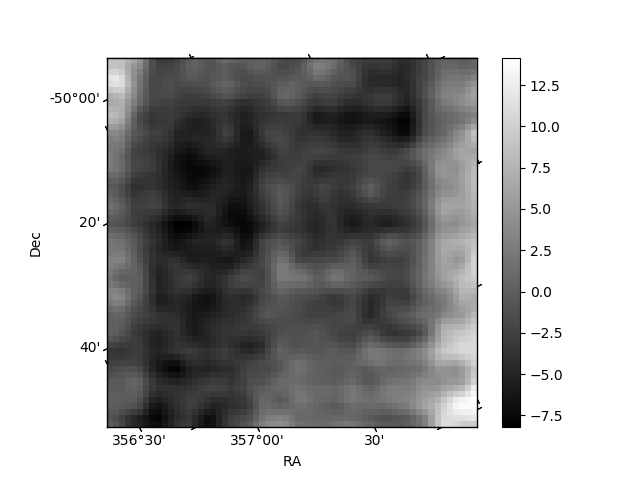
Histogram calculated using DETX and DETY for each event in the final _common_clean file
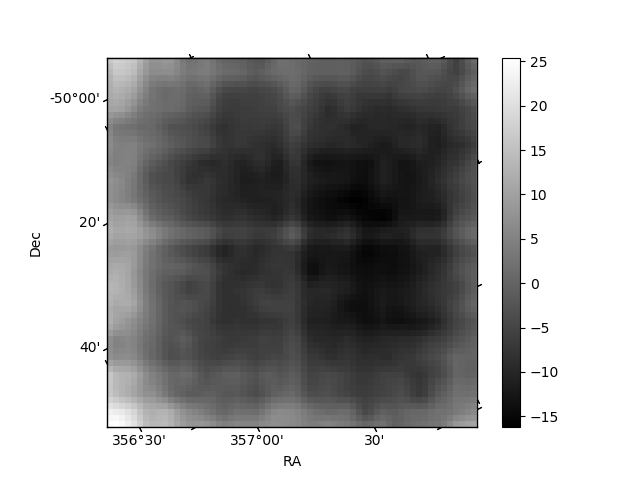
| Quadrant A | 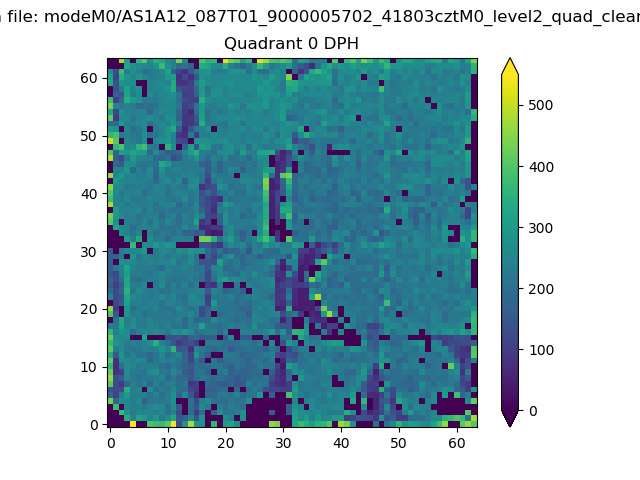 |
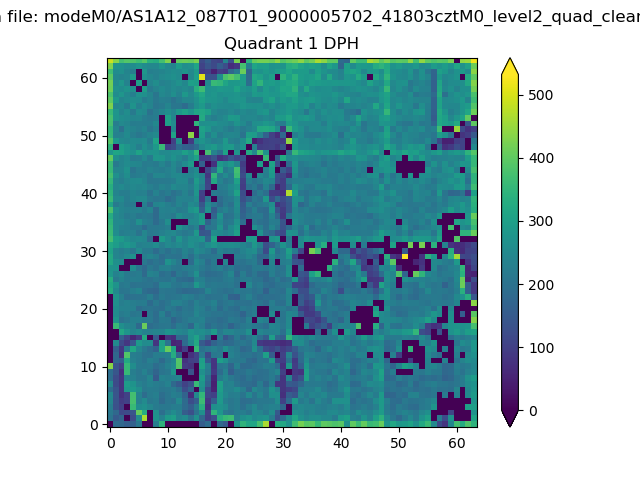 |
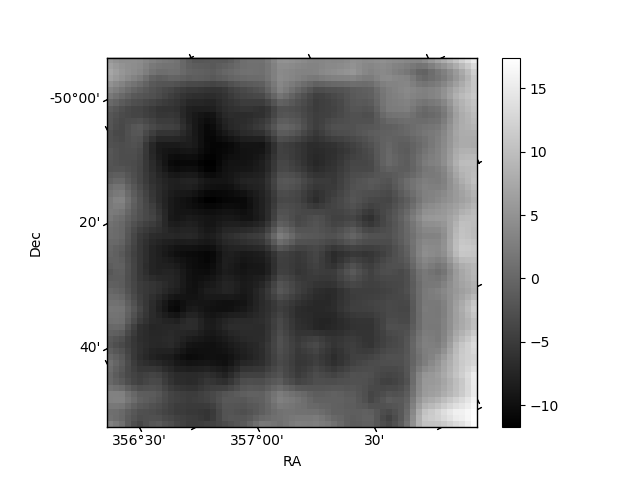
Quadrant B |
|---|---|---|---|
| Quadrant D | 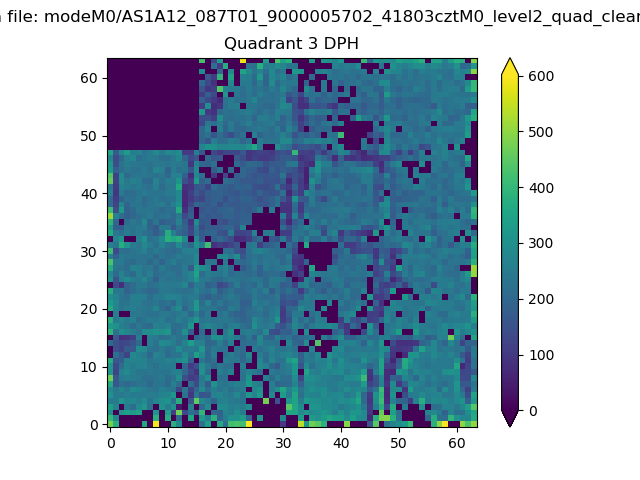 |
 |
Quadrant C |
| Plot type | Count rate plots | Images |
|---|---|---|
| Comparison with Poisson distribution Blue bars denote a histogram of data divided into 1 sec bins. Red curve is a Poisson curve with rate = median count rate of data. |
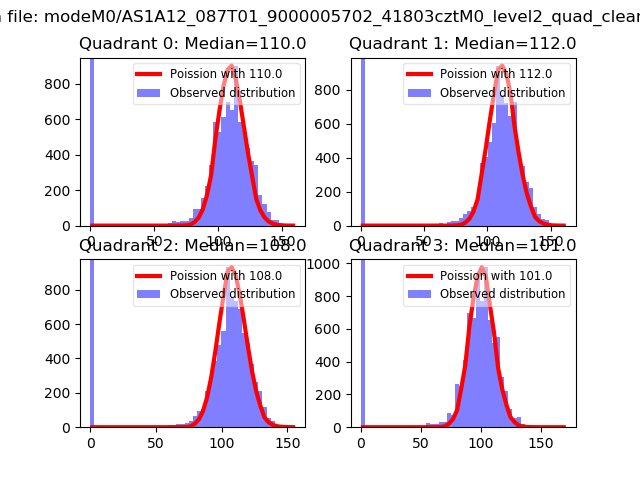 |
 |
| Quadrant-wise count rates Data is divided into 100 sec bins |
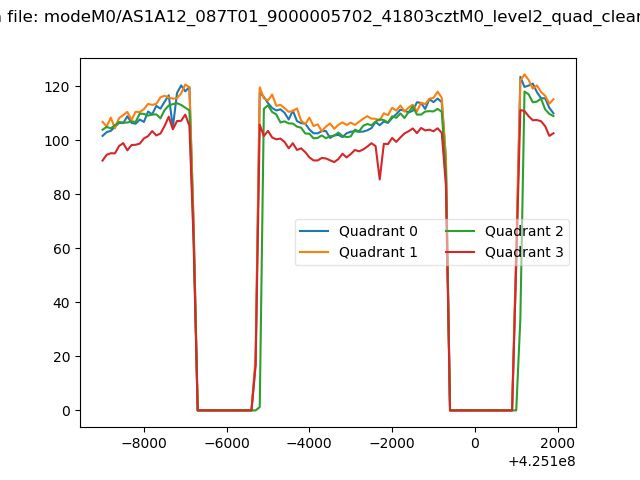 |
|
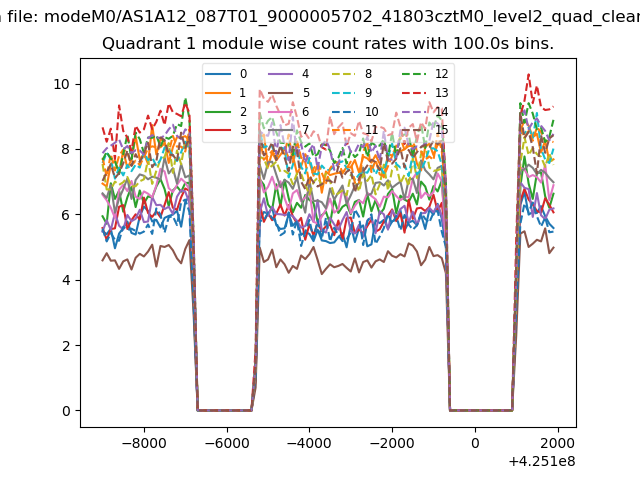
| Module-wise count rates for Quadrant A Data is divided into 100 sec bins |
 |
 |
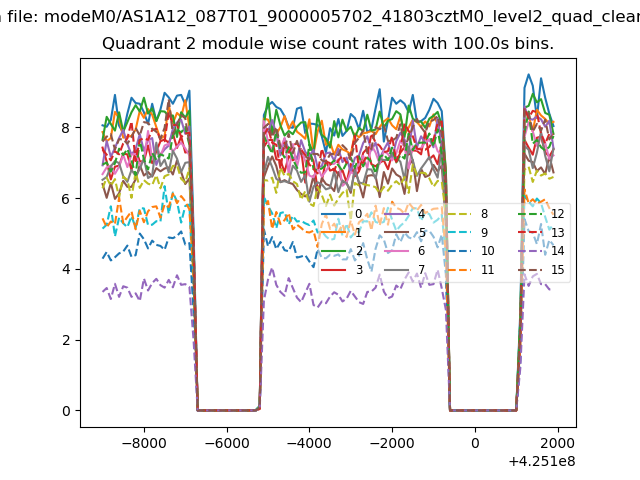
| Module-wise count rates for Quadrant B Data is divided into 100 sec bins |
 |
 |
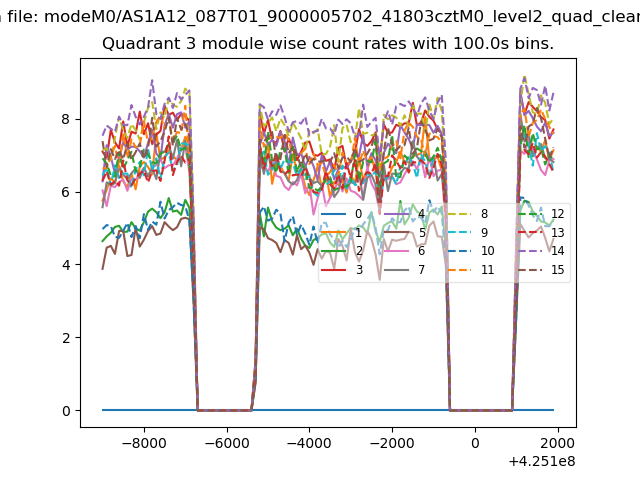
| Module-wise count rates for Quadrant C Data is divided into 100 sec bins |
 |
 |
| Module-wise count rates for Quadrant D Data is divided into 100 sec bins |
 |
 |
| Parameter | Plot |
|---|---|
| CZT HV Monitor | 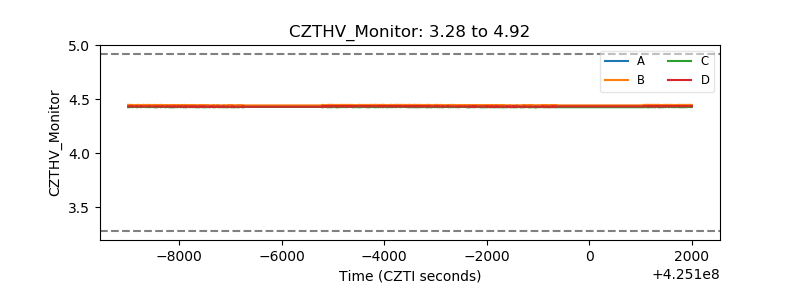 |
| D_VDD | 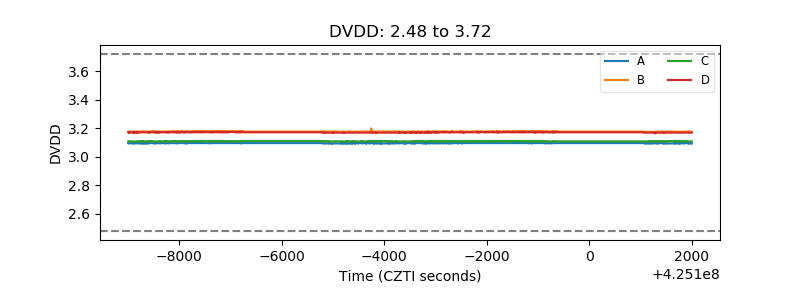 |
| Temperature 1 | 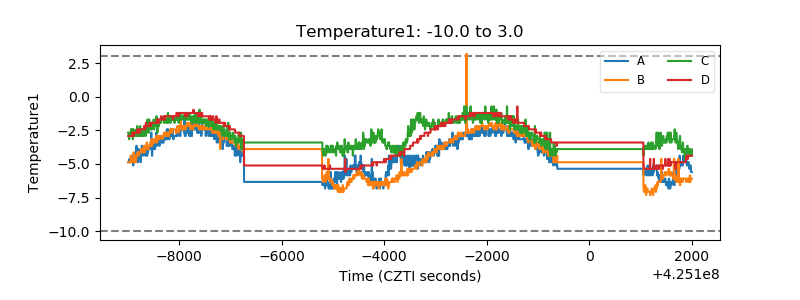 |
| Veto HV Monitor | 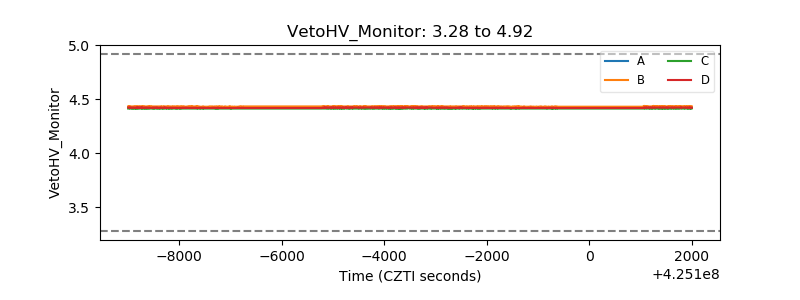 |
| Veto LLD | 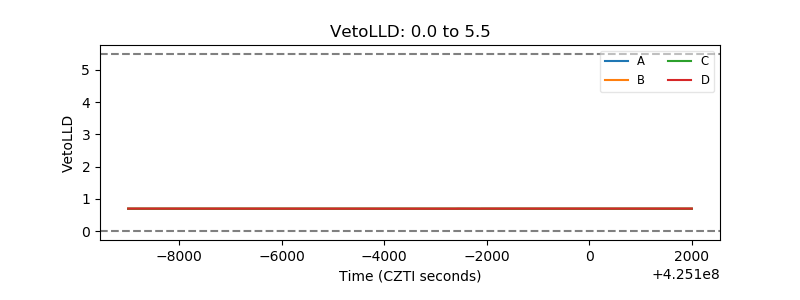 |
| Alpha Counter | 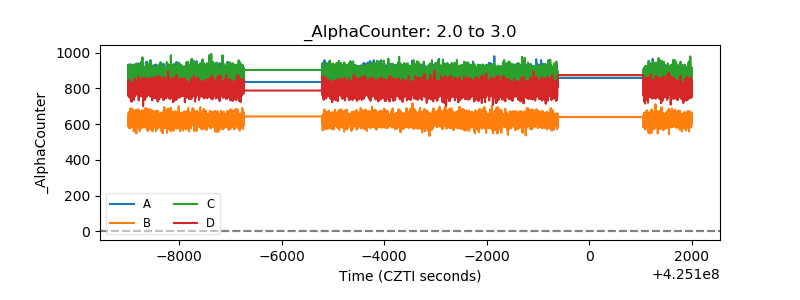 |
| _CPM_Rate | 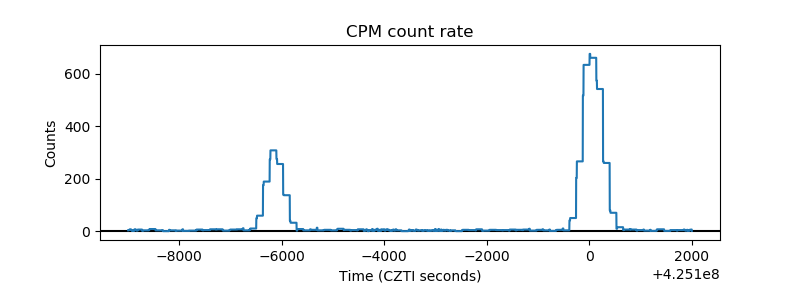 |
| CZT Counter | 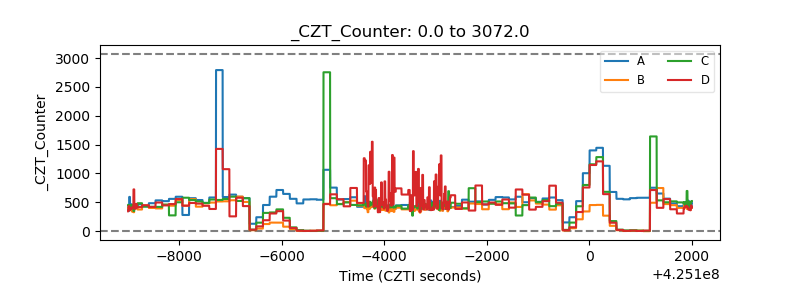 |
| +2.5 Volts monitor |  |
| +5 Volts monitor | 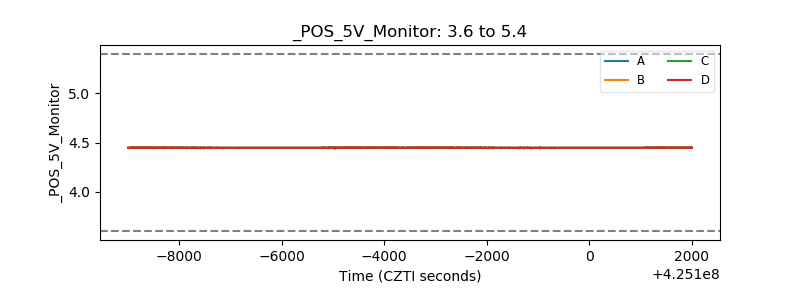 |
| _ROLL_ROT | 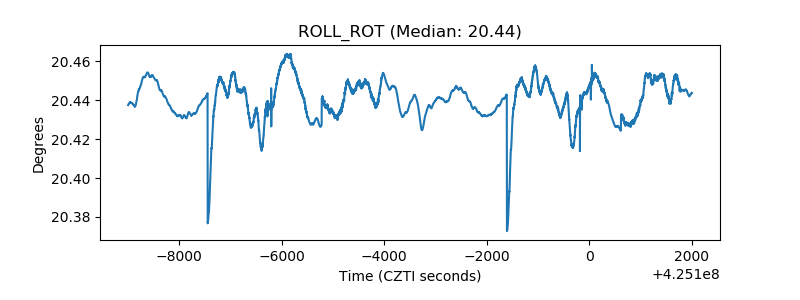 |
| _Roll_DEC | 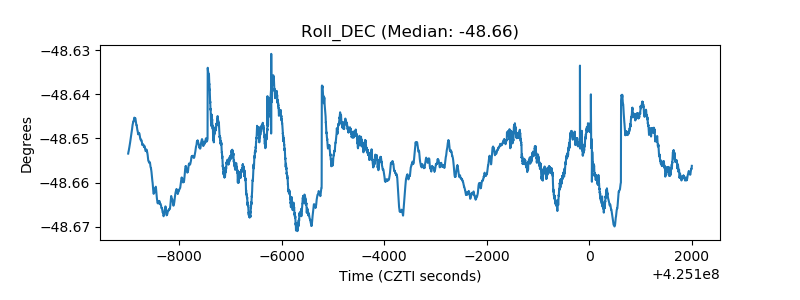 |
| _Roll_RA | 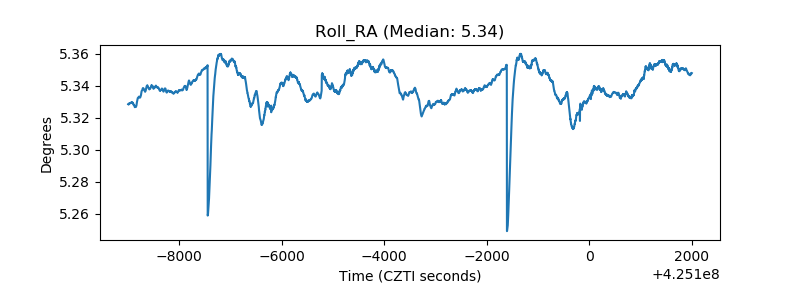 |
| Veto Counter | 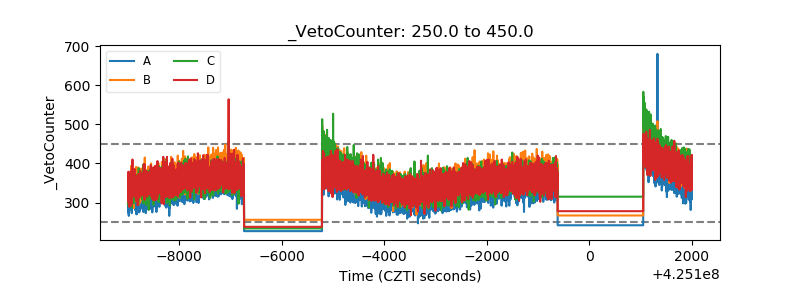 |