| Param | Original file | Final file |
|---|---|---|
| Filename | modeM0/AS1A12_087T01_9000005702_41805cztM0_level2.fits | modeM0/AS1A12_087T01_9000005702_41805cztM0_level2_quad_clean.evt |
| Size (bytes) | 315,527,040 | 89,853,120 |
| Size | 300.9 MB | 85.7 MB |
| Events in quadrant A | 3,020,103 | 604,598 |
| Events in quadrant B | 2,370,710 | 619,089 |
| Events in quadrant C | 3,290,518 | 568,993 |
| Events in quadrant D | 2,581,074 | 553,792 |
| Mode M0 | |||
|---|---|---|---|
| Quadrant | BADHDUFLAG | Total packets | Discarded packets |
| A | 0 | 12149 | 2 |
| B | 0 | 10767 | 2 |
| C | 0 | 12936 | 2 |
| D | 0 | 11491 | 2 |
| Mode SS | |||
|---|---|---|---|
| Quadrant | BADHDUFLAG | Total packets | Discarded packets |
| A | 0 | 108 | 0 |
| B | 0 | 108 | 0 |
| C | 0 | 108 | 0 |
| D | 0 | 108 | 0 |
| Mode M9 | |||
|---|---|---|---|
| Quadrant | BADHDUFLAG | Total packets | Discarded packets |
| A | 0 | 24 | 0 |
| B | 0 | 25 | 0 |
| C | 0 | 25 | 0 |
| D | 0 | 25 | 0 |
| Quadrant | Total seconds | Saturated seconds | Saturation percentage |
|---|---|---|---|
| A | 5353 | 38 | 0.709882% |
| B | 5353 | 6 | 0.112087% |
| C | 5353 | 266 | 4.969176% |
| D | 5353 | 38 | 0.709882% |
Noise dominated data is calculated using 1-second bins in cleaned event files. If a bin has >2000 counts, and if more than 50% of those come from <1% of pixels, then it is considered to be noise-dominated and hence unusable.
| Quadrant | # 1 sec bins | Bins with >0 counts | Bins with >2000 counts | High rate bins dominated by noise | Noise dominated (total time) | Noise dominated (detector-on time) | Marked lightcurve |
|---|---|---|---|---|---|---|---|
| A | 7146 | 5354 | 29 | 29 | 0.41% | 0.54% | 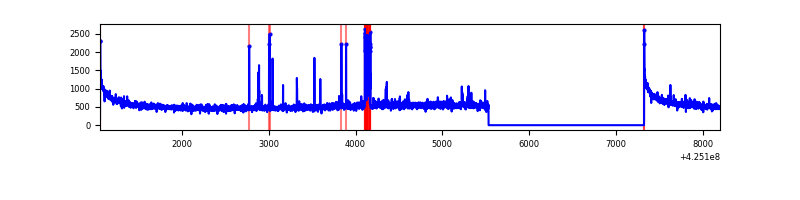 |
| B | 7145 | 5352 | 0 | 0 | 0.00% | 0.00% | 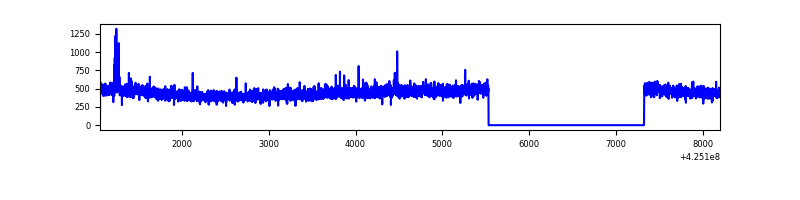 |
| C | 7145 | 5352 | 261 | 261 | 3.65% | 4.88% | 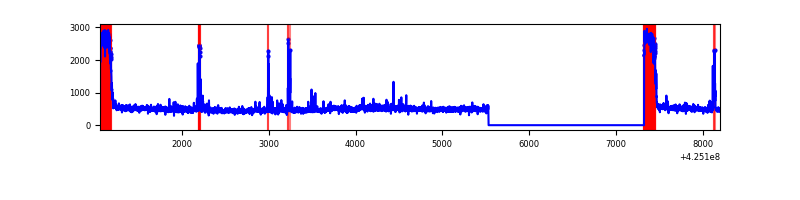 |
| D | 7145 | 5352 | 30 | 30 | 0.42% | 0.56% | 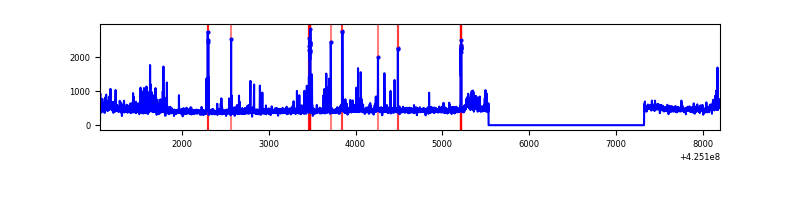 |
Top three noisy pixels from each quadrant. If the there are fewer than three noisy pixels in the level2.evt file, extra rows are filled as -1
| Pixel properties | Quadrant properties | ||||||
|---|---|---|---|---|---|---|---|
| Quadrant | DetID | PixID | Counts | Sigma | Mean | Median | Sigma |
| A | 10 | 83 | 542668 | 4444.29 | 596 | 583 | 122.0 |
| A | 2 | 79 | 133078 | 1086.26 | 596 | 583 | 122.0 |
| A | 12 | 189 | 25413 | 203.57 | 596 | 583 | 122.0 |
| B | 0 | 183 | 28829 | 246.9 | 590 | 573 | 114.4 |
| B | 12 | 111 | 14418 | 120.98 | 590 | 573 | 114.4 |
| B | 11 | 111 | 13394 | 112.03 | 590 | 573 | 114.4 |
| C | 0 | 10 | 717725 | 5400.66 | 569 | 572 | 132.8 |
| C | 15 | 214 | 215858 | 1621.25 | 569 | 572 | 132.8 |
| C | 15 | 159 | 106350 | 796.58 | 569 | 572 | 132.8 |
| D | 12 | 79 | 143526 | 989.67 | 591 | 574 | 144.4 |
| D | 13 | 249 | 124858 | 860.43 | 591 | 574 | 144.4 |
| D | 2 | 234 | 24536 | 165.89 | 591 | 574 | 144.4 |
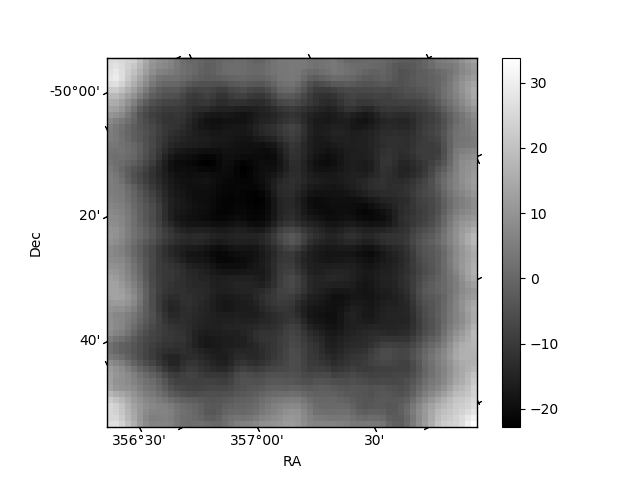
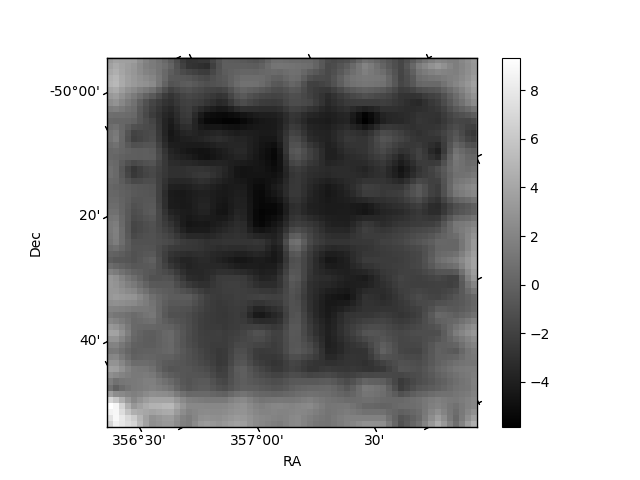
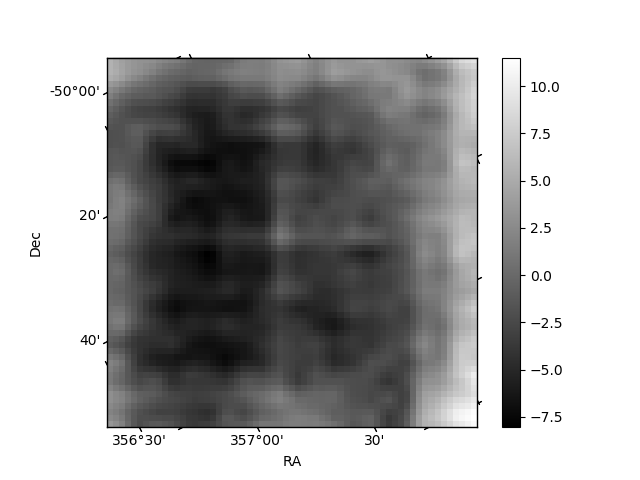
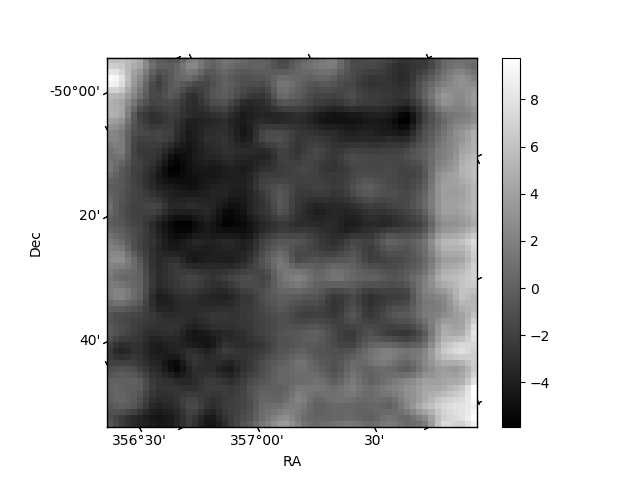
Histogram calculated using DETX and DETY for each event in the final _common_clean file
| Quadrant A | 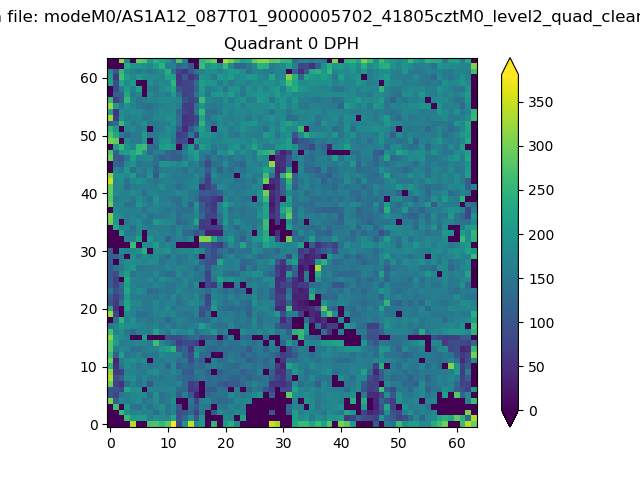 |
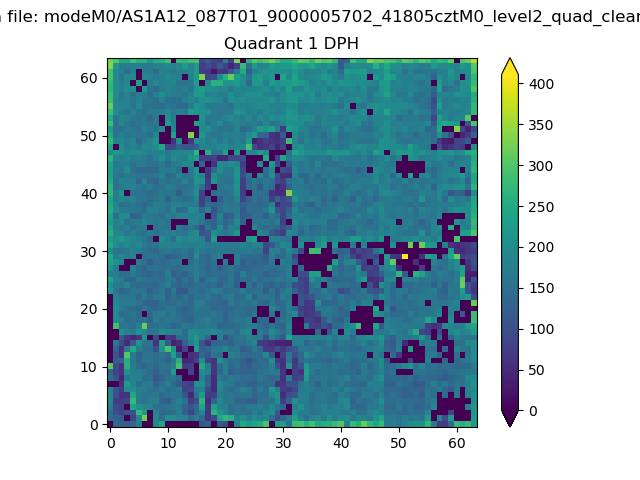 |
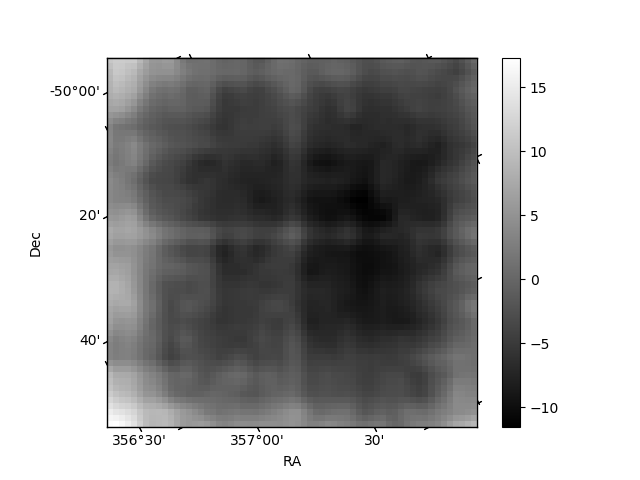
Quadrant B |
|---|---|---|---|
| Quadrant D | 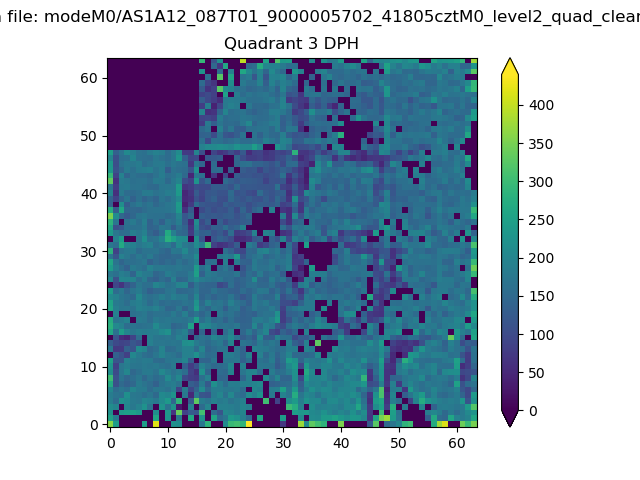 |
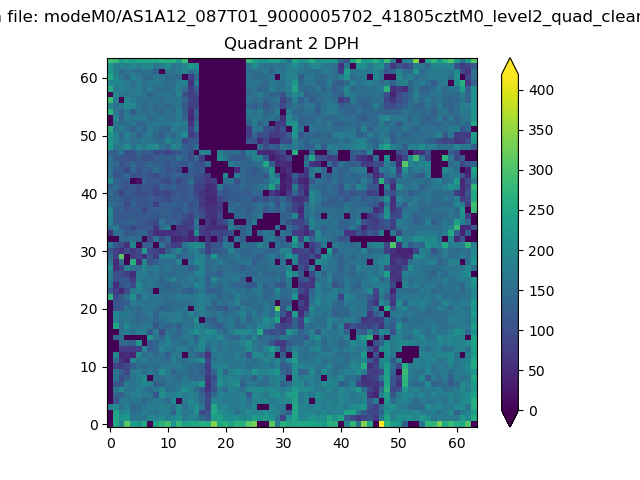 |
Quadrant C |
| Plot type | Count rate plots | Images |
|---|---|---|
| Comparison with Poisson distribution Blue bars denote a histogram of data divided into 1 sec bins. Red curve is a Poisson curve with rate = median count rate of data. |
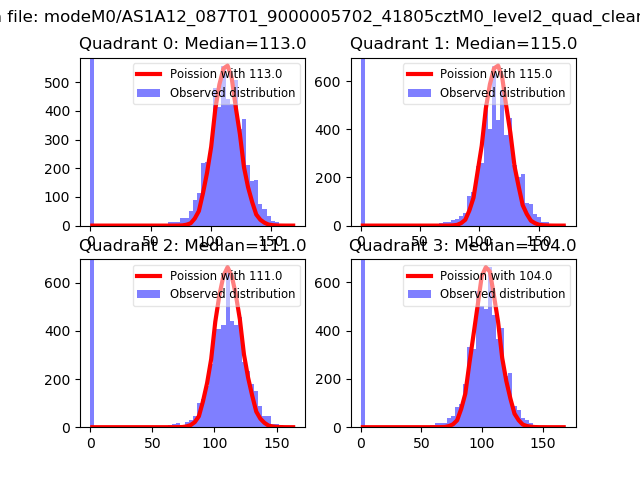 |
 |
| Quadrant-wise count rates Data is divided into 100 sec bins |
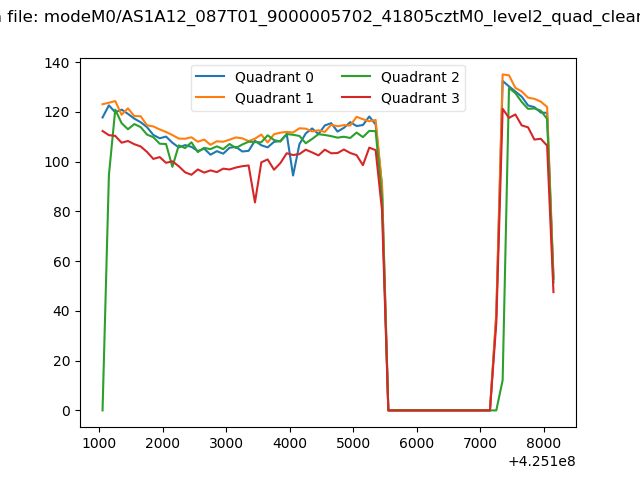 |
|
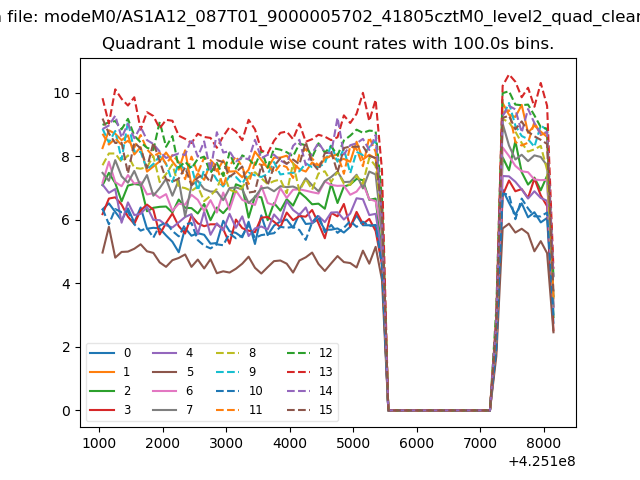
| Module-wise count rates for Quadrant A Data is divided into 100 sec bins |
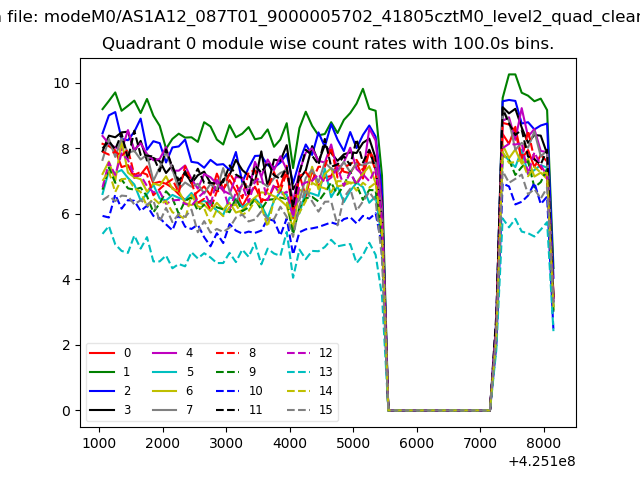 |
 |
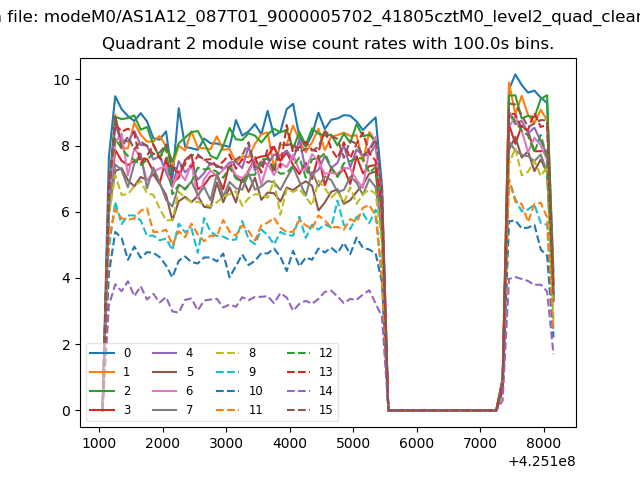
| Module-wise count rates for Quadrant B Data is divided into 100 sec bins |
 |
 |
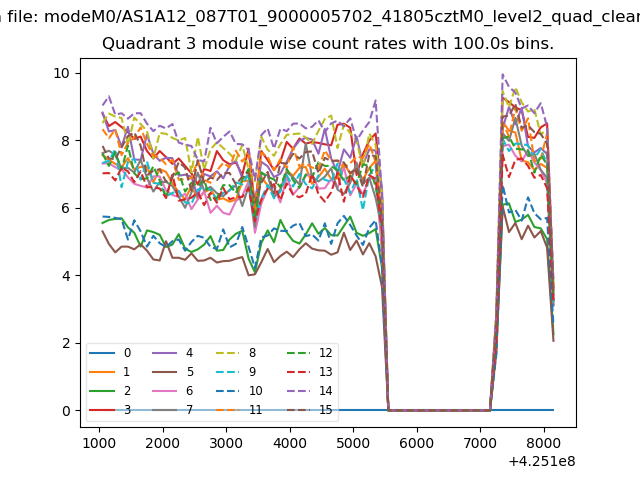
| Module-wise count rates for Quadrant C Data is divided into 100 sec bins |
 |
 |
| Module-wise count rates for Quadrant D Data is divided into 100 sec bins |
 |
 |
| Parameter | Plot |
|---|---|
| CZT HV Monitor | 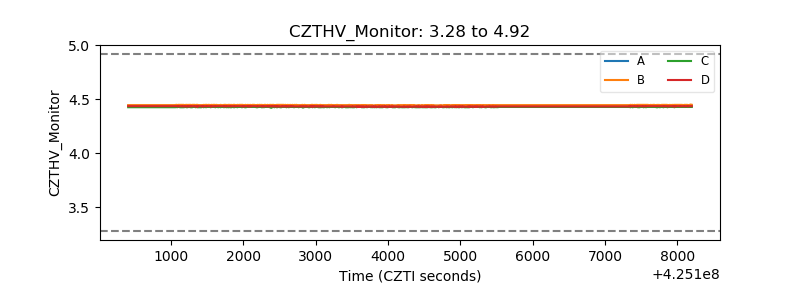 |
| D_VDD | 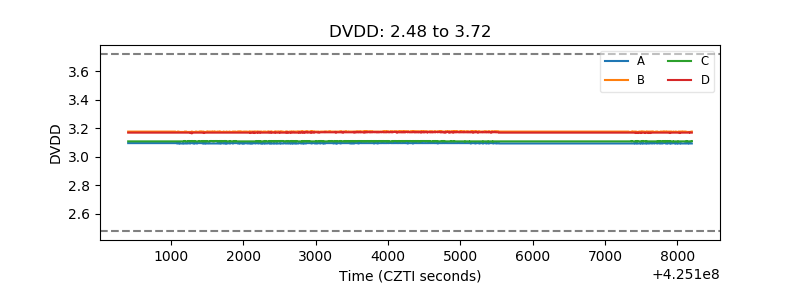 |
| Temperature 1 | 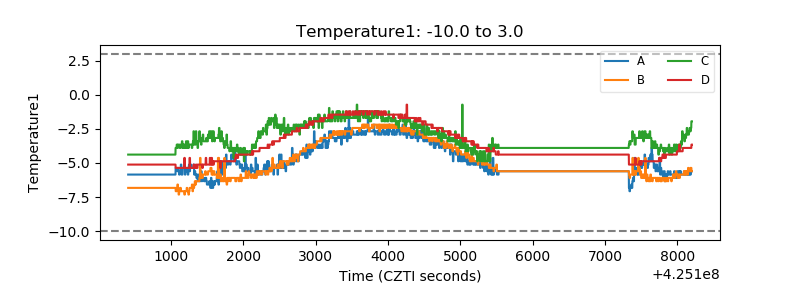 |
| Veto HV Monitor | 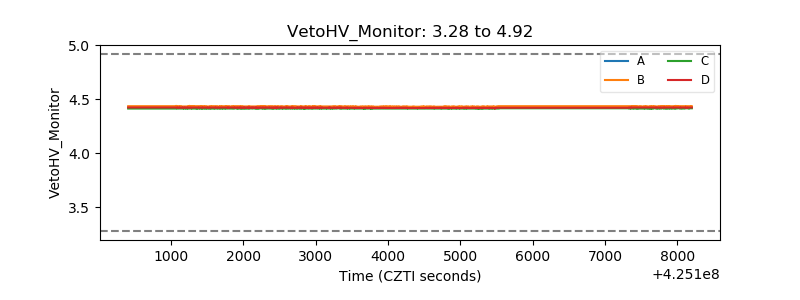 |
| Veto LLD | 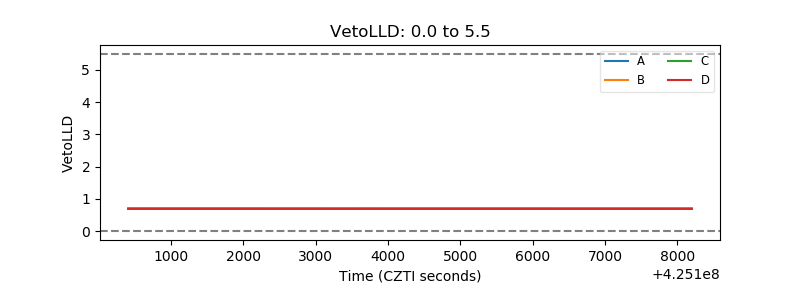 |
| Alpha Counter | 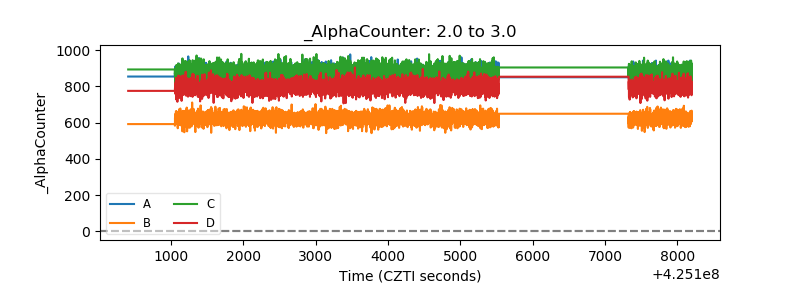 |
| _CPM_Rate | 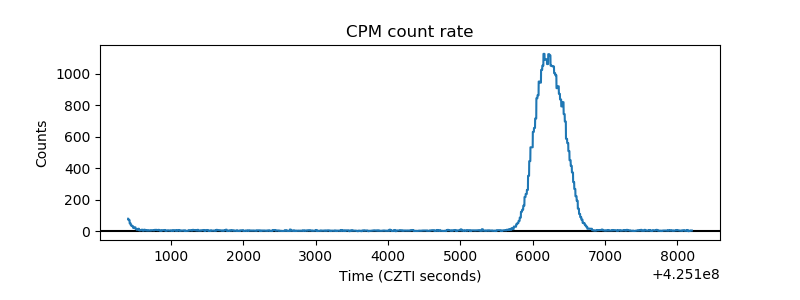 |
| CZT Counter | 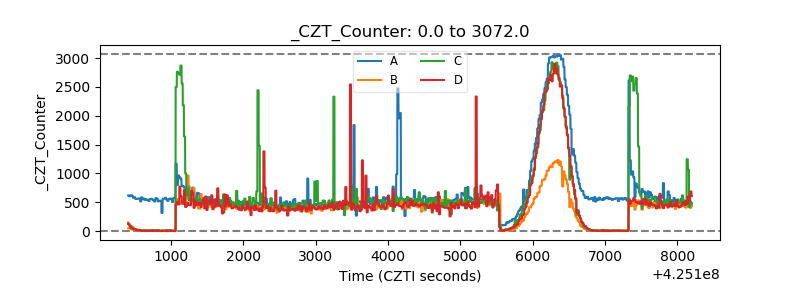 |
| +2.5 Volts monitor | 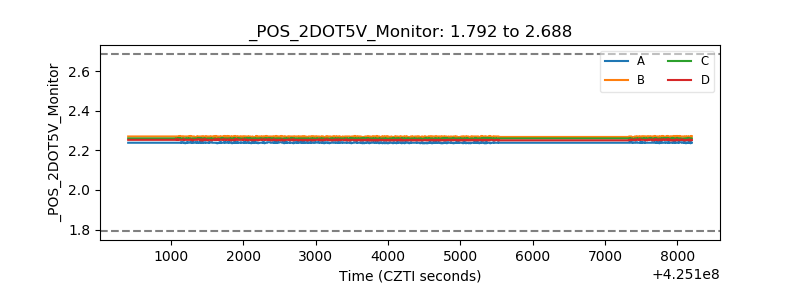 |
| +5 Volts monitor | 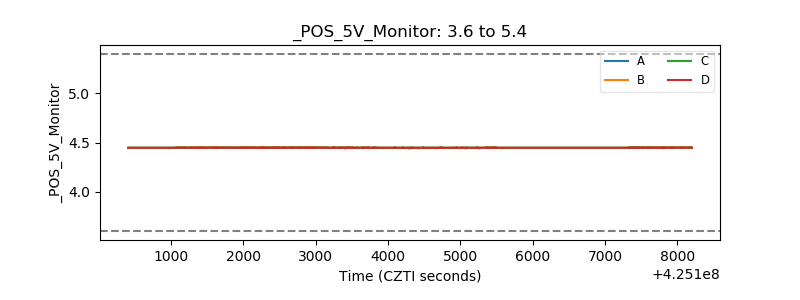 |
| _ROLL_ROT | 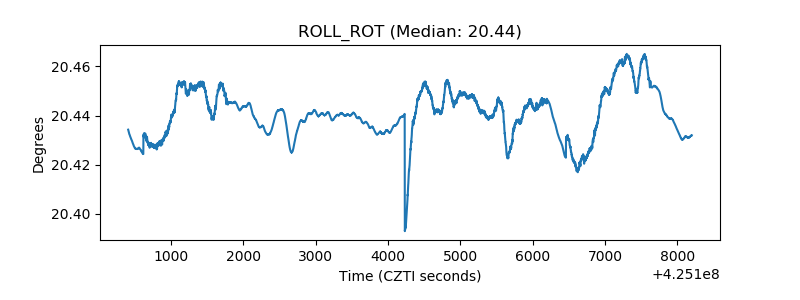 |
| _Roll_DEC | 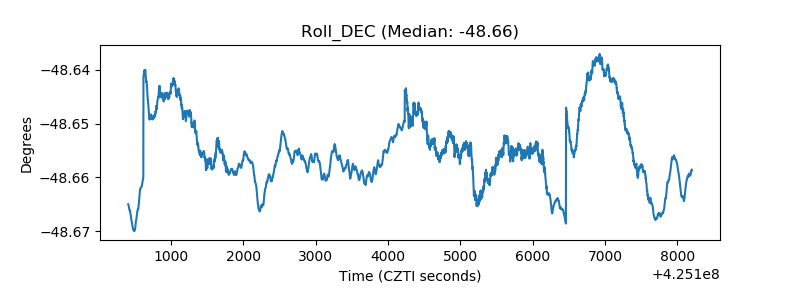 |
| _Roll_RA | 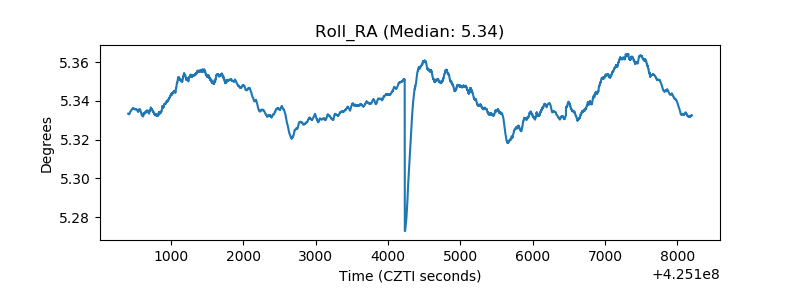 |
| Veto Counter | 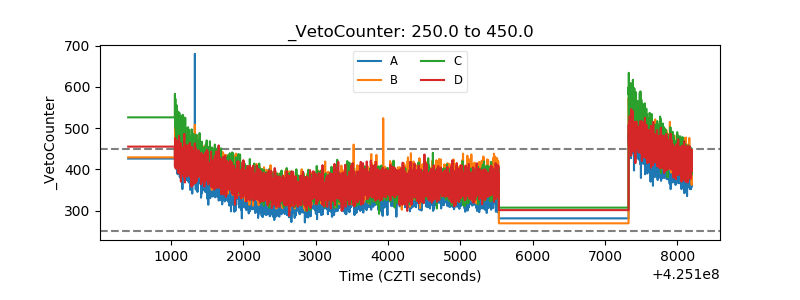 |