| Param | Original file | Final file |
|---|---|---|
| Filename | modeM0/AS1A12_087T01_9000005702_41806cztM0_level2.fits | modeM0/AS1A12_087T01_9000005702_41806cztM0_level2_quad_clean.evt |
| Size (bytes) | 363,778,560 | 98,305,920 |
| Size | 346.9 MB | 93.8 MB |
| Events in quadrant A | 3,159,347 | 667,679 |
| Events in quadrant B | 2,590,243 | 681,978 |
| Events in quadrant C | 3,416,737 | 630,891 |
| Events in quadrant D | 3,860,685 | 602,035 |
| Mode M0 | |||
|---|---|---|---|
| Quadrant | BADHDUFLAG | Total packets | Discarded packets |
| A | 0 | 12655 | 2 |
| B | 0 | 11471 | 2 |
| C | 0 | 13394 | 3 |
| D | 0 | 15153 | 2 |
| Mode SS | |||
|---|---|---|---|
| Quadrant | BADHDUFLAG | Total packets | Discarded packets |
| A | 0 | 114 | 0 |
| B | 0 | 114 | 0 |
| C | 0 | 114 | 0 |
| D | 0 | 114 | 0 |
| Mode M9 | |||
|---|---|---|---|
| Quadrant | BADHDUFLAG | Total packets | Discarded packets |
| A | 0 | 30 | 0 |
| B | 0 | 31 | 0 |
| C | 0 | 31 | 0 |
| D | 0 | 31 | 0 |
| Quadrant | Total seconds | Saturated seconds | Saturation percentage |
|---|---|---|---|
| A | 5640 | 17 | 0.301418% |
| B | 5640 | 7 | 0.124113% |
| C | 5639 | 255 | 4.522078% |
| D | 5639 | 131 | 2.323107% |
Noise dominated data is calculated using 1-second bins in cleaned event files. If a bin has >2000 counts, and if more than 50% of those come from <1% of pixels, then it is considered to be noise-dominated and hence unusable.
| Quadrant | # 1 sec bins | Bins with >0 counts | Bins with >2000 counts | High rate bins dominated by noise | Noise dominated (total time) | Noise dominated (detector-on time) | Marked lightcurve |
|---|---|---|---|---|---|---|---|
| A | 7553 | 5641 | 8 | 8 | 0.11% | 0.14% | 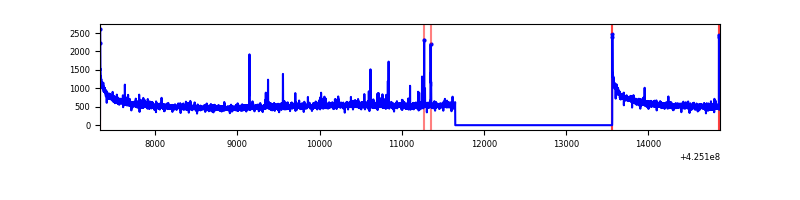 |
| B | 7552 | 5639 | 1 | 1 | 0.01% | 0.02% | 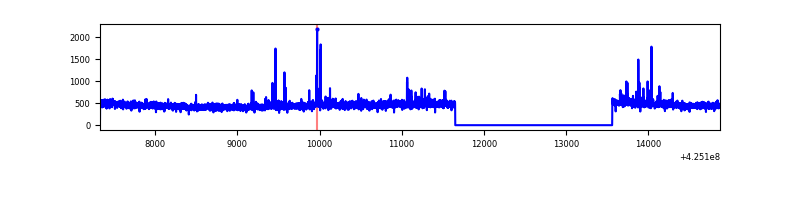 |
| C | 7551 | 5639 | 258 | 258 | 3.42% | 4.58% | 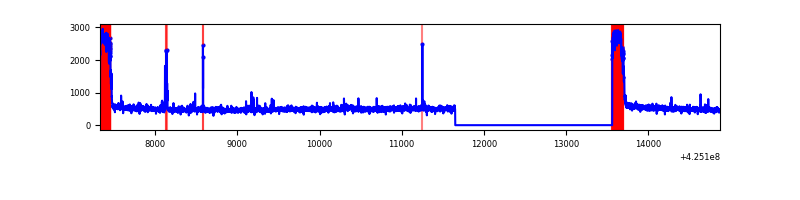 |
| D | 7551 | 5638 | 131 | 131 | 1.73% | 2.32% | 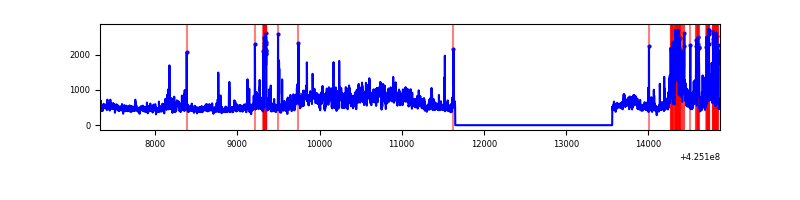 |
Top three noisy pixels from each quadrant. If the there are fewer than three noisy pixels in the level2.evt file, extra rows are filled as -1
| Pixel properties | Quadrant properties | ||||||
|---|---|---|---|---|---|---|---|
| Quadrant | DetID | PixID | Counts | Sigma | Mean | Median | Sigma |
| A | 10 | 83 | 558987 | 4307.16 | 648 | 635 | 129.6 |
| A | 2 | 79 | 41406 | 314.51 | 648 | 635 | 129.6 |
| A | 12 | 189 | 25180 | 189.34 | 648 | 635 | 129.6 |
| B | 4 | 141 | 26338 | 211.58 | 637 | 620 | 121.5 |
| B | 4 | 171 | 26101 | 209.63 | 637 | 620 | 121.5 |
| B | 0 | 183 | 20988 | 167.57 | 637 | 620 | 121.5 |
| C | 0 | 10 | 725357 | 5088.38 | 614 | 617 | 142.4 |
| C | 15 | 214 | 228560 | 1600.38 | 614 | 617 | 142.4 |
| C | 14 | 254 | 28466 | 195.53 | 614 | 617 | 142.4 |
| D | 12 | 79 | 794084 | 5209.92 | 633 | 617 | 152.3 |
| D | 2 | 120 | 318137 | 2084.84 | 633 | 617 | 152.3 |
| D | 13 | 249 | 276419 | 1810.92 | 633 | 617 | 152.3 |
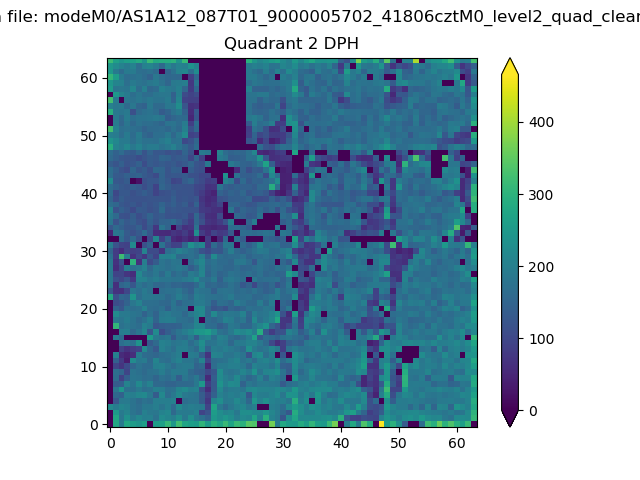
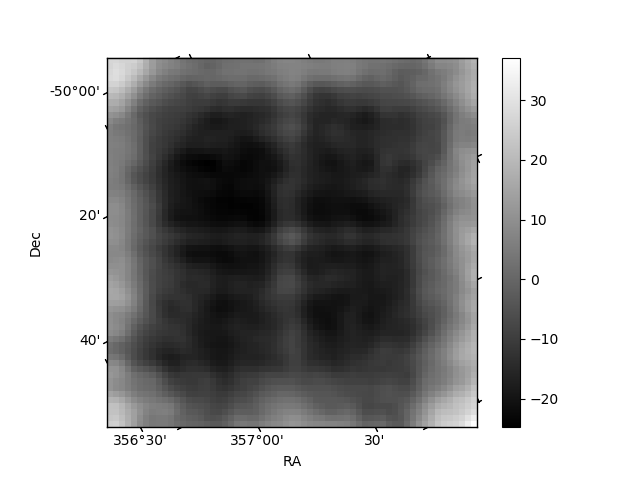
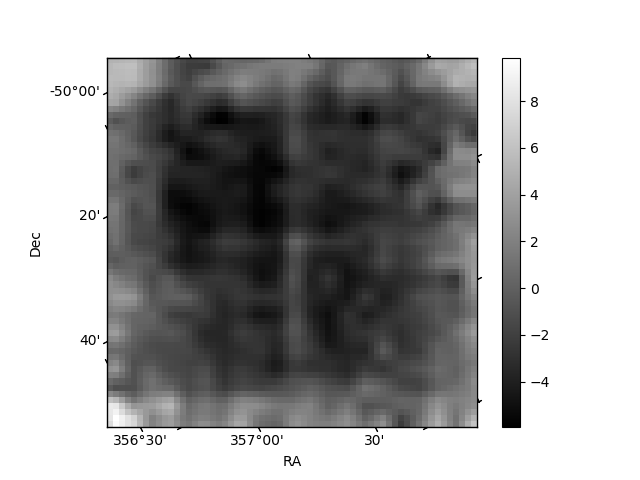
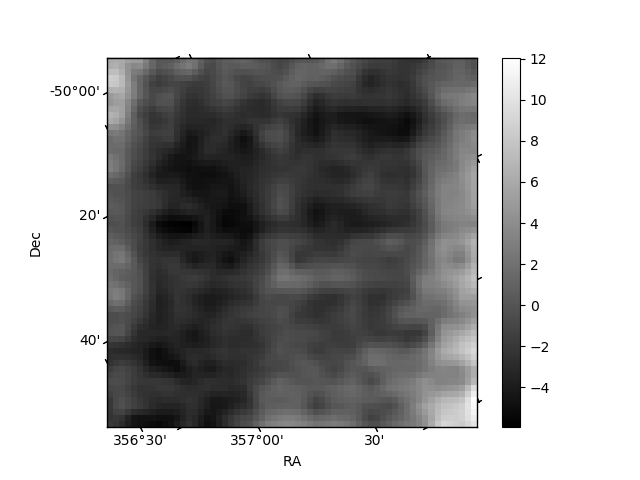
Histogram calculated using DETX and DETY for each event in the final _common_clean file
| Quadrant A | 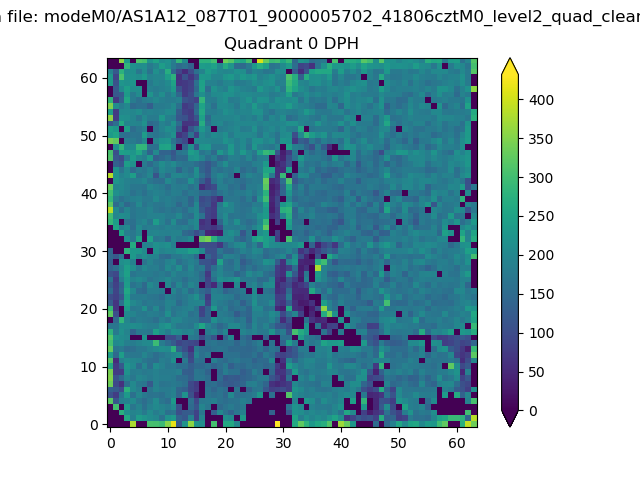 |
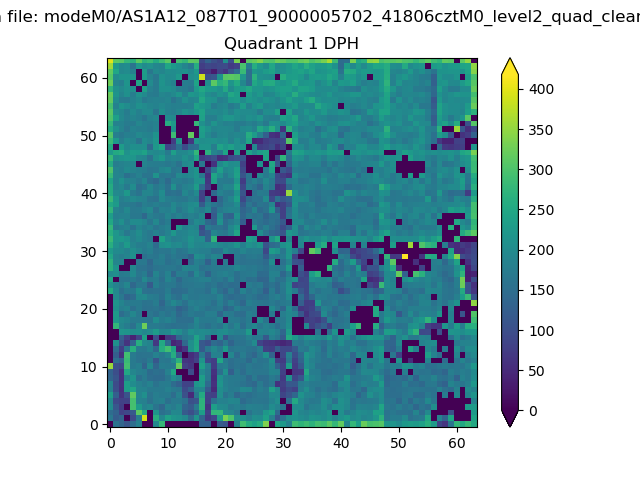 |
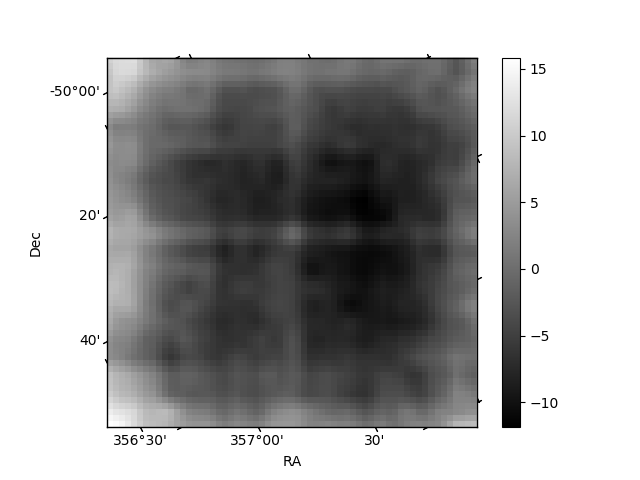
Quadrant B |
|---|---|---|---|
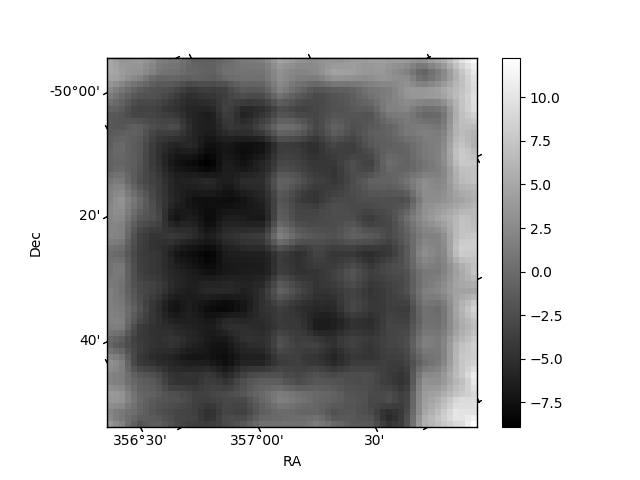
| Quadrant D | 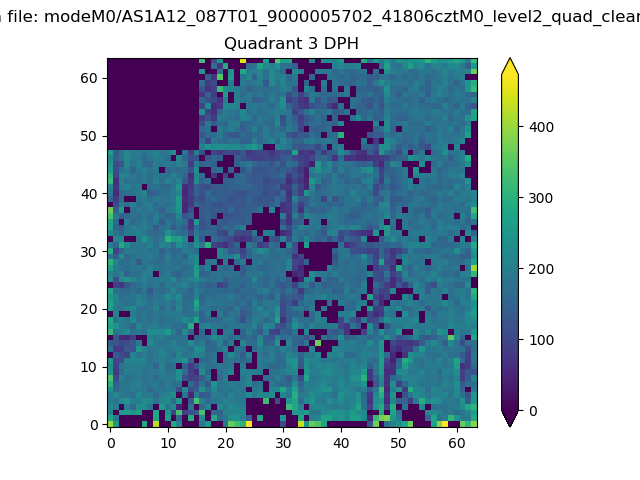 |
 |
Quadrant C |
| Plot type | Count rate plots | Images |
|---|---|---|
| Comparison with Poisson distribution Blue bars denote a histogram of data divided into 1 sec bins. Red curve is a Poisson curve with rate = median count rate of data. |
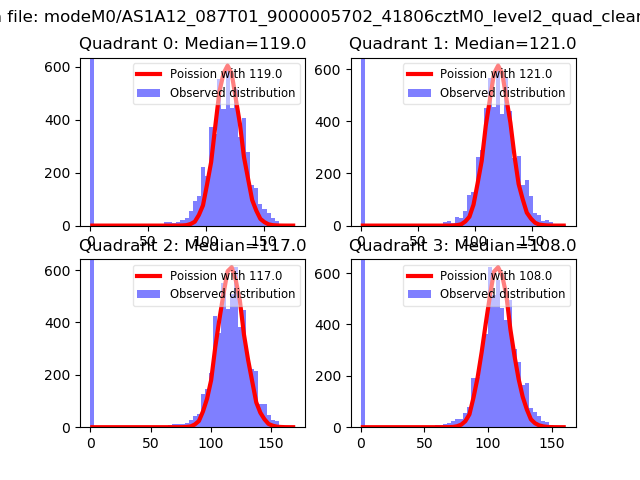 |
 |
| Quadrant-wise count rates Data is divided into 100 sec bins |
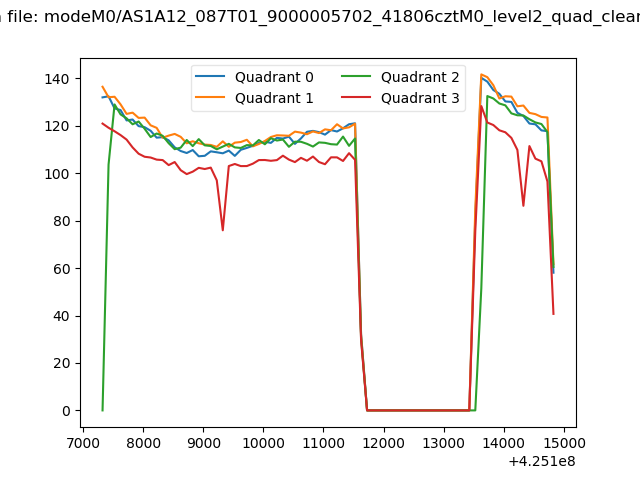 |
|
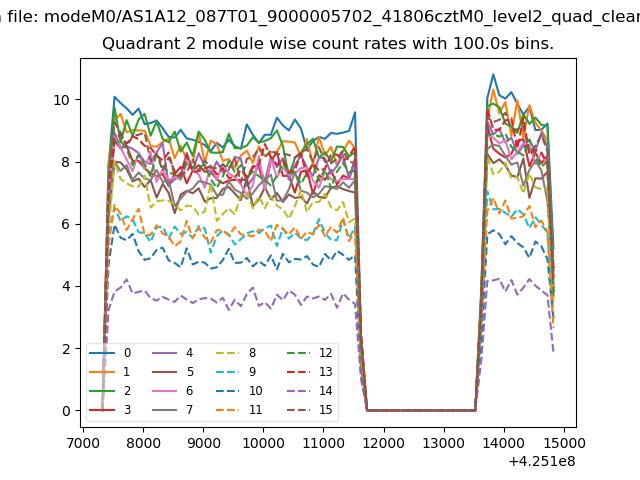
| Module-wise count rates for Quadrant A Data is divided into 100 sec bins |
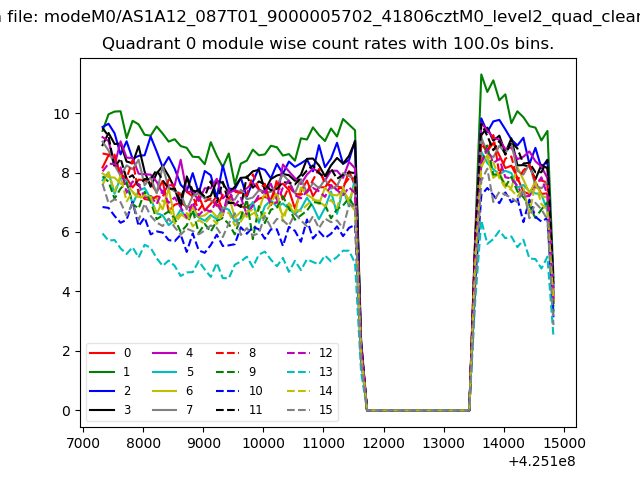 |
 |
| Module-wise count rates for Quadrant B Data is divided into 100 sec bins |
 |
 |
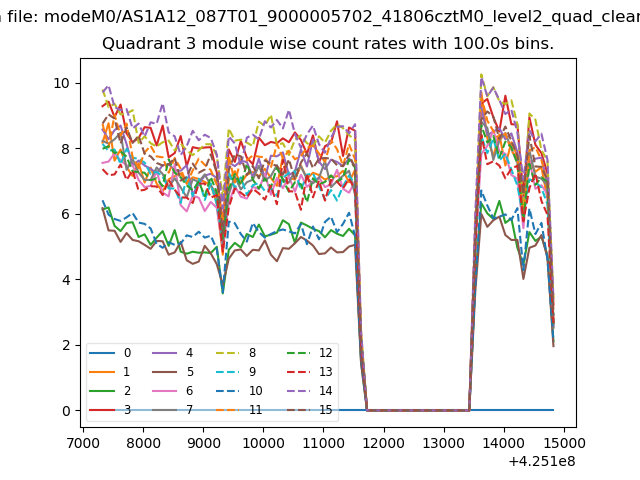
| Module-wise count rates for Quadrant C Data is divided into 100 sec bins |
 |
 |
| Module-wise count rates for Quadrant D Data is divided into 100 sec bins |
 |
 |
| Parameter | Plot |
|---|---|
| CZT HV Monitor | 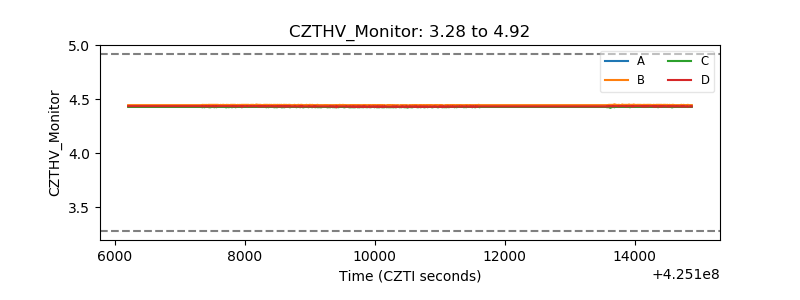 |
| D_VDD | 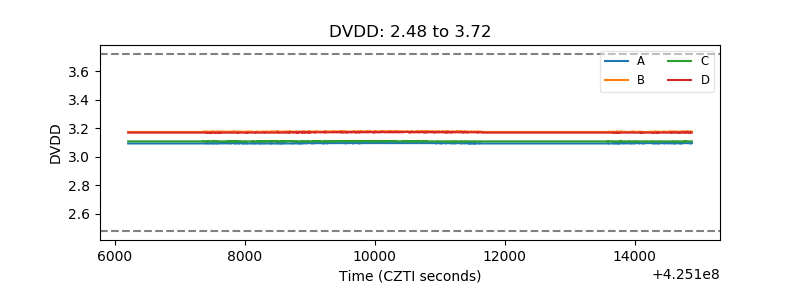 |
| Temperature 1 | 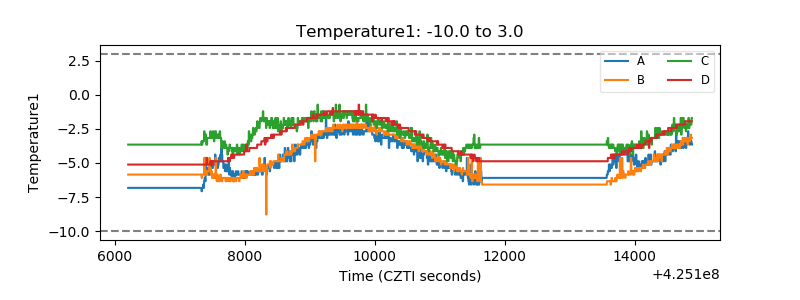 |
| Veto HV Monitor | 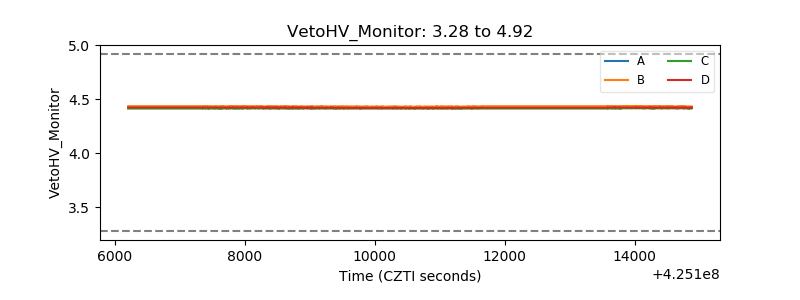 |
| Veto LLD | 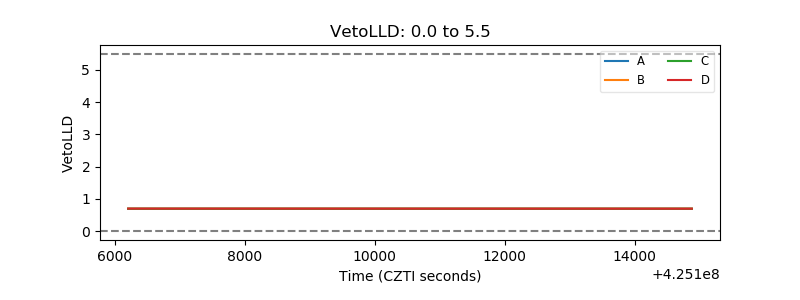 |
| Alpha Counter | 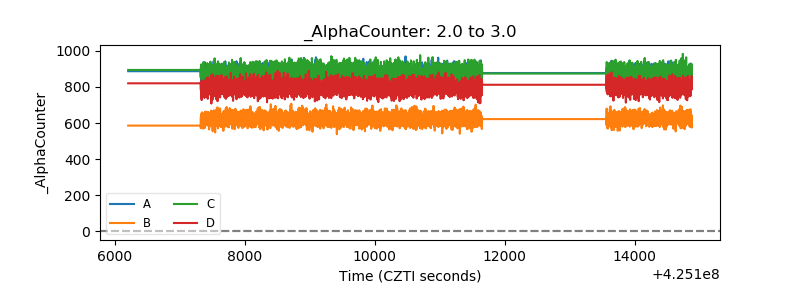 |
| _CPM_Rate | 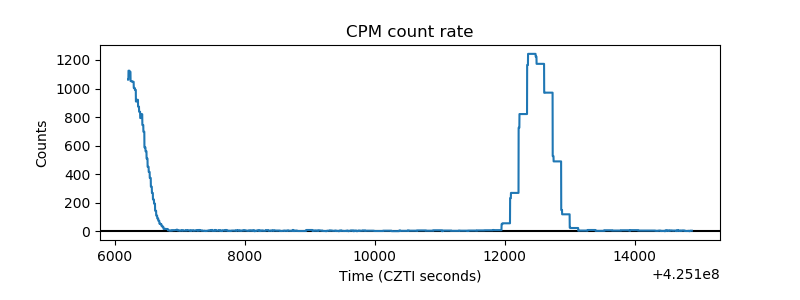 |
| CZT Counter | 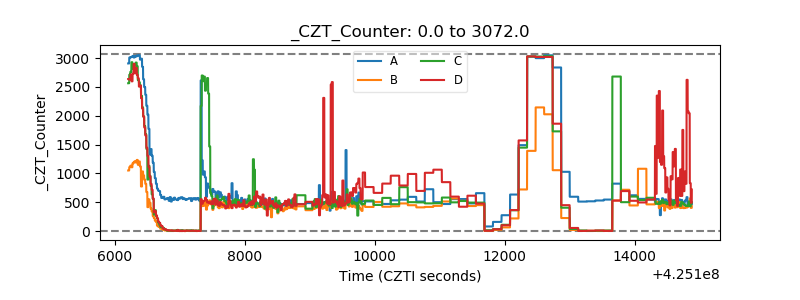 |
| +2.5 Volts monitor | 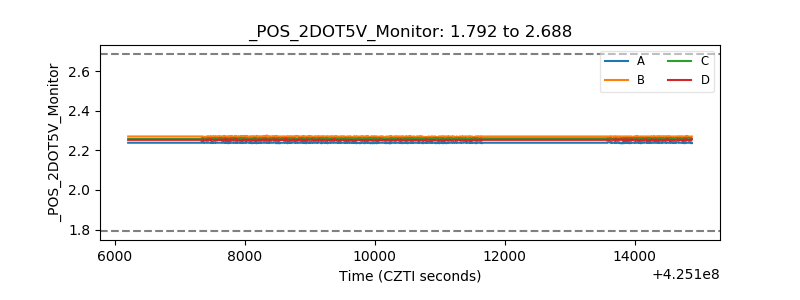 |
| +5 Volts monitor |  |
| _ROLL_ROT | 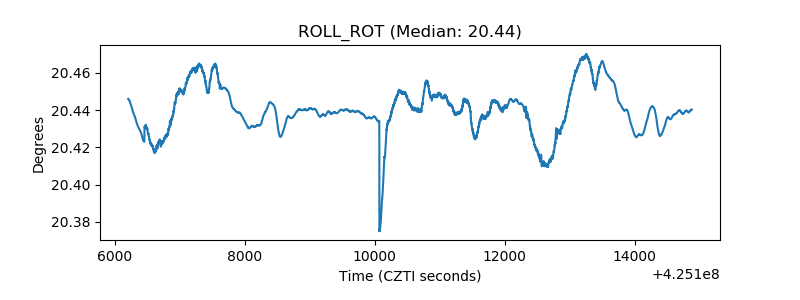 |
| _Roll_DEC | 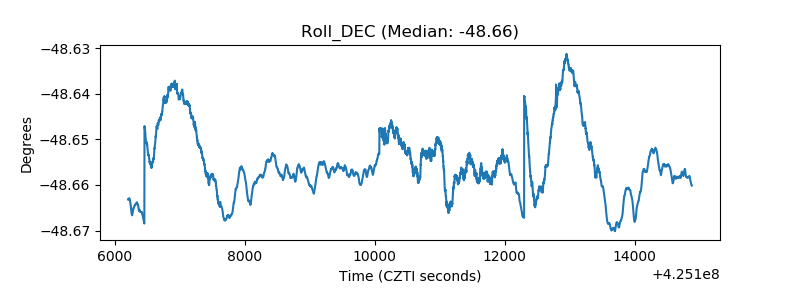 |
| _Roll_RA | 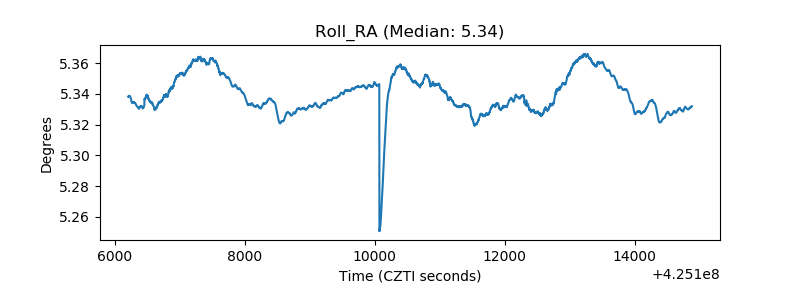 |
| Veto Counter | 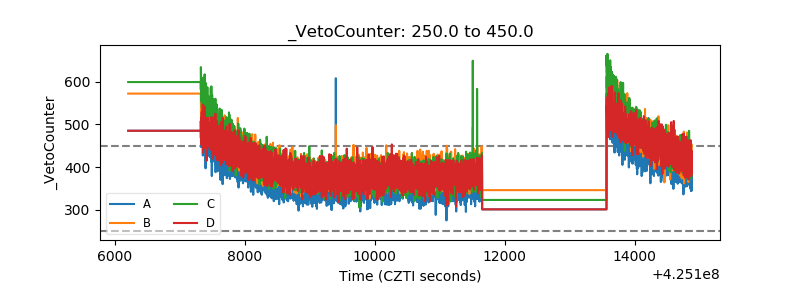 |