| Param | Original file | Final file |
|---|---|---|
| Filename | modeM0/AS1A12_087T01_9000005702_41807cztM0_level2.fits | modeM0/AS1A12_087T01_9000005702_41807cztM0_level2_quad_clean.evt |
| Size (bytes) | 377,697,600 | 84,496,320 |
| Size | 360.2 MB | 80.6 MB |
| Events in quadrant A | 2,793,609 | 609,364 |
| Events in quadrant B | 2,333,512 | 620,079 |
| Events in quadrant C | 2,827,190 | 580,410 |
| Events in quadrant D | 5,637,021 | 398,977 |
| Mode M0 | |||
|---|---|---|---|
| Quadrant | BADHDUFLAG | Total packets | Discarded packets |
| A | 0 | 11037 | 1 |
| B | 0 | 10139 | 1 |
| C | 0 | 11284 | 1 |
| D | 0 | 20101 | 2 |
| Mode SS | |||
|---|---|---|---|
| Quadrant | BADHDUFLAG | Total packets | Discarded packets |
| A | 0 | 100 | 0 |
| B | 0 | 100 | 0 |
| C | 0 | 100 | 0 |
| D | 0 | 100 | 0 |
| Mode M9 | |||
|---|---|---|---|
| Quadrant | BADHDUFLAG | Total packets | Discarded packets |
| A | 0 | 21 | 0 |
| B | 0 | 21 | 0 |
| C | 0 | 21 | 0 |
| D | 0 | 21 | 0 |
| Quadrant | Total seconds | Saturated seconds | Saturation percentage |
|---|---|---|---|
| A | 4995 | 6 | 0.120120% |
| B | 4996 | 5 | 0.100080% |
| C | 4996 | 147 | 2.942354% |
| D | 4995 | 1526 | 30.550551% |
Noise dominated data is calculated using 1-second bins in cleaned event files. If a bin has >2000 counts, and if more than 50% of those come from <1% of pixels, then it is considered to be noise-dominated and hence unusable.
| Quadrant | # 1 sec bins | Bins with >0 counts | Bins with >2000 counts | High rate bins dominated by noise | Noise dominated (total time) | Noise dominated (detector-on time) | Marked lightcurve |
|---|---|---|---|---|---|---|---|
| A | 7028 | 4996 | 5 | 5 | 0.07% | 0.10% | 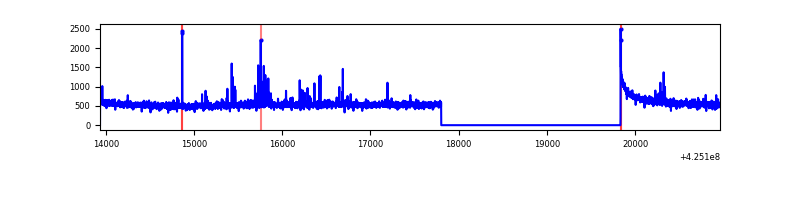 |
| B | 7029 | 4996 | 3 | 3 | 0.04% | 0.06% | 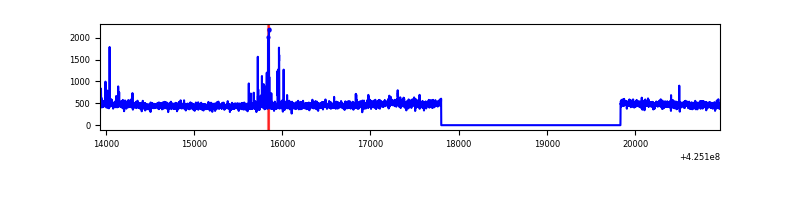 |
| C | 7029 | 4996 | 145 | 145 | 2.06% | 2.90% | 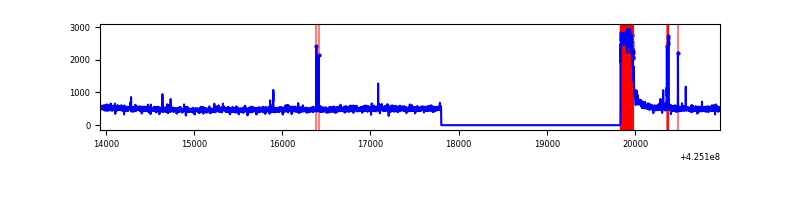 |
| D | 7028 | 4995 | 976 | 976 | 13.89% | 19.54% | 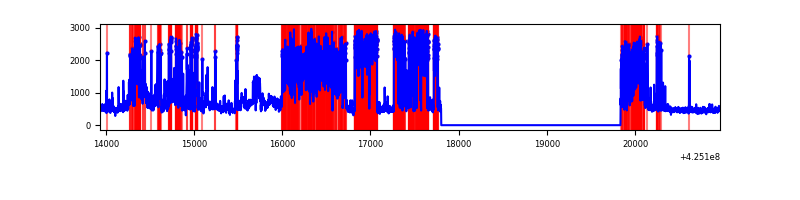 |
Top three noisy pixels from each quadrant. If the there are fewer than three noisy pixels in the level2.evt file, extra rows are filled as -1
| Pixel properties | Quadrant properties | ||||||
|---|---|---|---|---|---|---|---|
| Quadrant | DetID | PixID | Counts | Sigma | Mean | Median | Sigma |
| A | 10 | 83 | 436656 | 3688.12 | 585 | 574 | 118.2 |
| A | 2 | 79 | 54038 | 452.17 | 585 | 574 | 118.2 |
| A | 12 | 189 | 20008 | 164.36 | 585 | 574 | 118.2 |
| B | 0 | 186 | 33674 | 301.52 | 572 | 555 | 109.8 |
| B | 0 | 183 | 25051 | 223.02 | 572 | 555 | 109.8 |
| B | 12 | 111 | 13816 | 120.73 | 572 | 555 | 109.8 |
| C | 0 | 10 | 421604 | 3301.42 | 552 | 556 | 127.5 |
| C | 15 | 214 | 198159 | 1549.4 | 552 | 556 | 127.5 |
| C | 15 | 159 | 43495 | 336.68 | 552 | 556 | 127.5 |
| D | 1 | 52 | 2475013 | 23062.26 | 444 | 433 | 107.3 |
| D | 13 | 249 | 389516 | 3626.12 | 444 | 433 | 107.3 |
| D | 12 | 79 | 384535 | 3579.7 | 444 | 433 | 107.3 |
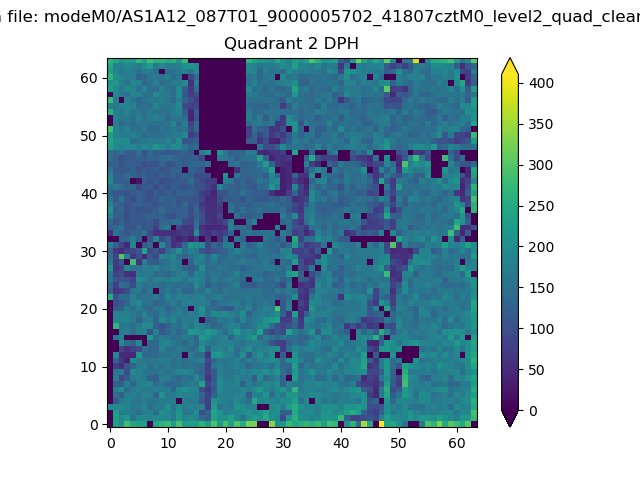
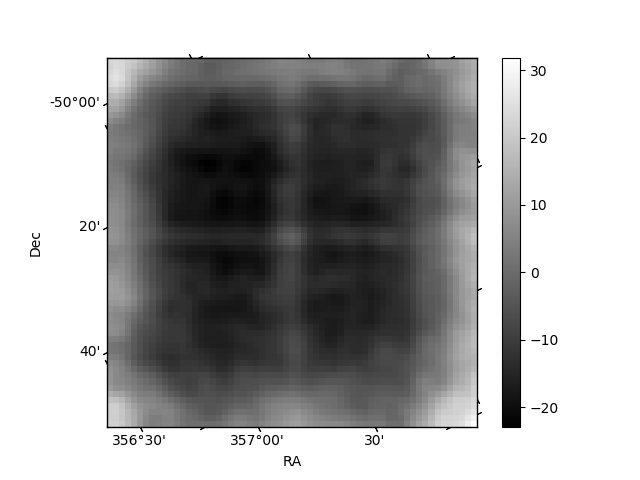
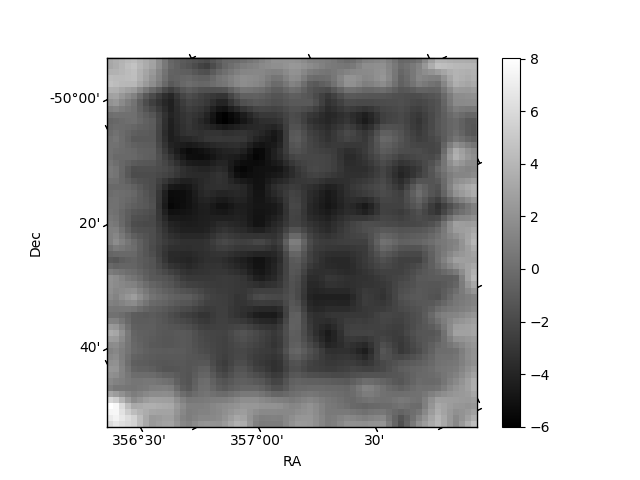
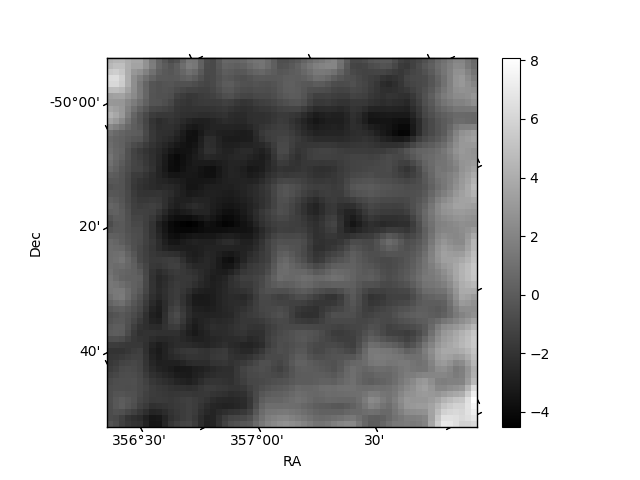
Histogram calculated using DETX and DETY for each event in the final _common_clean file
| Quadrant A | 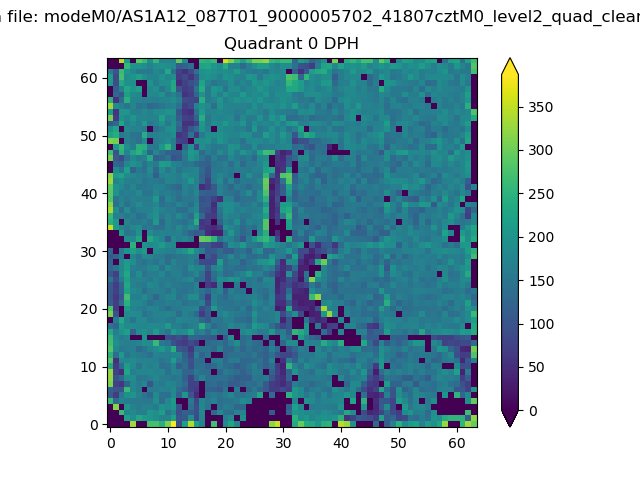 |
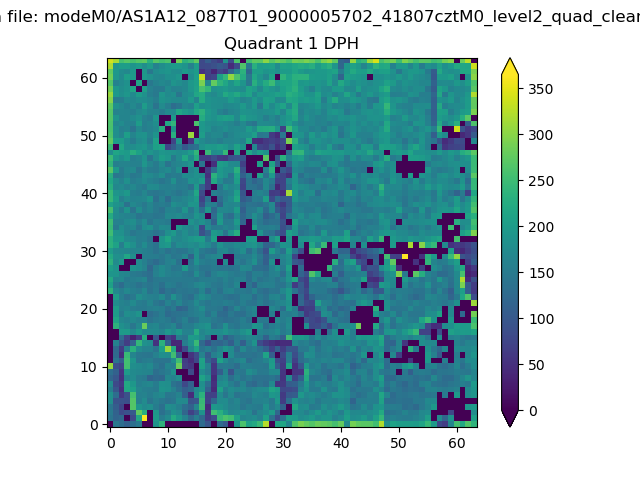 |
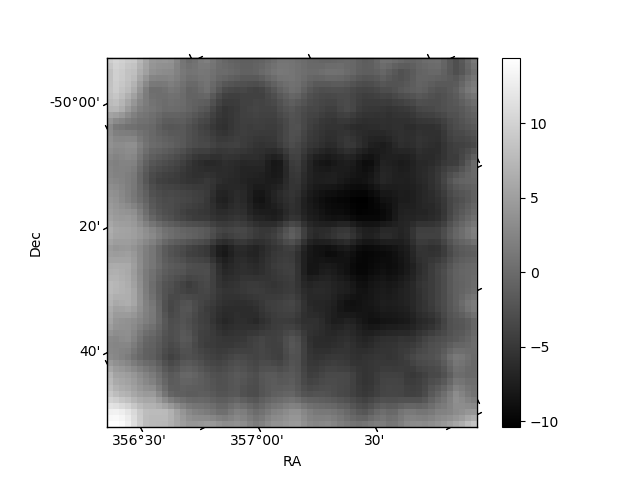
Quadrant B |
|---|---|---|---|
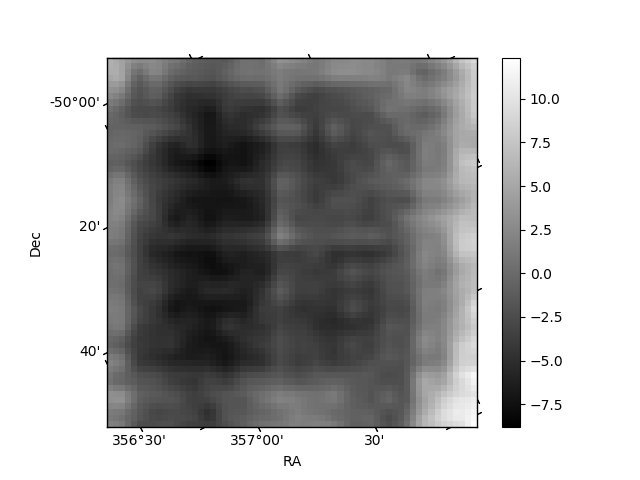
| Quadrant D | 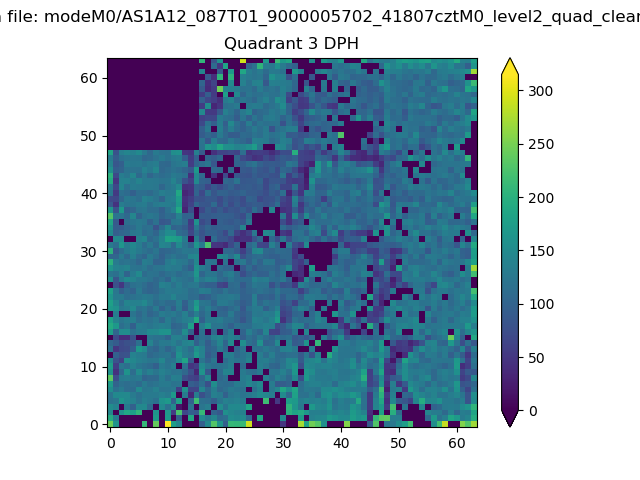 |
 |
Quadrant C |
| Plot type | Count rate plots | Images |
|---|---|---|
| Comparison with Poisson distribution Blue bars denote a histogram of data divided into 1 sec bins. Red curve is a Poisson curve with rate = median count rate of data. |
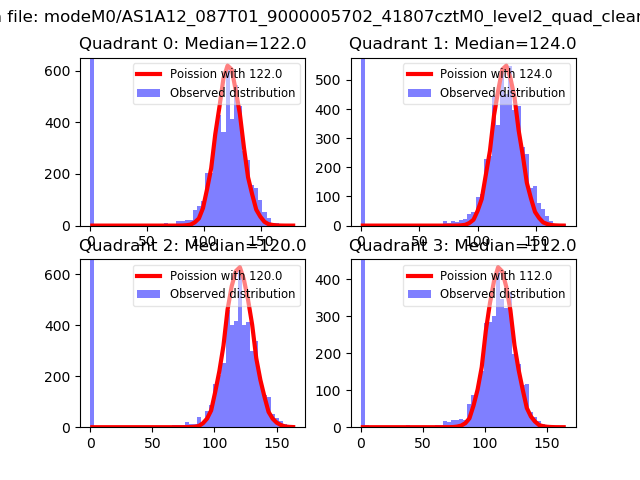 |
 |
| Quadrant-wise count rates Data is divided into 100 sec bins |
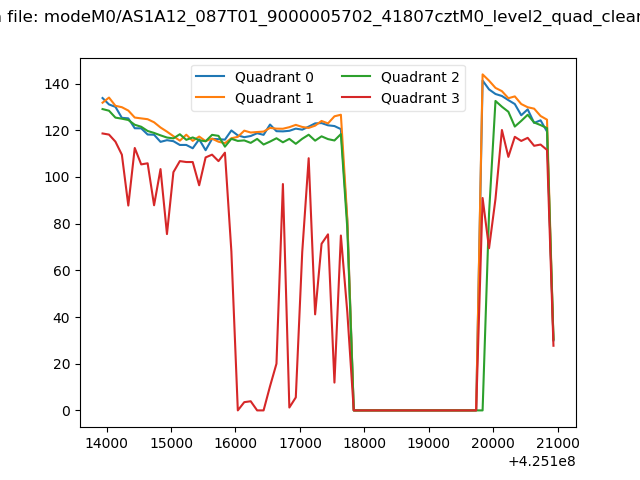 |
|
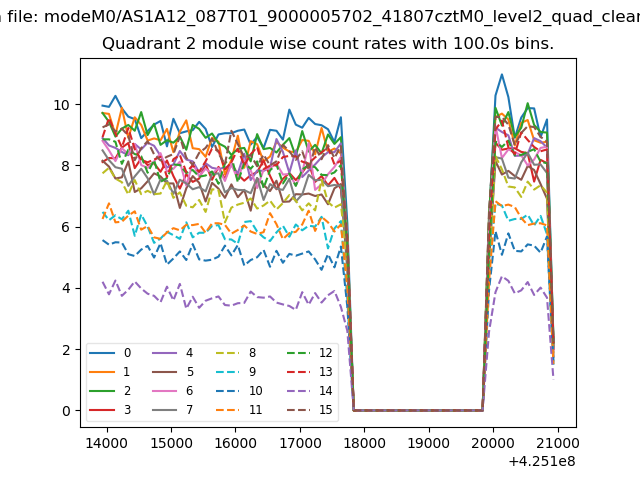
| Module-wise count rates for Quadrant A Data is divided into 100 sec bins |
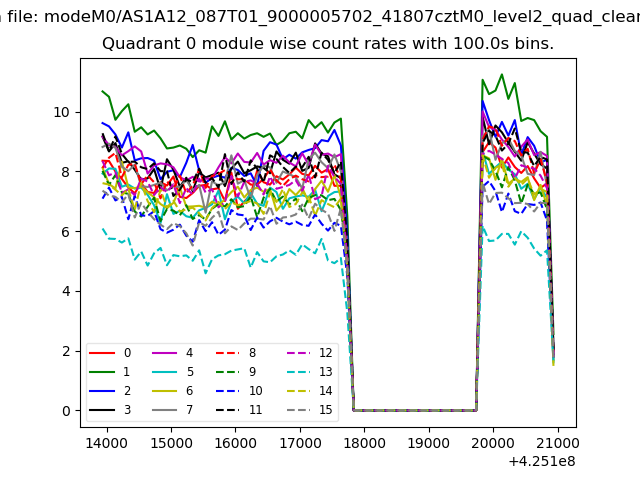 |
 |
| Module-wise count rates for Quadrant B Data is divided into 100 sec bins |
 |
 |
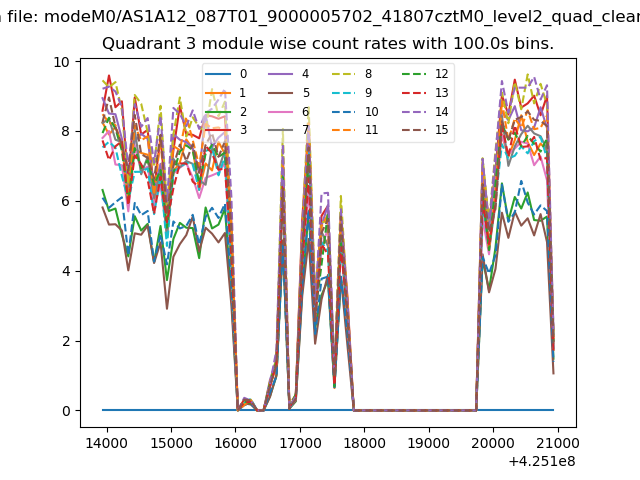
| Module-wise count rates for Quadrant C Data is divided into 100 sec bins |
 |
 |
| Module-wise count rates for Quadrant D Data is divided into 100 sec bins |
 |
 |
| Parameter | Plot |
|---|---|
| CZT HV Monitor |  |
| D_VDD | 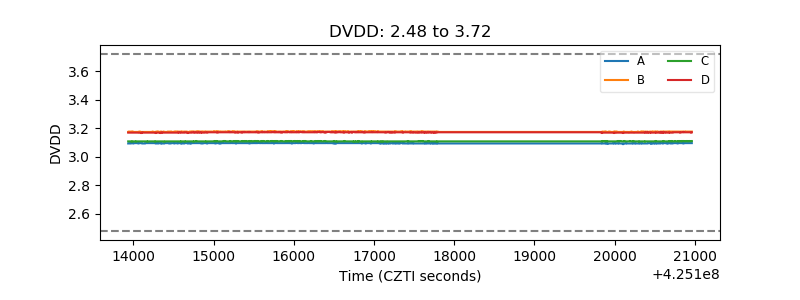 |
| Temperature 1 | 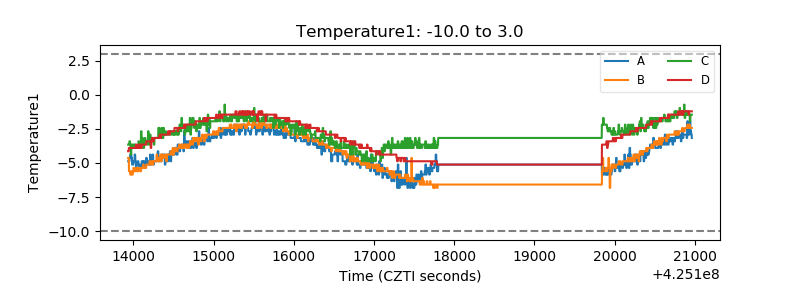 |
| Veto HV Monitor | 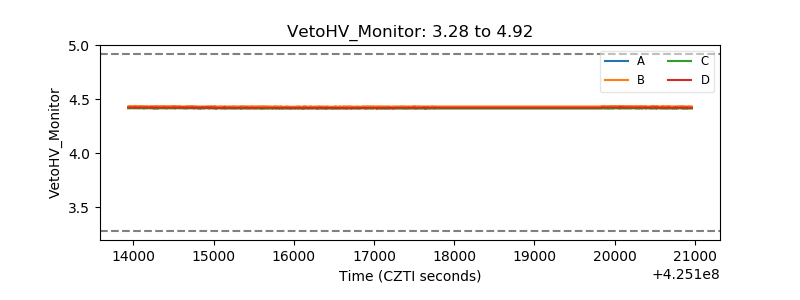 |
| Veto LLD | 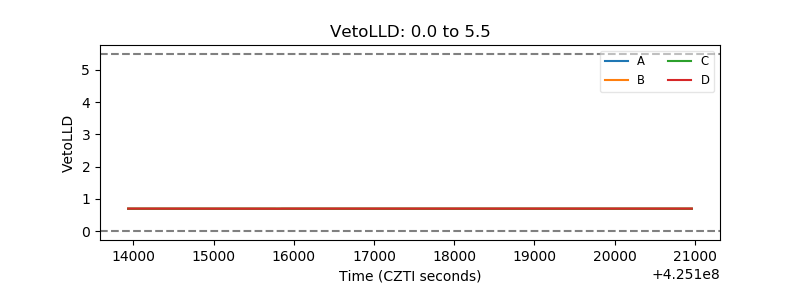 |
| Alpha Counter | 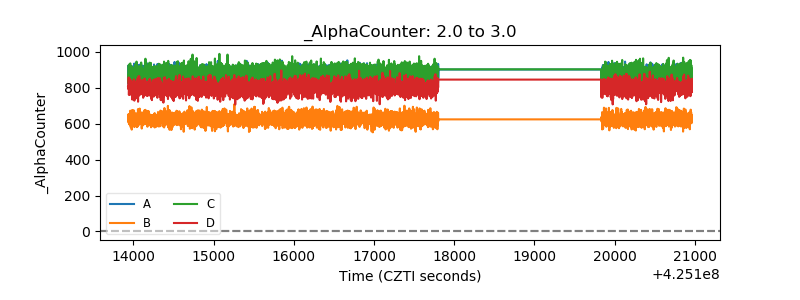 |
| _CPM_Rate | 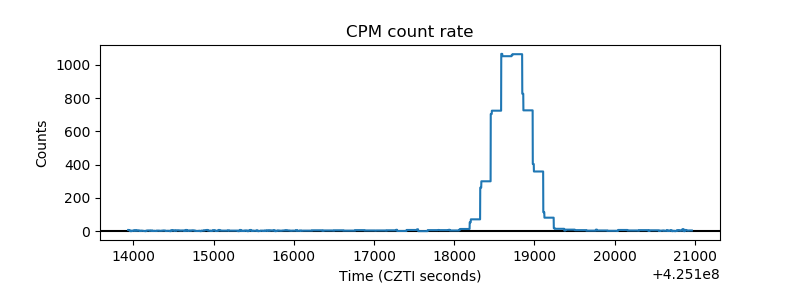 |
| CZT Counter | 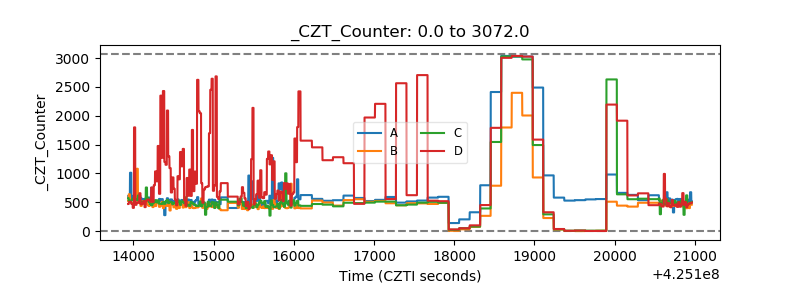 |
| +2.5 Volts monitor | 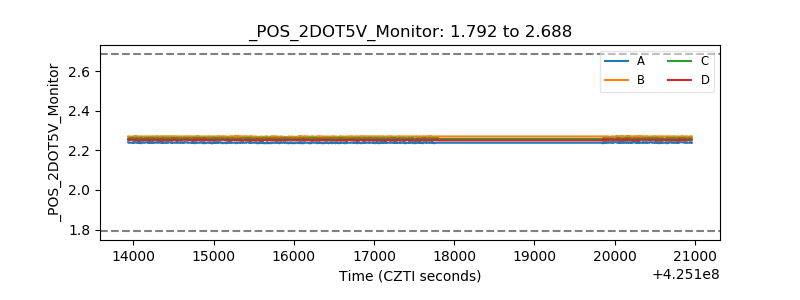 |
| +5 Volts monitor |  |
| _ROLL_ROT | 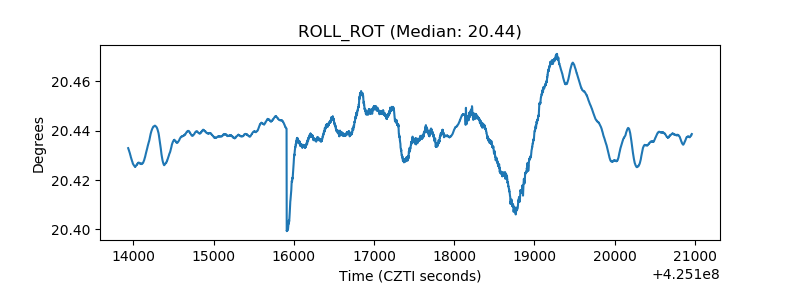 |
| _Roll_DEC | 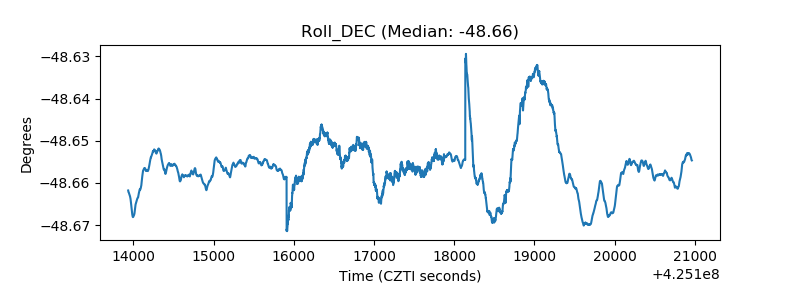 |
| _Roll_RA | 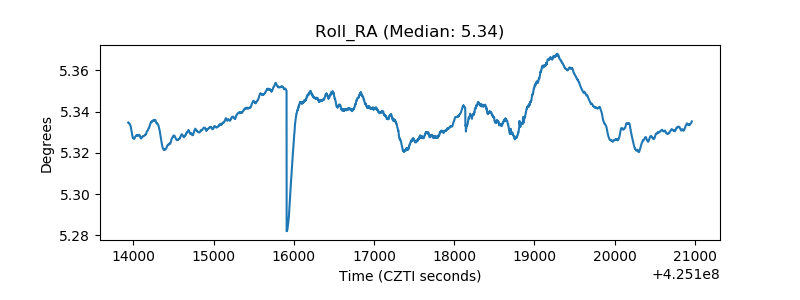 |
| Veto Counter | 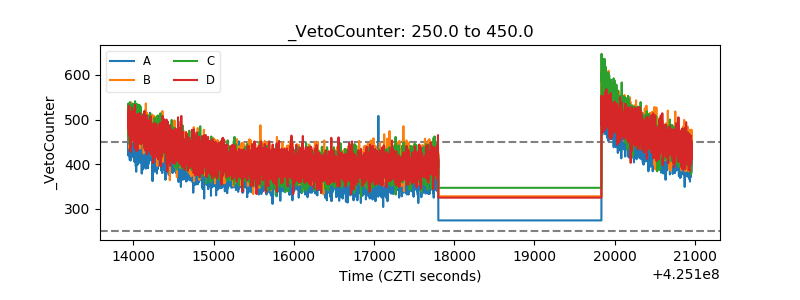 |