| Param | Original file | Final file |
|---|---|---|
| Filename | modeM0/AS1A12_087T01_9000005702_41808cztM0_level2.fits | modeM0/AS1A12_087T01_9000005702_41808cztM0_level2_quad_clean.evt |
| Size (bytes) | 348,364,800 | 92,246,400 |
| Size | 332.2 MB | 88.0 MB |
| Events in quadrant A | 3,100,064 | 637,191 |
| Events in quadrant B | 2,469,357 | 647,276 |
| Events in quadrant C | 3,595,058 | 584,404 |
| Events in quadrant D | 3,324,054 | 558,910 |
| Mode M0 | |||
|---|---|---|---|
| Quadrant | BADHDUFLAG | Total packets | Discarded packets |
| A | 0 | 12256 | 2 |
| B | 0 | 10669 | 2 |
| C | 0 | 13667 | 2 |
| D | 0 | 13196 | 2 |
| Mode SS | |||
|---|---|---|---|
| Quadrant | BADHDUFLAG | Total packets | Discarded packets |
| A | 0 | 106 | 0 |
| B | 0 | 106 | 0 |
| C | 0 | 106 | 0 |
| D | 0 | 106 | 0 |
| Mode M9 | |||
|---|---|---|---|
| Quadrant | BADHDUFLAG | Total packets | Discarded packets |
| A | 0 | 24 | 0 |
| B | 0 | 25 | 0 |
| C | 0 | 25 | 0 |
| D | 0 | 25 | 0 |
| Quadrant | Total seconds | Saturated seconds | Saturation percentage |
|---|---|---|---|
| A | 5220 | 21 | 0.402299% |
| B | 5220 | 21 | 0.402299% |
| C | 5220 | 349 | 6.685824% |
| D | 5220 | 245 | 4.693487% |
Noise dominated data is calculated using 1-second bins in cleaned event files. If a bin has >2000 counts, and if more than 50% of those come from <1% of pixels, then it is considered to be noise-dominated and hence unusable.
| Quadrant | # 1 sec bins | Bins with >0 counts | Bins with >2000 counts | High rate bins dominated by noise | Noise dominated (total time) | Noise dominated (detector-on time) | Marked lightcurve |
|---|---|---|---|---|---|---|---|
| A | 7343 | 5221 | 14 | 14 | 0.19% | 0.27% | 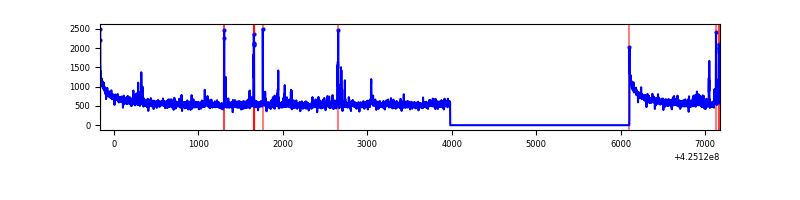 |
| B | 7342 | 5219 | 16 | 16 | 0.22% | 0.31% | 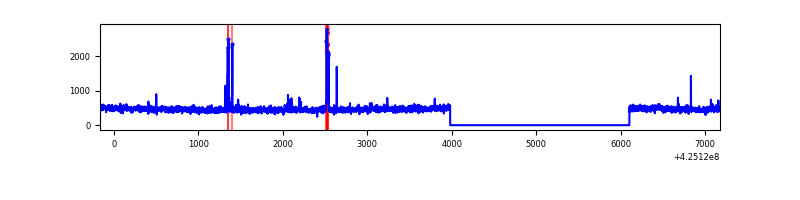 |
| C | 7342 | 5220 | 340 | 340 | 4.63% | 6.51% | 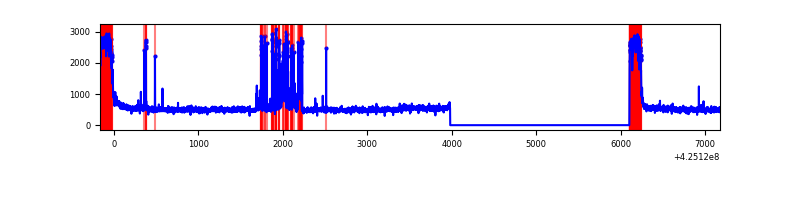 |
| D | 7342 | 5219 | 234 | 234 | 3.19% | 4.48% | 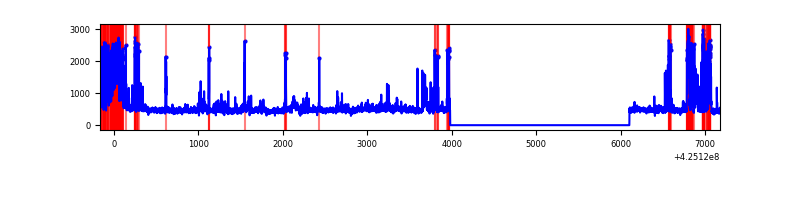 |
Top three noisy pixels from each quadrant. If the there are fewer than three noisy pixels in the level2.evt file, extra rows are filled as -1
| Pixel properties | Quadrant properties | ||||||
|---|---|---|---|---|---|---|---|
| Quadrant | DetID | PixID | Counts | Sigma | Mean | Median | Sigma |
| A | 10 | 83 | 531083 | 4229.22 | 615 | 602 | 125.4 |
| A | 15 | 223 | 63283 | 499.72 | 615 | 602 | 125.4 |
| A | 2 | 79 | 47185 | 371.38 | 615 | 602 | 125.4 |
| B | 5 | 255 | 46924 | 399.83 | 602 | 584 | 115.9 |
| B | 0 | 186 | 36329 | 308.42 | 602 | 584 | 115.9 |
| B | 0 | 183 | 15237 | 126.43 | 602 | 584 | 115.9 |
| C | 0 | 10 | 843919 | 6438.03 | 564 | 568 | 131.0 |
| C | 14 | 254 | 314248 | 2394.59 | 564 | 568 | 131.0 |
| C | 15 | 214 | 205148 | 1561.74 | 564 | 568 | 131.0 |
| D | 2 | 249 | 668842 | 4665.59 | 589 | 574 | 143.2 |
| D | 13 | 249 | 221192 | 1540.27 | 589 | 574 | 143.2 |
| D | 12 | 79 | 137676 | 957.19 | 589 | 574 | 143.2 |
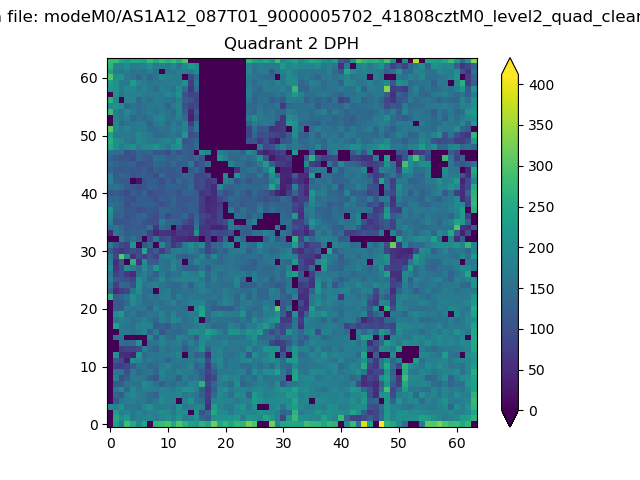
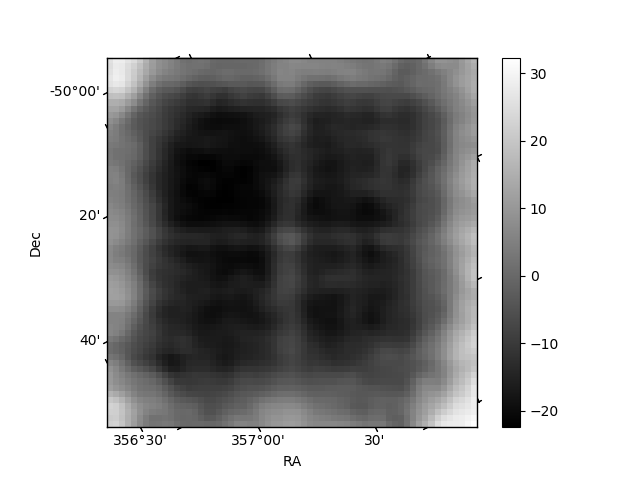
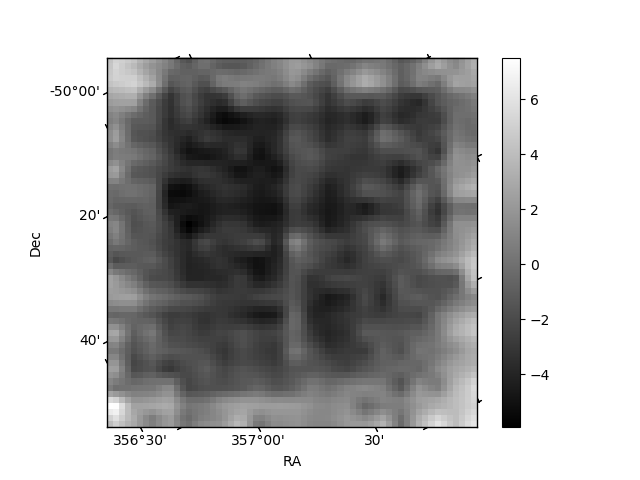
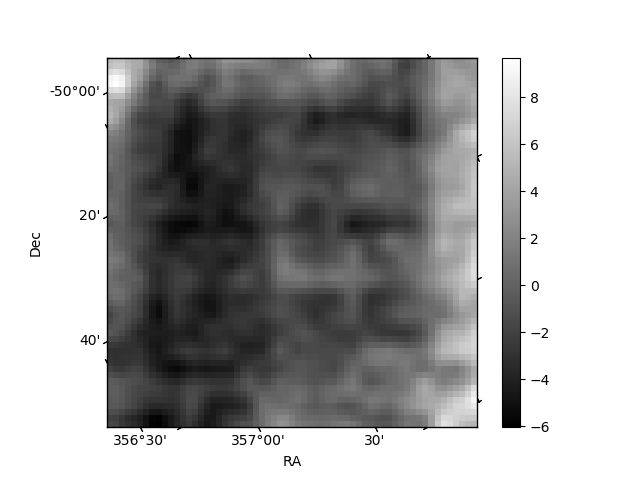
Histogram calculated using DETX and DETY for each event in the final _common_clean file
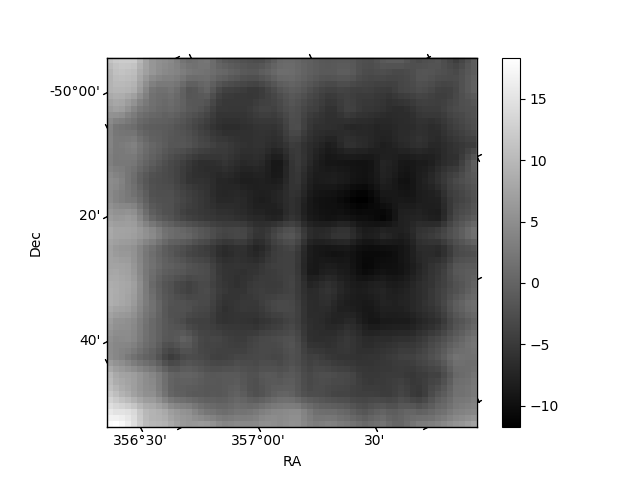
| Quadrant A | 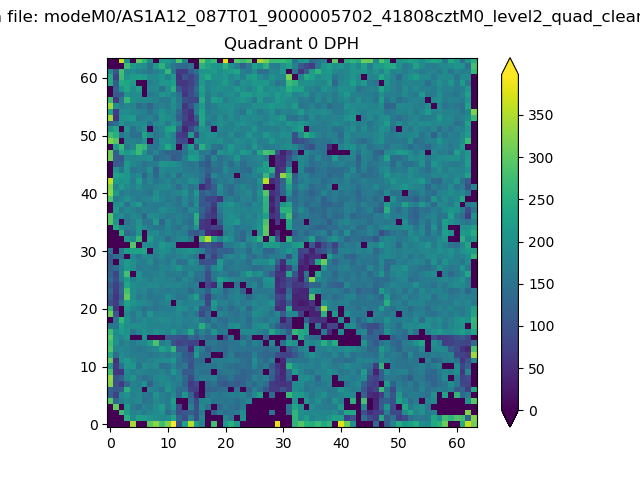 |
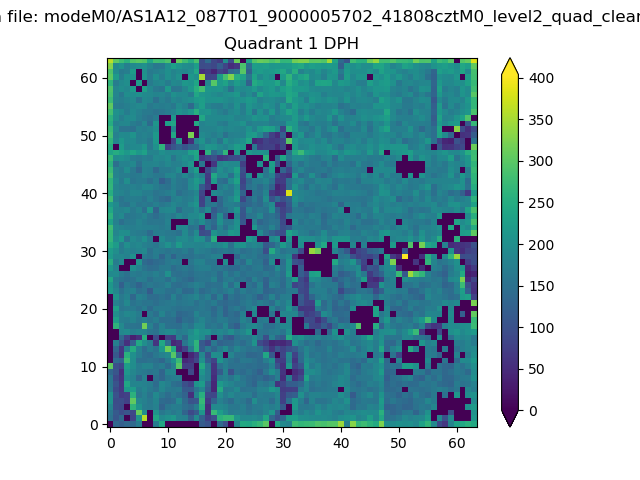 |
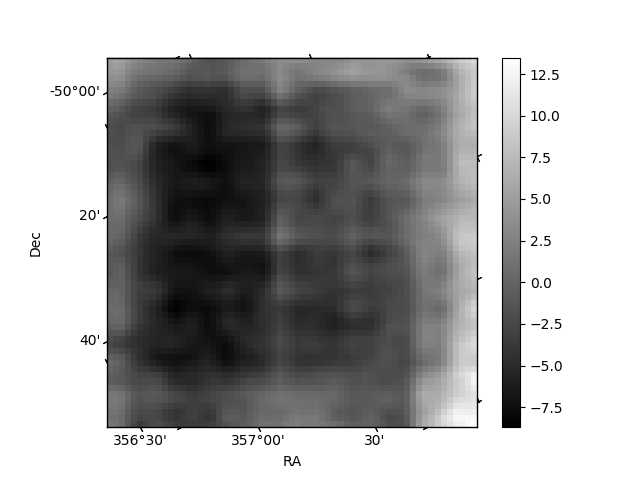
Quadrant B |
|---|---|---|---|
| Quadrant D | 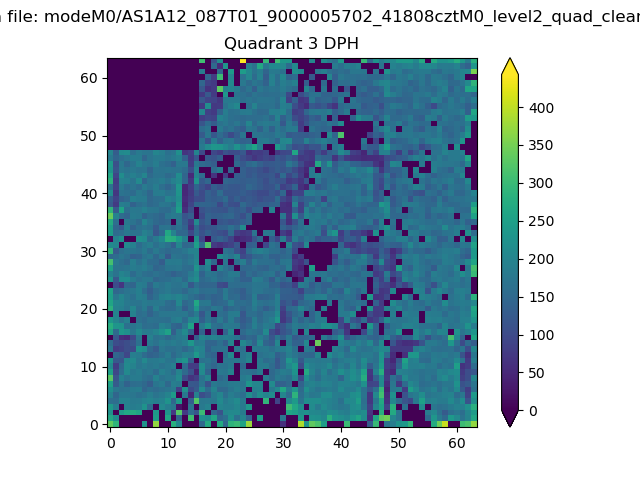 |
 |
Quadrant C |
| Plot type | Count rate plots | Images |
|---|---|---|
| Comparison with Poisson distribution Blue bars denote a histogram of data divided into 1 sec bins. Red curve is a Poisson curve with rate = median count rate of data. |
 |
 |
| Quadrant-wise count rates Data is divided into 100 sec bins |
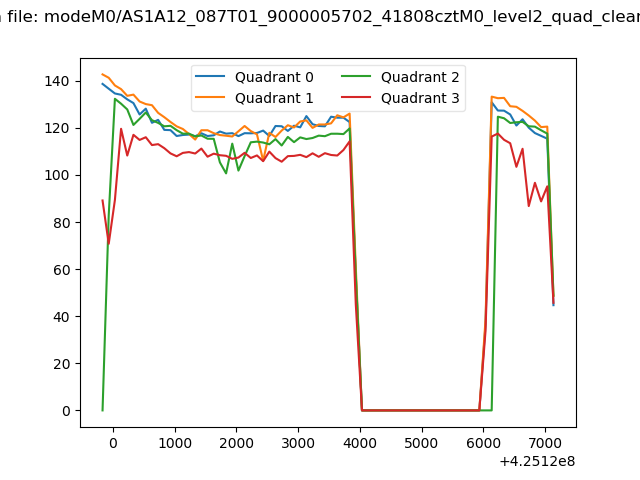 |
|
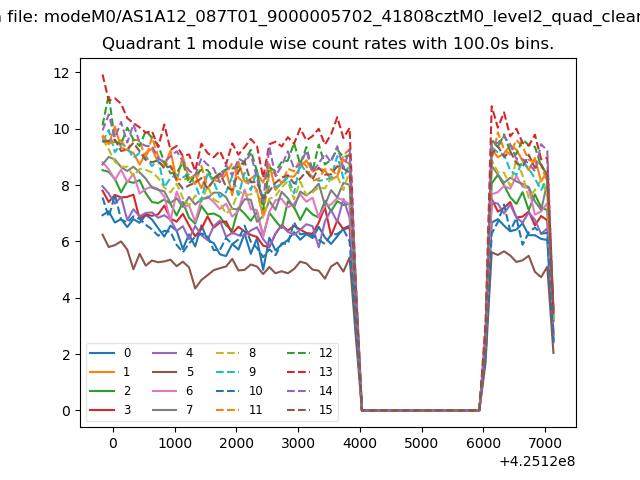
| Module-wise count rates for Quadrant A Data is divided into 100 sec bins |
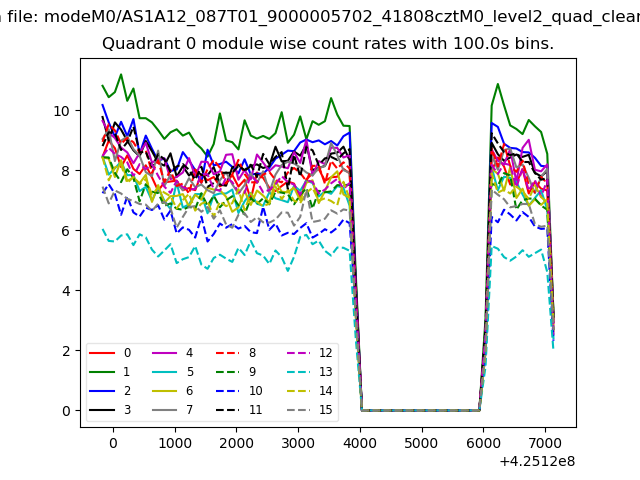 |
 |
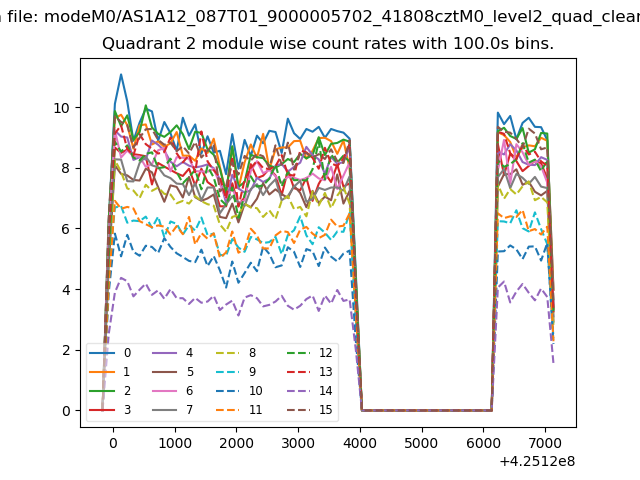
| Module-wise count rates for Quadrant B Data is divided into 100 sec bins |
 |
 |
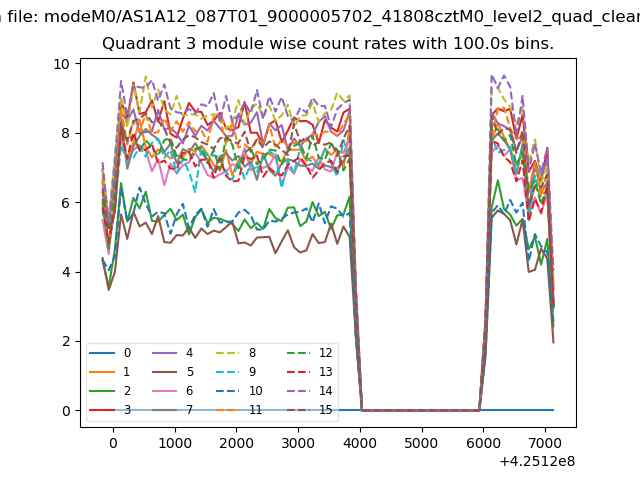
| Module-wise count rates for Quadrant C Data is divided into 100 sec bins |
 |
 |
| Module-wise count rates for Quadrant D Data is divided into 100 sec bins |
 |
 |
| Parameter | Plot |
|---|---|
| CZT HV Monitor | 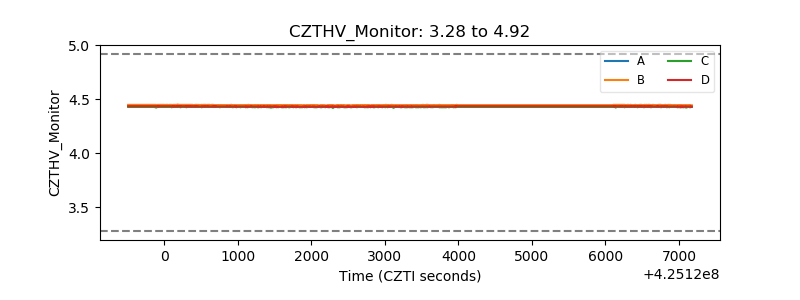 |
| D_VDD | 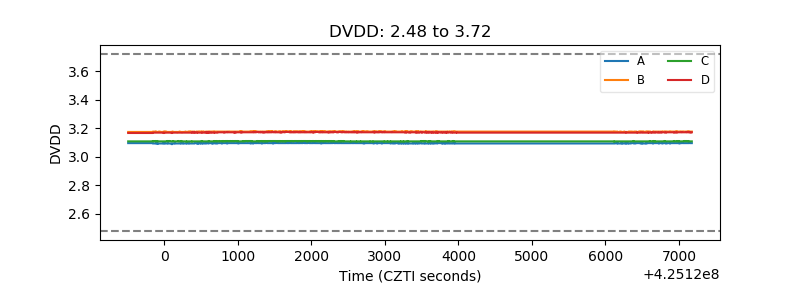 |
| Temperature 1 | 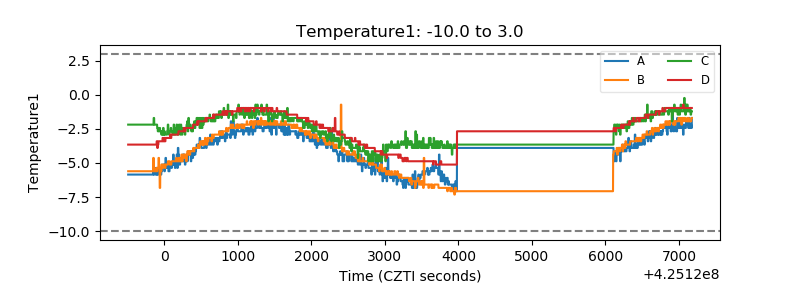 |
| Veto HV Monitor | 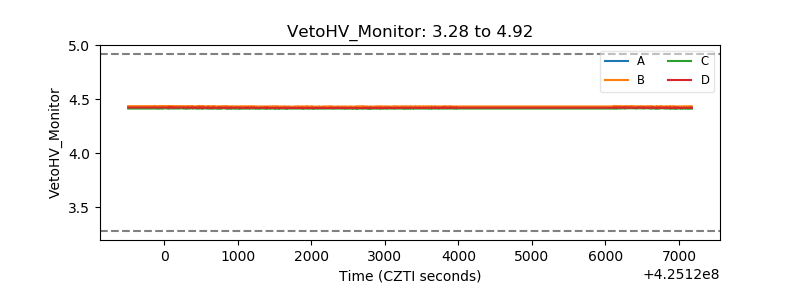 |
| Veto LLD | 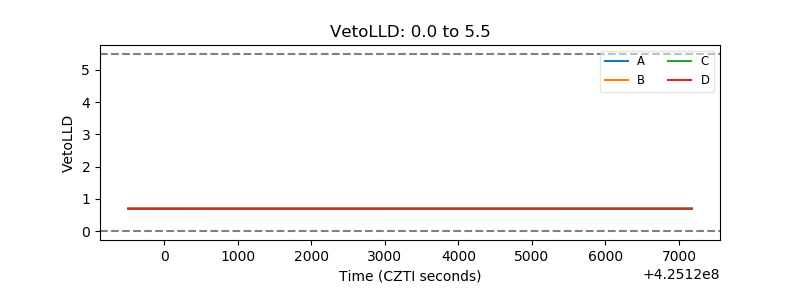 |
| Alpha Counter | 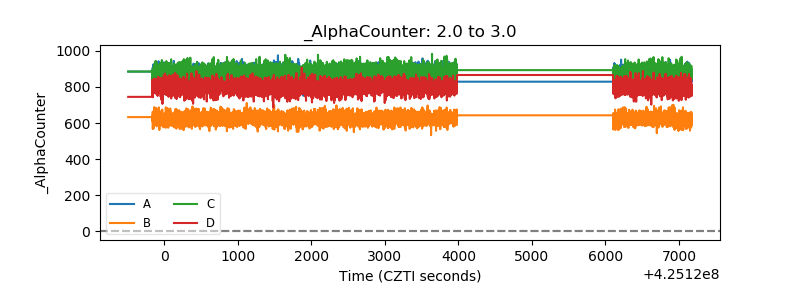 |
| _CPM_Rate | 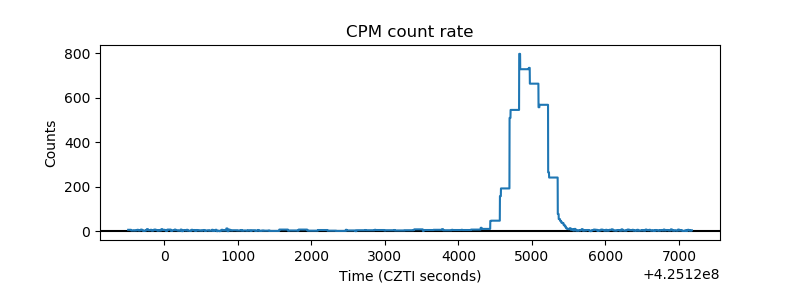 |
| CZT Counter | 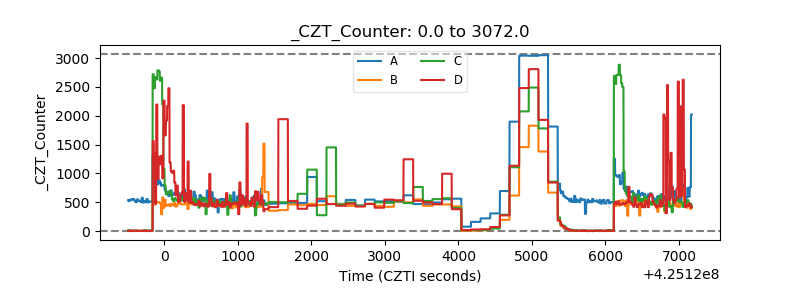 |
| +2.5 Volts monitor | 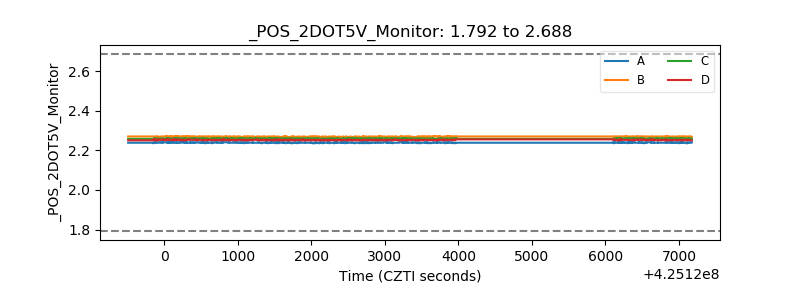 |
| +5 Volts monitor | 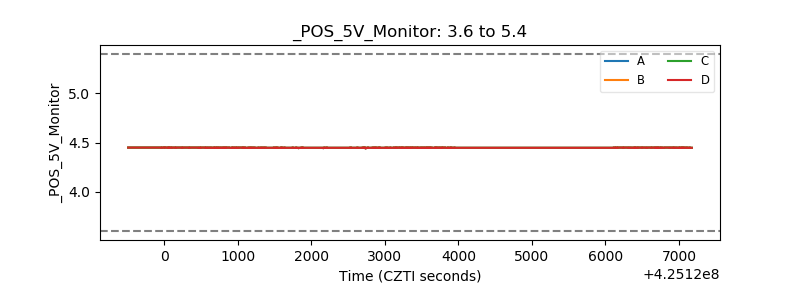 |
| _ROLL_ROT | 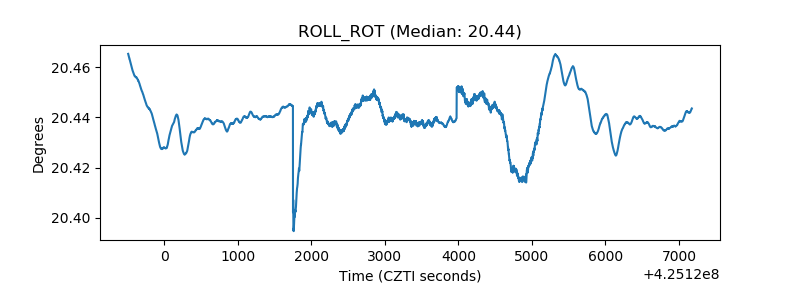 |
| _Roll_DEC | 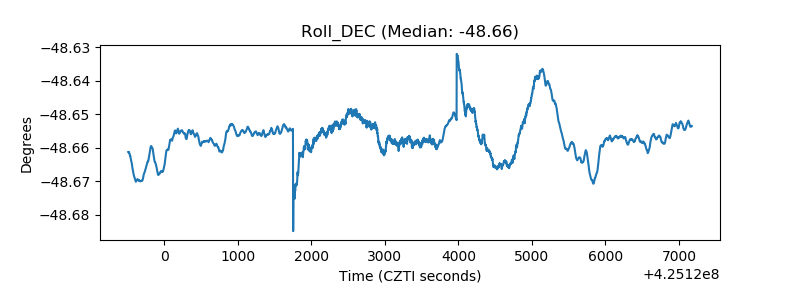 |
| _Roll_RA | 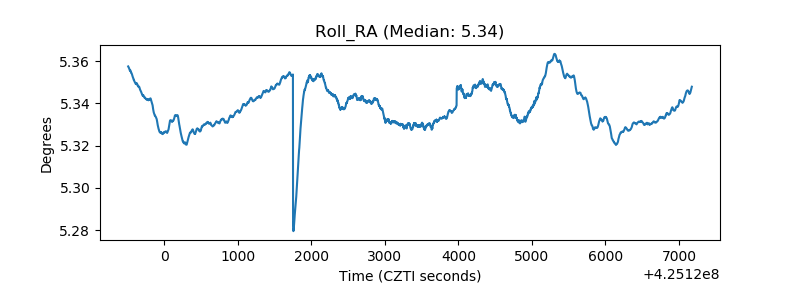 |
| Veto Counter | 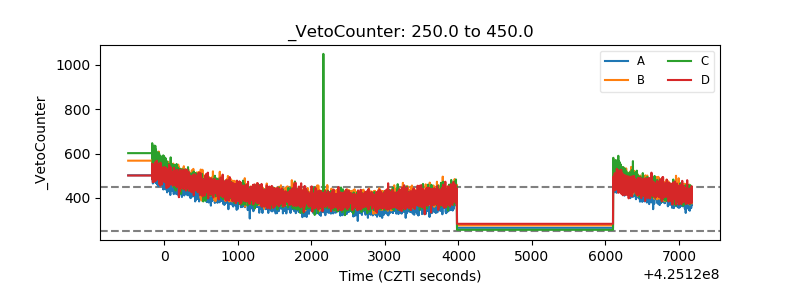 |