| Param | Original file | Final file |
|---|---|---|
| Filename | modeM0/AS1A12_087T01_9000005702_41810cztM0_level2.fits | modeM0/AS1A12_087T01_9000005702_41810cztM0_level2_quad_clean.evt |
| Size (bytes) | 324,357,120 | 87,471,360 |
| Size | 309.3 MB | 83.4 MB |
| Events in quadrant A | 3,181,405 | 591,757 |
| Events in quadrant B | 2,339,423 | 602,659 |
| Events in quadrant C | 3,205,393 | 548,217 |
| Events in quadrant D | 2,871,768 | 538,647 |
| Mode M0 | |||
|---|---|---|---|
| Quadrant | BADHDUFLAG | Total packets | Discarded packets |
| A | 0 | 12636 | 2 |
| B | 0 | 10596 | 2 |
| C | 0 | 12691 | 2 |
| D | 0 | 12054 | 2 |
| Mode SS | |||
|---|---|---|---|
| Quadrant | BADHDUFLAG | Total packets | Discarded packets |
| A | 0 | 108 | 0 |
| B | 0 | 108 | 0 |
| C | 0 | 108 | 0 |
| D | 0 | 108 | 0 |
| Mode M9 | |||
|---|---|---|---|
| Quadrant | BADHDUFLAG | Total packets | Discarded packets |
| A | 0 | 28 | 0 |
| B | 0 | 29 | 0 |
| C | 0 | 29 | 0 |
| D | 0 | 29 | 0 |
| Quadrant | Total seconds | Saturated seconds | Saturation percentage |
|---|---|---|---|
| A | 5244 | 33 | 0.629291% |
| B | 5244 | 4 | 0.076278% |
| C | 5244 | 284 | 5.415713% |
| D | 5244 | 45 | 0.858124% |
Noise dominated data is calculated using 1-second bins in cleaned event files. If a bin has >2000 counts, and if more than 50% of those come from <1% of pixels, then it is considered to be noise-dominated and hence unusable.
| Quadrant | # 1 sec bins | Bins with >0 counts | Bins with >2000 counts | High rate bins dominated by noise | Noise dominated (total time) | Noise dominated (detector-on time) | Marked lightcurve |
|---|---|---|---|---|---|---|---|
| A | 7276 | 5245 | 25 | 25 | 0.34% | 0.48% | 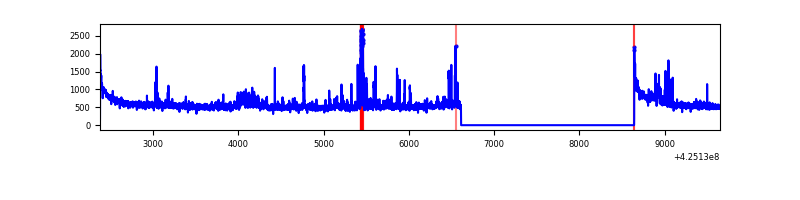 |
| B | 7275 | 5243 | 0 | 0 | 0.00% | 0.00% | 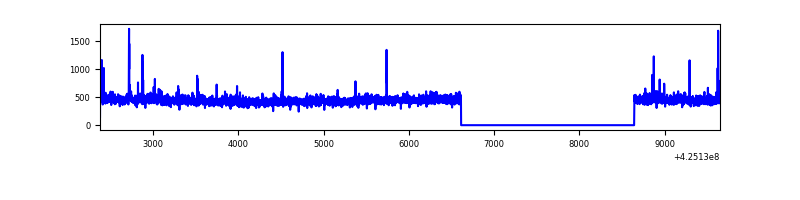 |
| C | 7275 | 5243 | 277 | 277 | 3.81% | 5.28% | 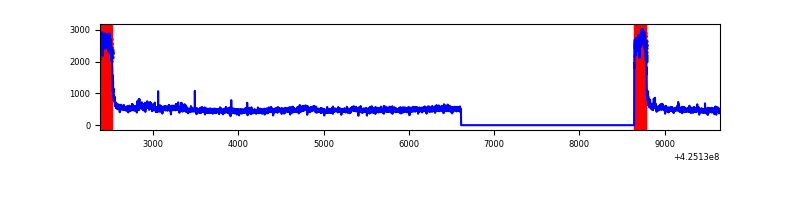 |
| D | 7275 | 5243 | 43 | 43 | 0.59% | 0.82% | 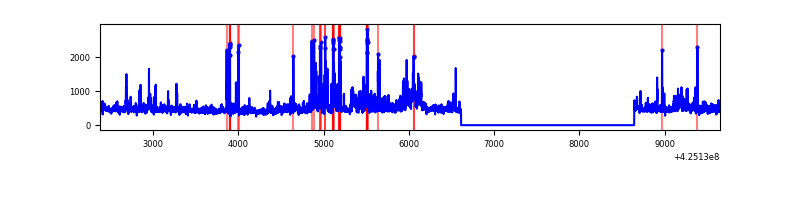 |
Top three noisy pixels from each quadrant. If the there are fewer than three noisy pixels in the level2.evt file, extra rows are filled as -1
| Pixel properties | Quadrant properties | ||||||
|---|---|---|---|---|---|---|---|
| Quadrant | DetID | PixID | Counts | Sigma | Mean | Median | Sigma |
| A | 10 | 83 | 550838 | 4597.09 | 582 | 570 | 119.7 |
| A | 2 | 79 | 206541 | 1720.74 | 582 | 570 | 119.7 |
| A | 15 | 223 | 77411 | 641.95 | 582 | 570 | 119.7 |
| B | 0 | 186 | 24293 | 214.47 | 577 | 560 | 110.7 |
| B | 0 | 183 | 20216 | 177.63 | 577 | 560 | 110.7 |
| B | 4 | 141 | 14262 | 123.82 | 577 | 560 | 110.7 |
| C | 0 | 10 | 889729 | 7034.6 | 540 | 545 | 126.4 |
| C | 15 | 214 | 206416 | 1628.71 | 540 | 545 | 126.4 |
| C | 12 | 249 | 3718 | 25.1 | 540 | 545 | 126.4 |
| D | 13 | 249 | 240859 | 1704.86 | 568 | 552 | 141.0 |
| D | 12 | 79 | 190820 | 1349.86 | 568 | 552 | 141.0 |
| D | 2 | 249 | 182827 | 1293.15 | 568 | 552 | 141.0 |
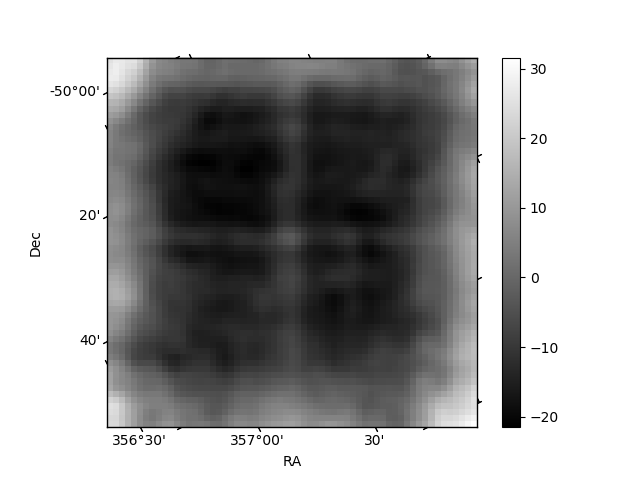
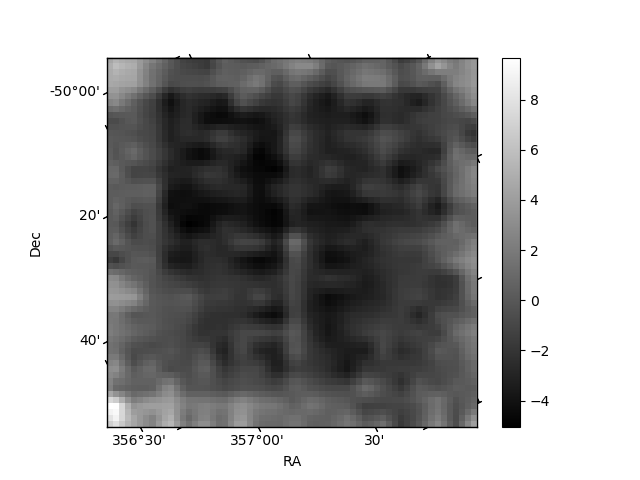
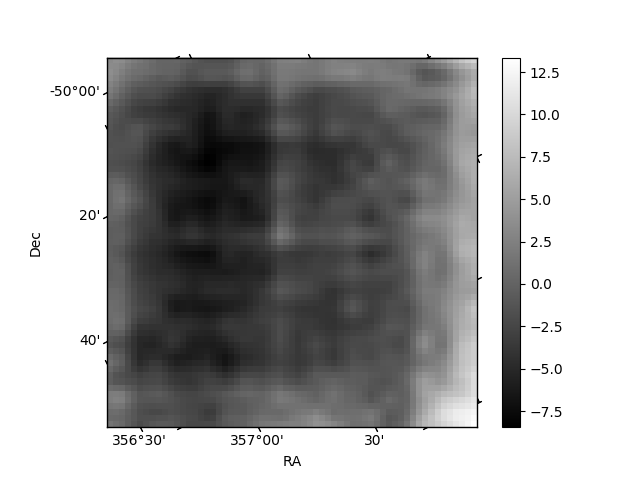
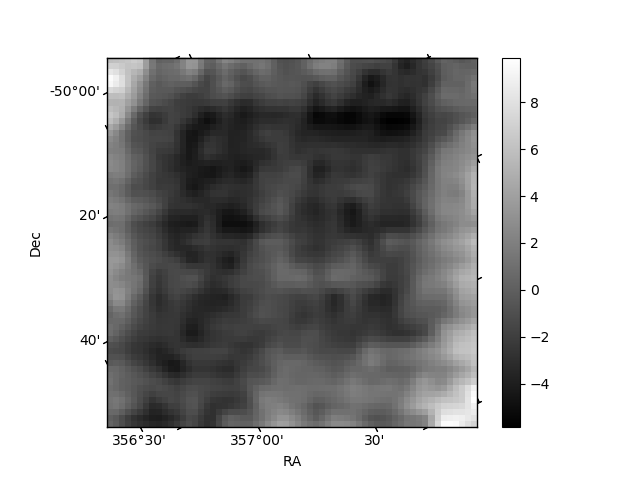
Histogram calculated using DETX and DETY for each event in the final _common_clean file
| Quadrant A | 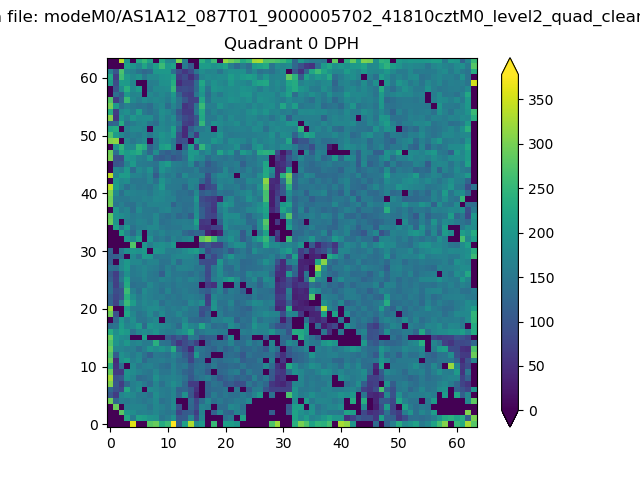 |
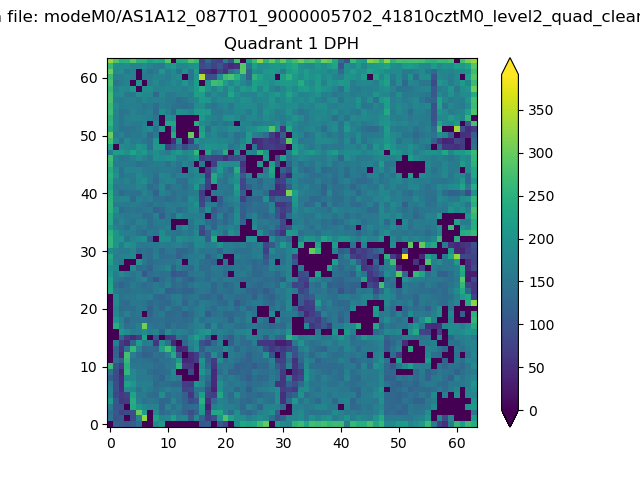 |
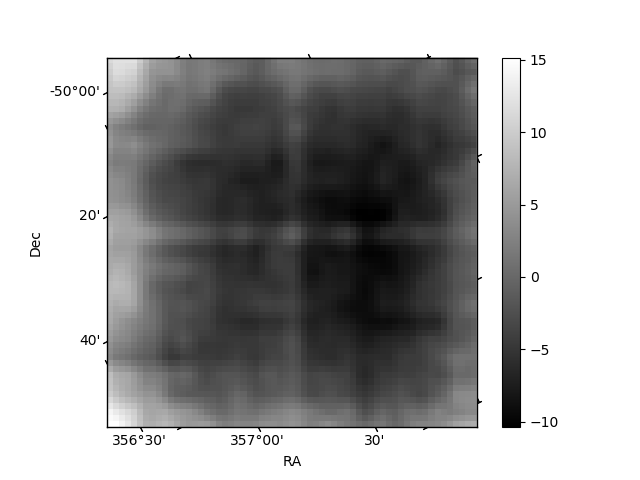
Quadrant B |
|---|---|---|---|
| Quadrant D | 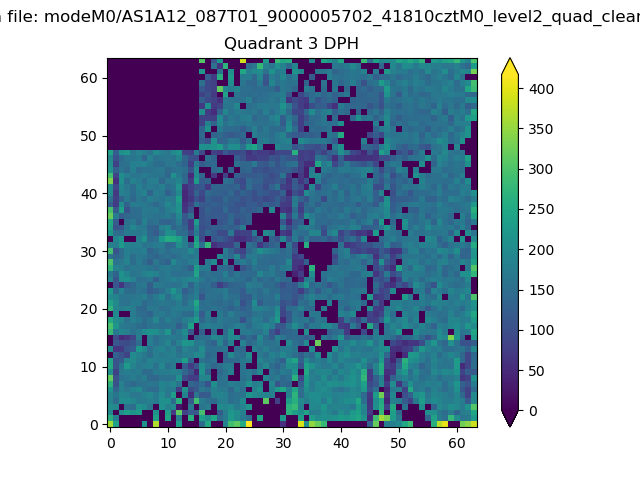 |
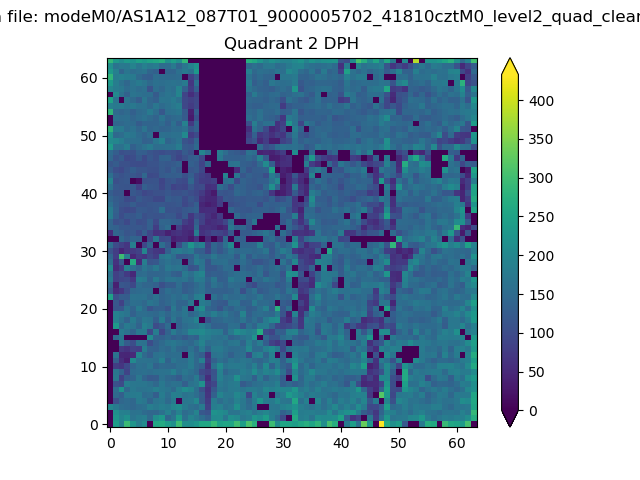 |
Quadrant C |
| Plot type | Count rate plots | Images |
|---|---|---|
| Comparison with Poisson distribution Blue bars denote a histogram of data divided into 1 sec bins. Red curve is a Poisson curve with rate = median count rate of data. |
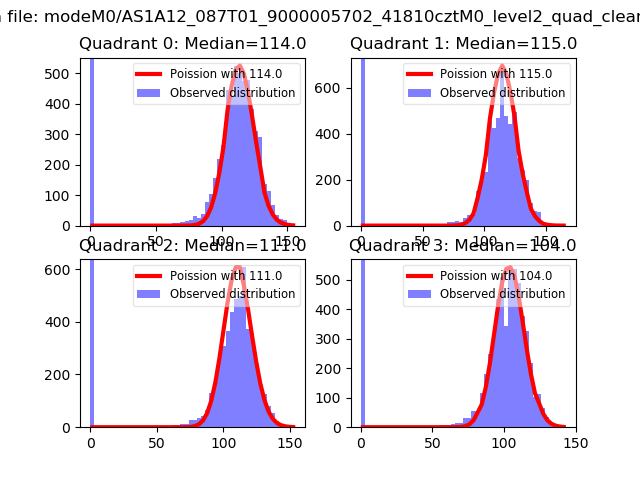 |
 |
| Quadrant-wise count rates Data is divided into 100 sec bins |
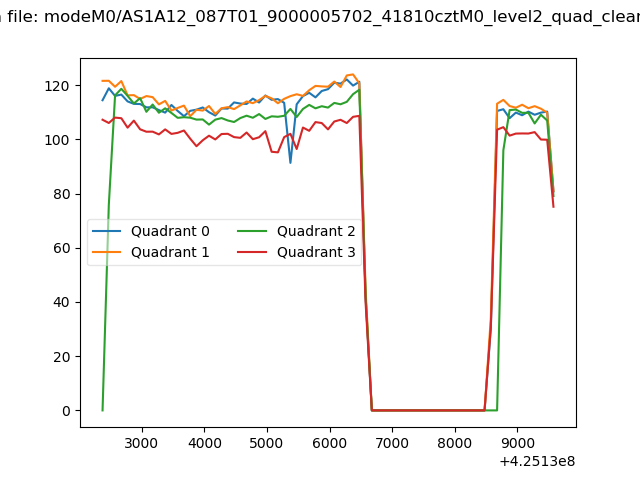 |
|
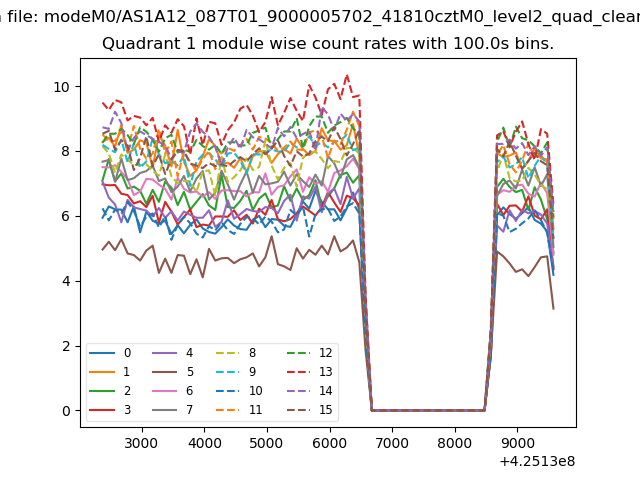
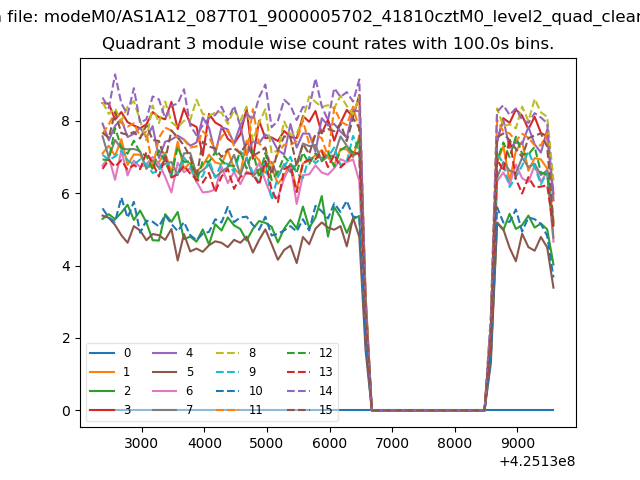
| Module-wise count rates for Quadrant A Data is divided into 100 sec bins |
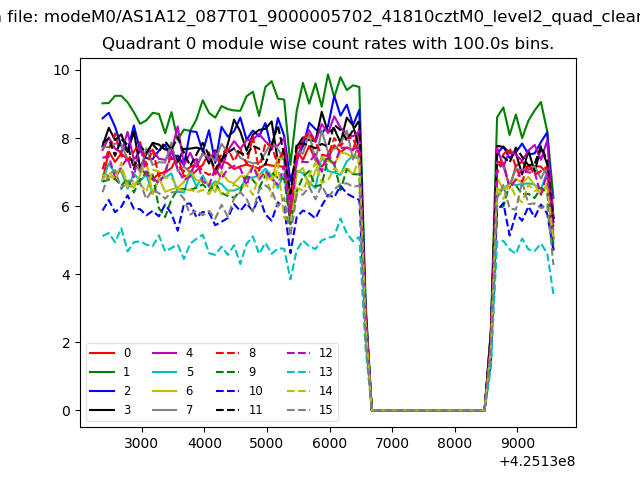 |
 |
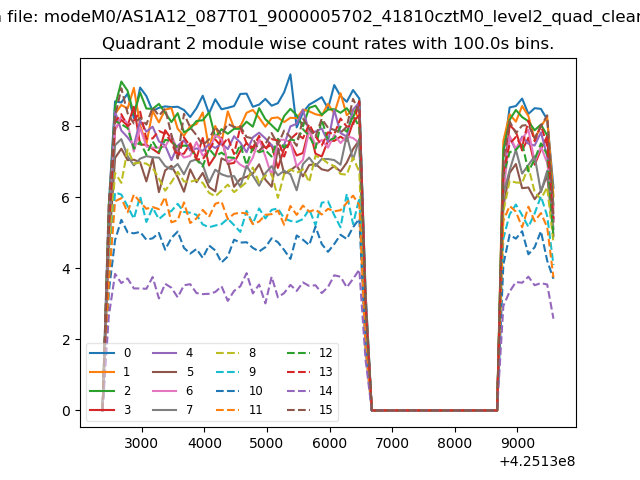
| Module-wise count rates for Quadrant B Data is divided into 100 sec bins |
 |
 |
| Module-wise count rates for Quadrant C Data is divided into 100 sec bins |
 |
 |
| Module-wise count rates for Quadrant D Data is divided into 100 sec bins |
 |
 |
| Parameter | Plot |
|---|---|
| CZT HV Monitor | 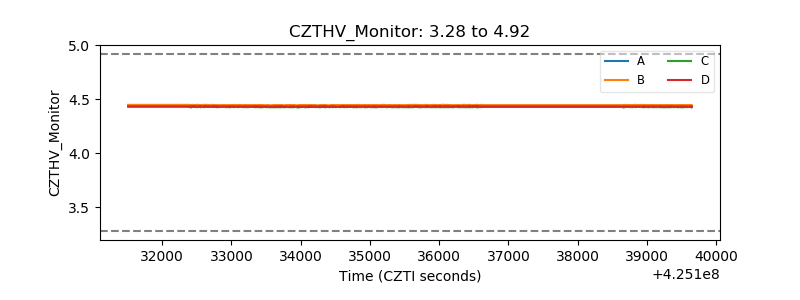 |
| D_VDD | 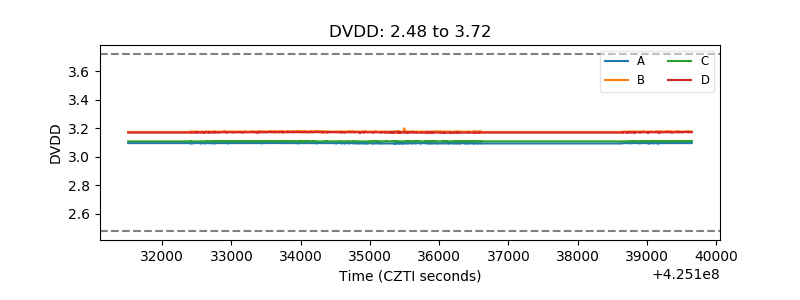 |
| Temperature 1 | 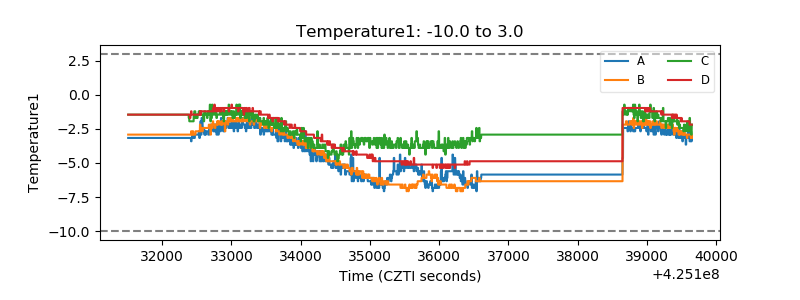 |
| Veto HV Monitor | 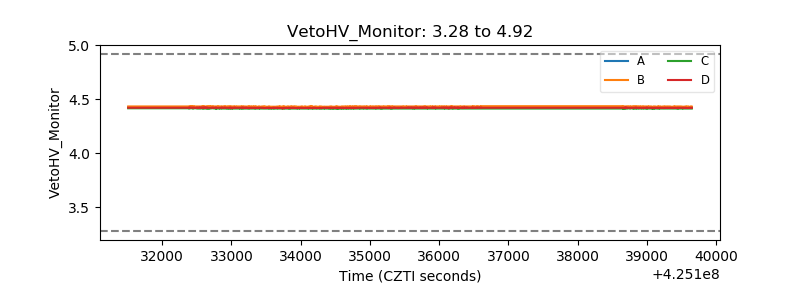 |
| Veto LLD | 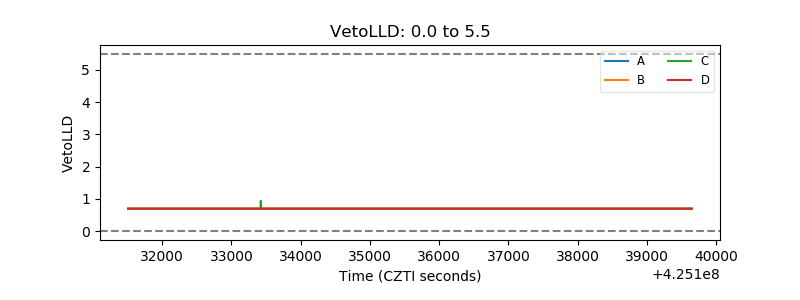 |
| Alpha Counter | 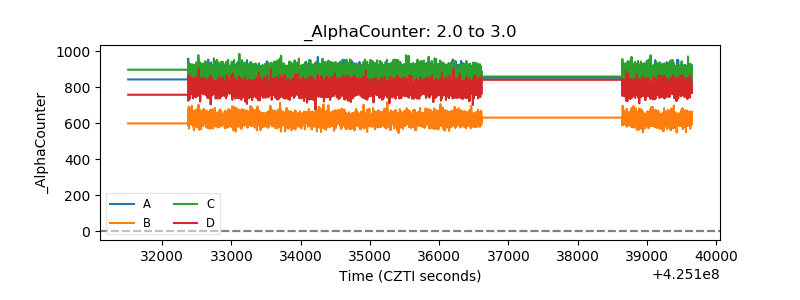 |
| _CPM_Rate | 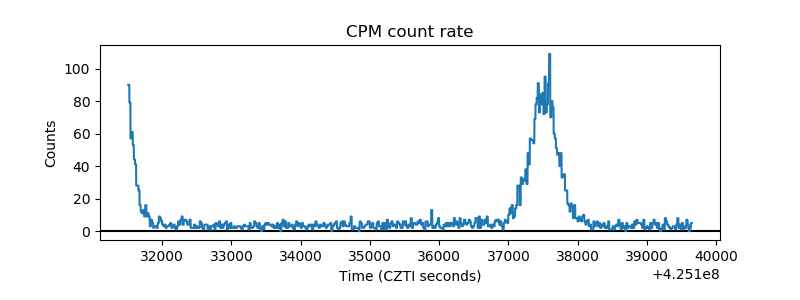 |
| CZT Counter | 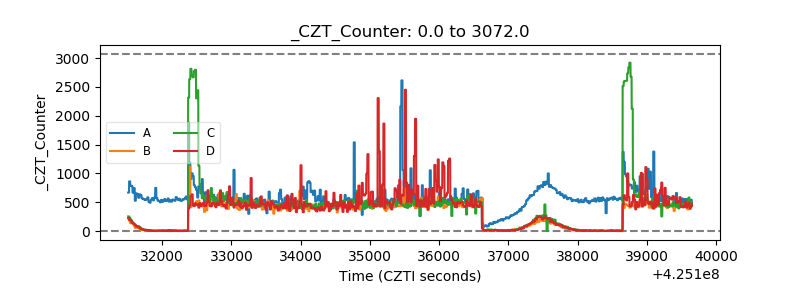 |
| +2.5 Volts monitor | 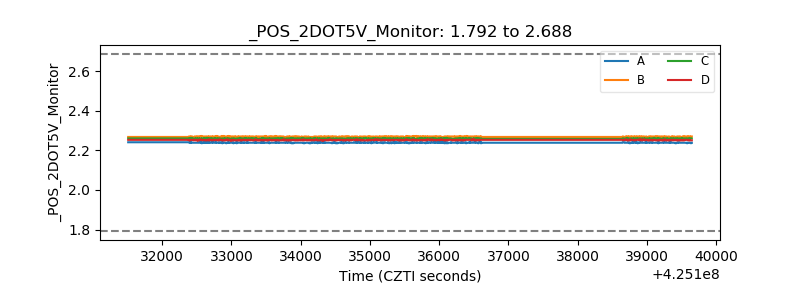 |
| +5 Volts monitor |  |
| _ROLL_ROT | 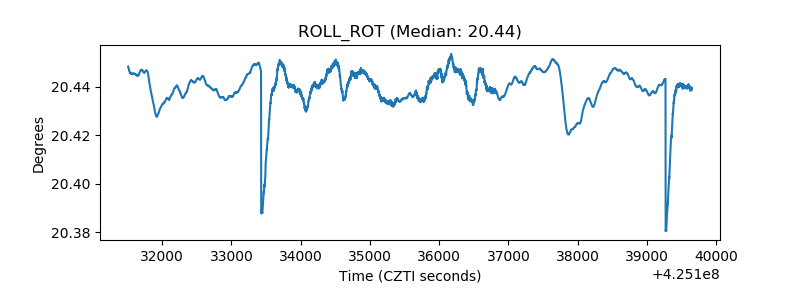 |
| _Roll_DEC | 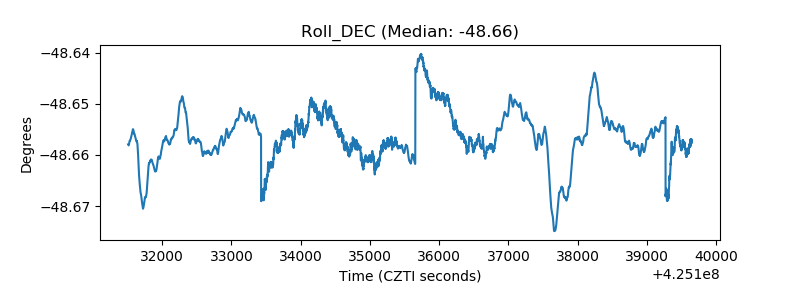 |
| _Roll_RA | 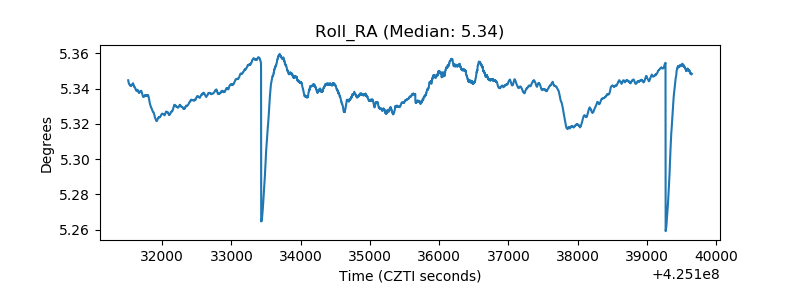 |
| Veto Counter | 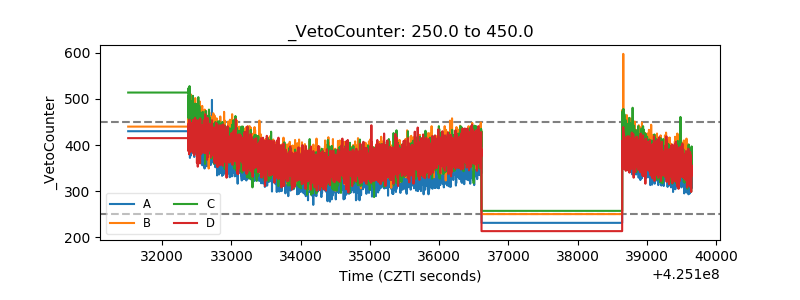 |