| Param | Original file | Final file |
|---|---|---|
| Filename | modeM0/AS1A12_087T01_9000005702_41817cztM0_level2.fits | modeM0/AS1A12_087T01_9000005702_41817cztM0_level2_quad_clean.evt |
| Size (bytes) | 159,603,840 | 41,558,400 |
| Size | 152.2 MB | 39.6 MB |
| Events in quadrant A | 1,529,730 | 280,090 |
| Events in quadrant B | 1,183,667 | 283,890 |
| Events in quadrant C | 1,548,951 | 257,101 |
| Events in quadrant D | 1,442,691 | 252,498 |
| Mode M0 | |||
|---|---|---|---|
| Quadrant | BADHDUFLAG | Total packets | Discarded packets |
| A | 0 | 6109 | 1 |
| B | 0 | 5387 | 1 |
| C | 0 | 6280 | 1 |
| D | 0 | 6078 | 1 |
| Mode SS | |||
|---|---|---|---|
| Quadrant | BADHDUFLAG | Total packets | Discarded packets |
| A | 0 | 52 | 0 |
| B | 0 | 52 | 0 |
| C | 0 | 52 | 0 |
| D | 0 | 52 | 0 |
| Mode M9 | |||
|---|---|---|---|
| Quadrant | BADHDUFLAG | Total packets | Discarded packets |
| A | 1 | 140196792178728 | 140196322476078 |
| B | 1 | -1 | -1 |
| C | 1 | -1 | -1 |
| D | 1 | -1 | -1 |
| Quadrant | Total seconds | Saturated seconds | Saturation percentage |
|---|---|---|---|
| A | 2579 | 20 | 0.775494% |
| B | 2579 | 8 | 0.310198% |
| C | 2579 | 150 | 5.816208% |
| D | 2579 | 71 | 2.753005% |
Noise dominated data is calculated using 1-second bins in cleaned event files. If a bin has >2000 counts, and if more than 50% of those come from <1% of pixels, then it is considered to be noise-dominated and hence unusable.
| Quadrant | # 1 sec bins | Bins with >0 counts | Bins with >2000 counts | High rate bins dominated by noise | Noise dominated (total time) | Noise dominated (detector-on time) | Marked lightcurve |
|---|---|---|---|---|---|---|---|
| A | 2579 | 2579 | 15 | 15 | 0.58% | 0.58% | 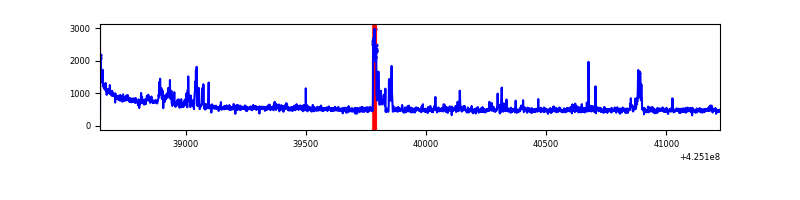 |
| B | 2578 | 2578 | 5 | 5 | 0.19% | 0.19% | 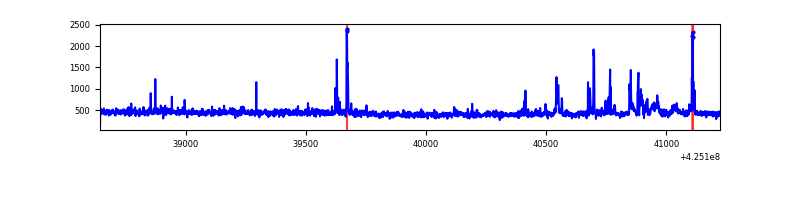 |
| C | 2578 | 2578 | 144 | 144 | 5.59% | 5.59% | 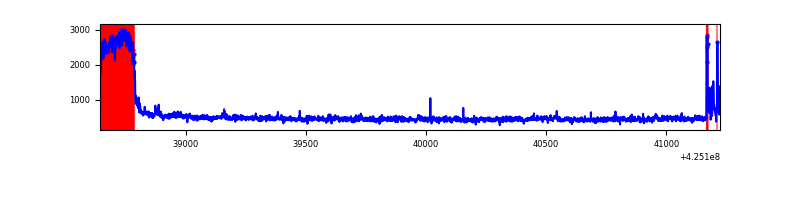 |
| D | 2578 | 2578 | 74 | 74 | 2.87% | 2.87% | 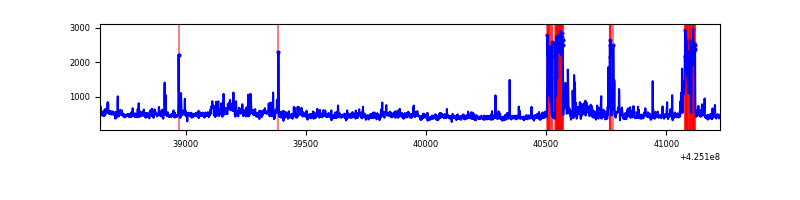 |
Top three noisy pixels from each quadrant. If the there are fewer than three noisy pixels in the level2.evt file, extra rows are filled as -1
| Pixel properties | Quadrant properties | ||||||
|---|---|---|---|---|---|---|---|
| Quadrant | DetID | PixID | Counts | Sigma | Mean | Median | Sigma |
| A | 10 | 83 | 273345 | 4698.21 | 275 | 270 | 58.1 |
| A | 15 | 223 | 138846 | 2384.18 | 275 | 270 | 58.1 |
| A | 12 | 189 | 34040 | 581.01 | 275 | 270 | 58.1 |
| B | 5 | 255 | 77346 | 1409.27 | 273 | 265 | 54.7 |
| B | 0 | 245 | 15321 | 275.27 | 273 | 265 | 54.7 |
| B | 0 | 186 | 13000 | 232.83 | 273 | 265 | 54.7 |
| C | 0 | 10 | 437607 | 7266.45 | 250 | 252 | 60.2 |
| C | 15 | 214 | 100661 | 1668.25 | 250 | 252 | 60.2 |
| C | 15 | 159 | 32638 | 538.08 | 250 | 252 | 60.2 |
| D | 13 | 249 | 245083 | 3727.15 | 263 | 255 | 65.7 |
| D | 12 | 79 | 135371 | 2056.94 | 263 | 255 | 65.7 |
| D | 2 | 234 | 14735 | 220.43 | 263 | 255 | 65.7 |
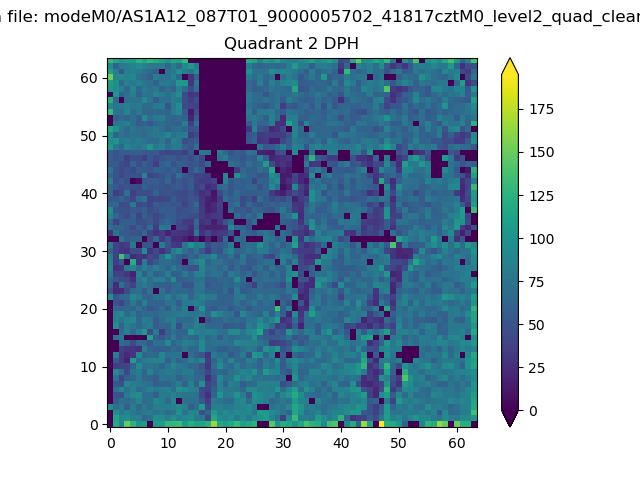
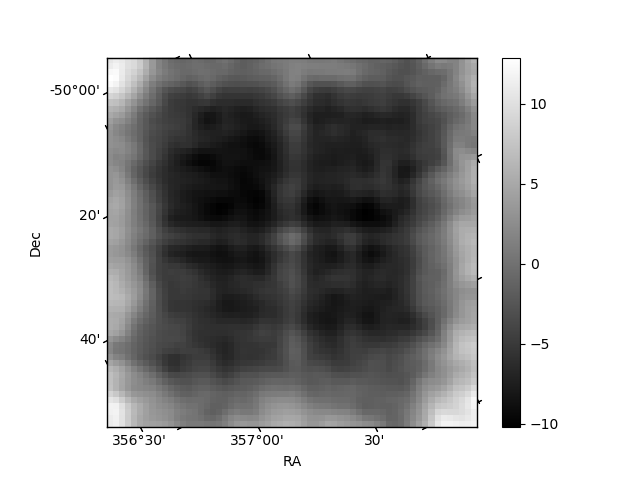
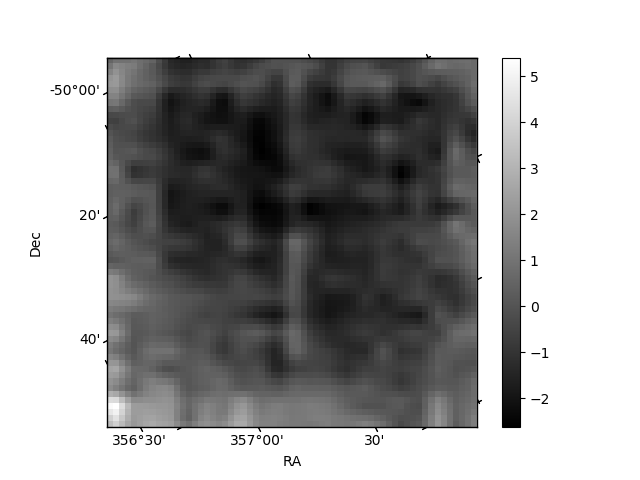
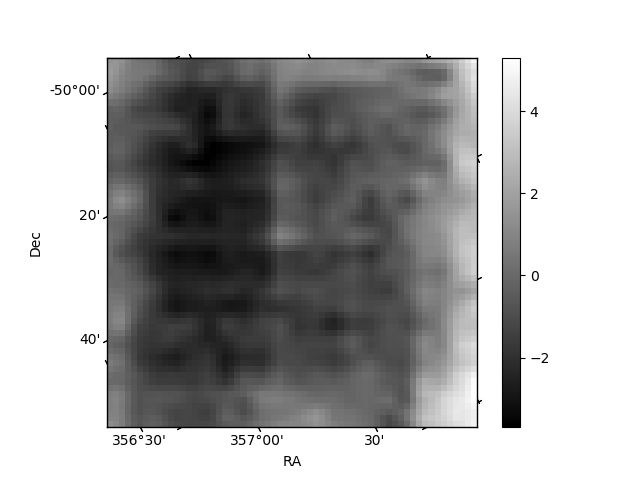
Histogram calculated using DETX and DETY for each event in the final _common_clean file
| Quadrant A | 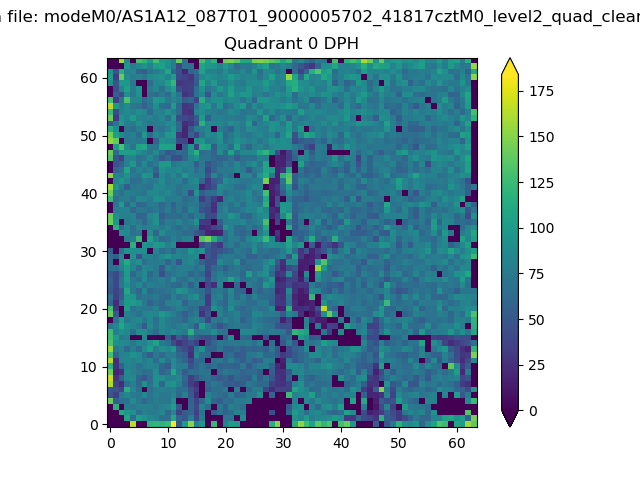 |
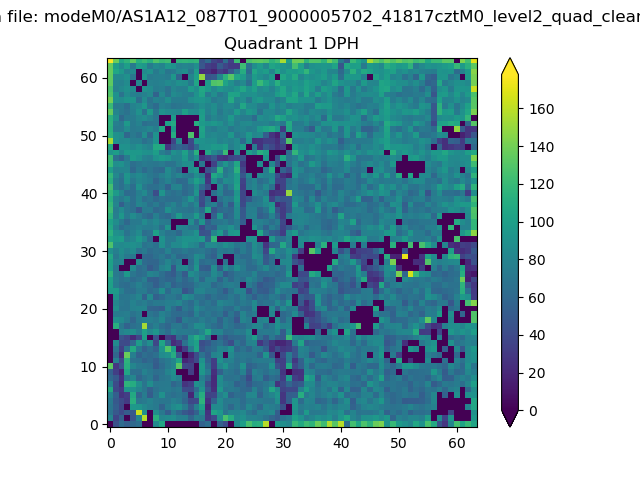 |
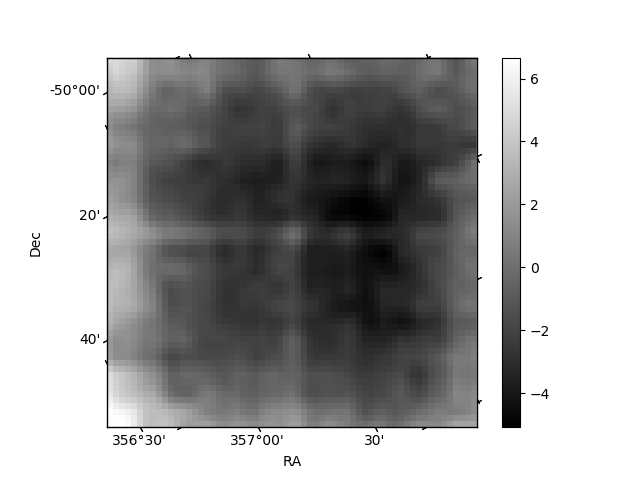
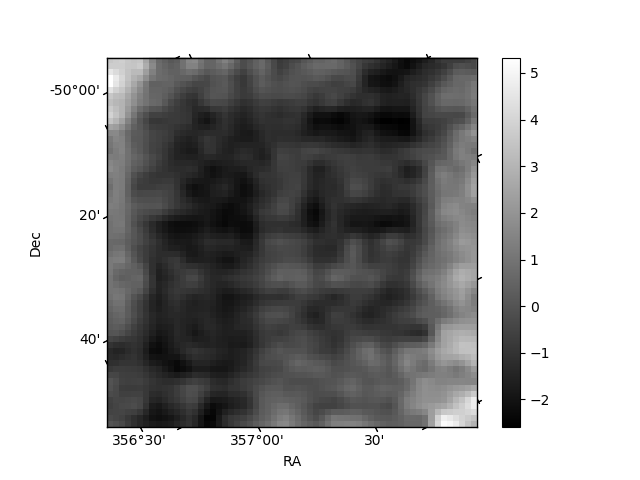
Quadrant B |
|---|---|---|---|
| Quadrant D | 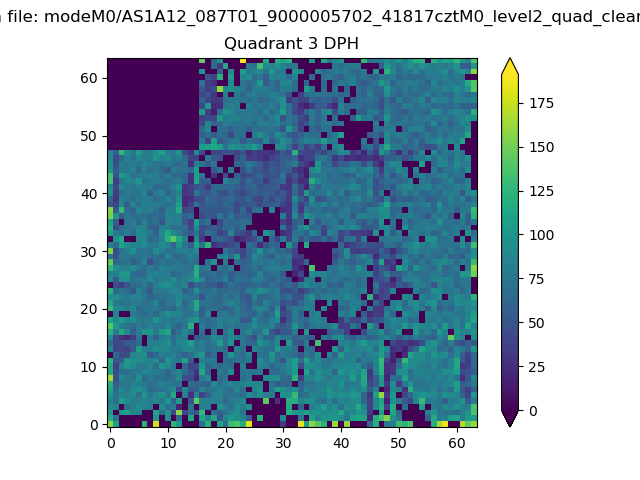 |
 |
Quadrant C |
| Plot type | Count rate plots | Images |
|---|---|---|
| Comparison with Poisson distribution Blue bars denote a histogram of data divided into 1 sec bins. Red curve is a Poisson curve with rate = median count rate of data. |
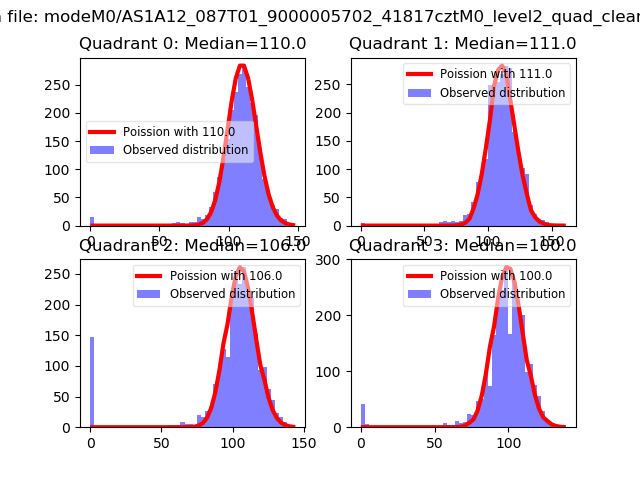 |
 |
| Quadrant-wise count rates Data is divided into 100 sec bins |
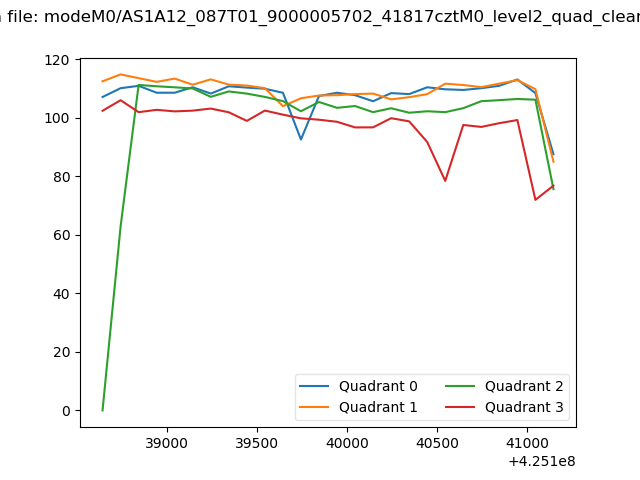 |
|
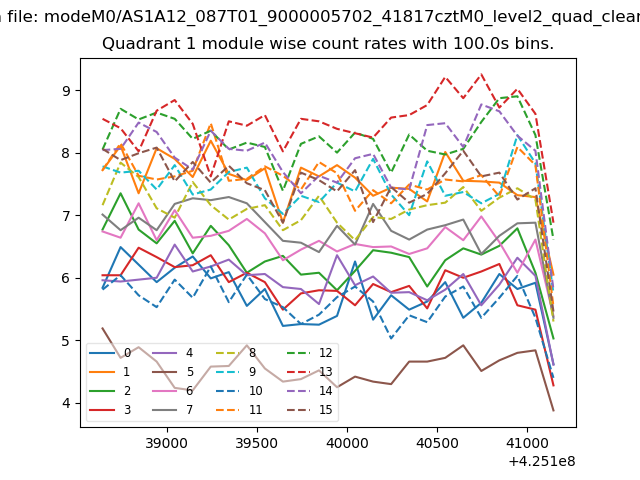
| Module-wise count rates for Quadrant A Data is divided into 100 sec bins |
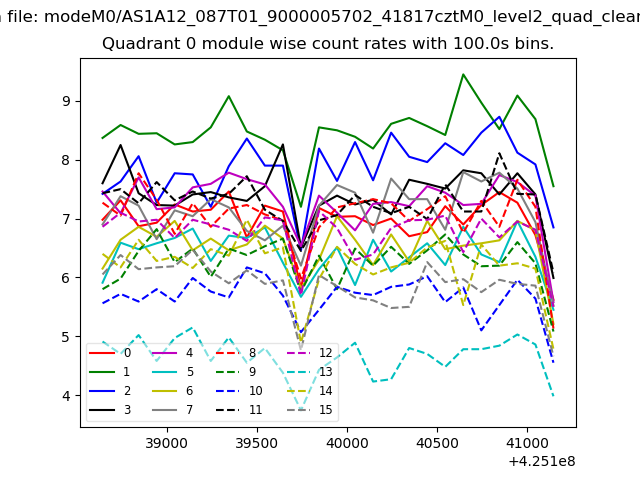 |
 |
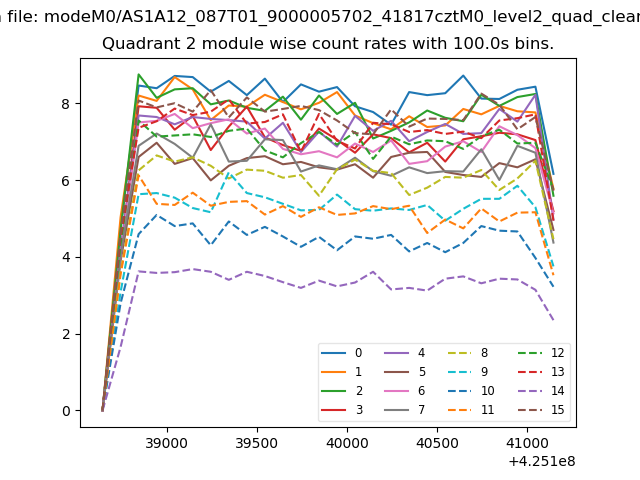
| Module-wise count rates for Quadrant B Data is divided into 100 sec bins |
 |
 |
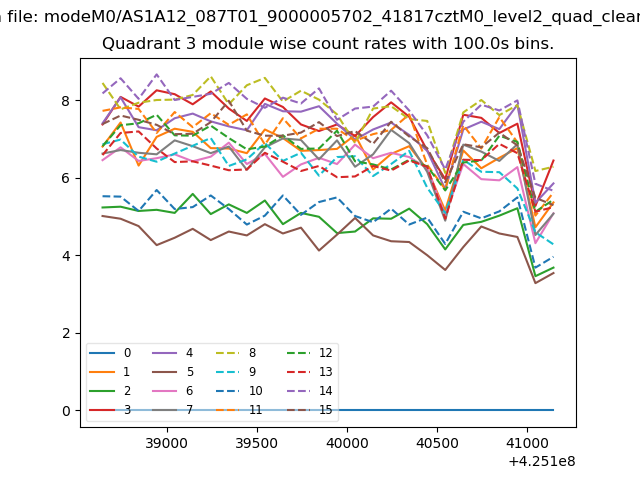
| Module-wise count rates for Quadrant C Data is divided into 100 sec bins |
 |
 |
| Module-wise count rates for Quadrant D Data is divided into 100 sec bins |
 |
 |
| Parameter | Plot |
|---|---|
| CZT HV Monitor | 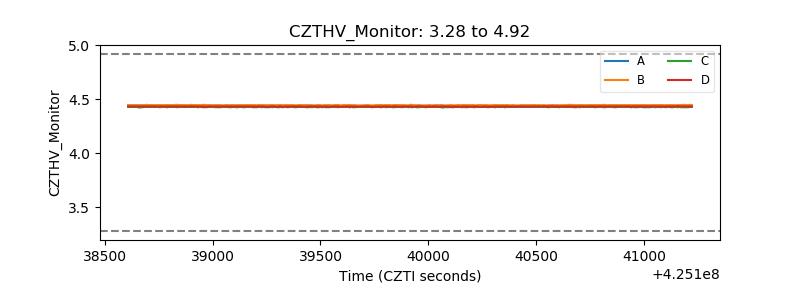 |
| D_VDD | 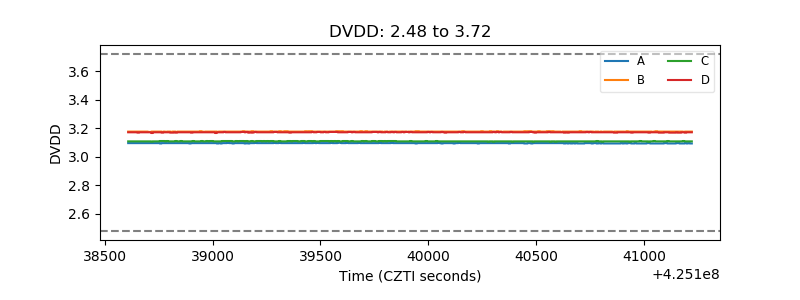 |
| Temperature 1 | 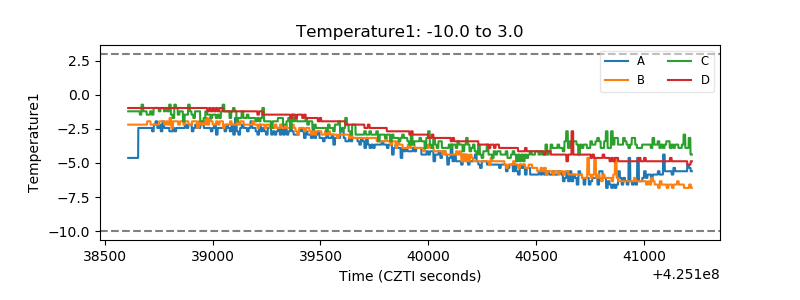 |
| Veto HV Monitor | 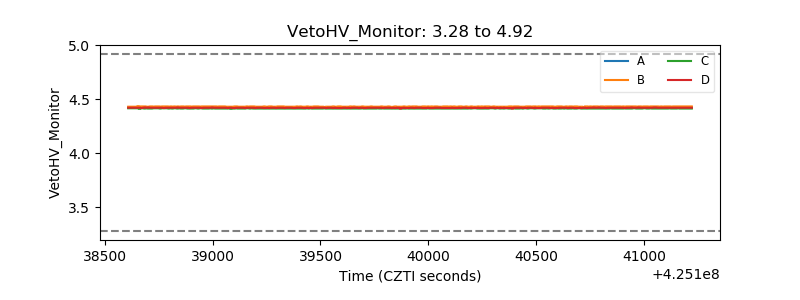 |
| Veto LLD |  |
| Alpha Counter | 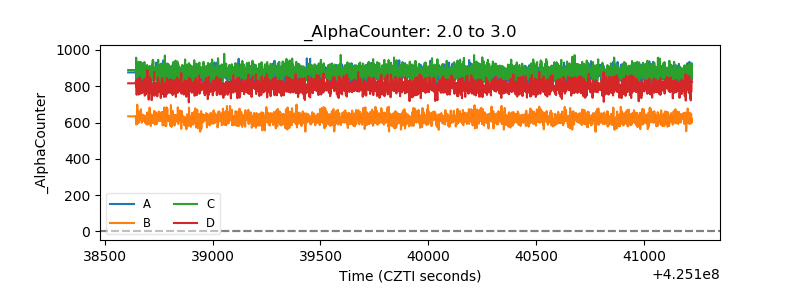 |
| _CPM_Rate | 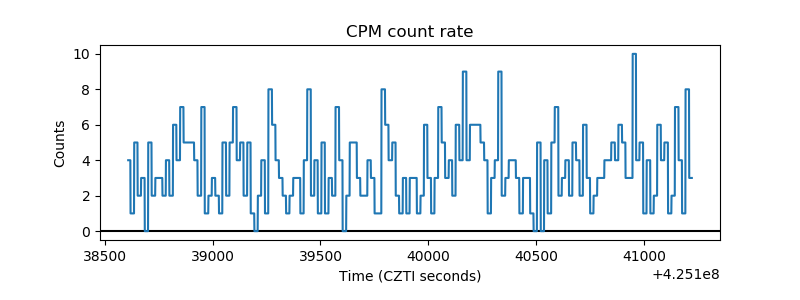 |
| CZT Counter | 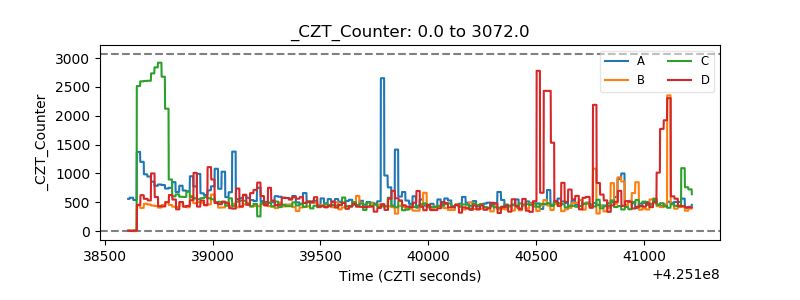 |
| +2.5 Volts monitor | 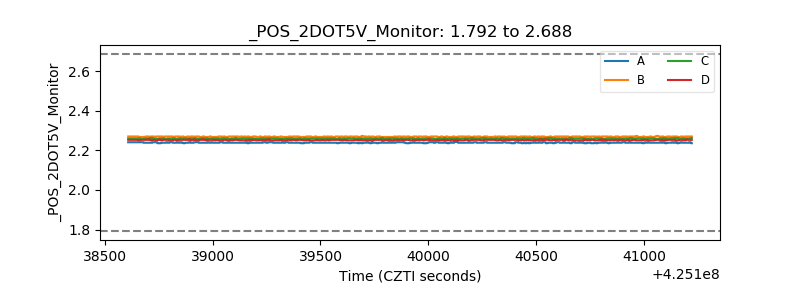 |
| +5 Volts monitor | 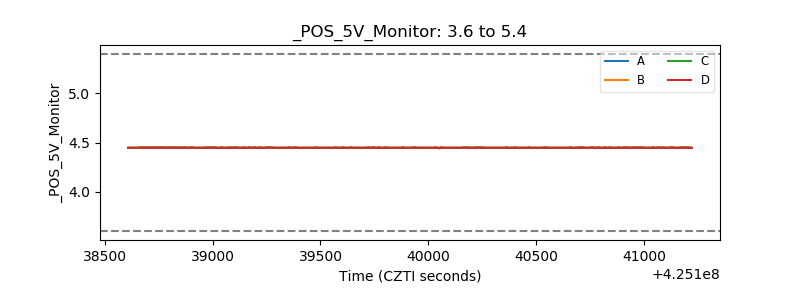 |
| _ROLL_ROT | 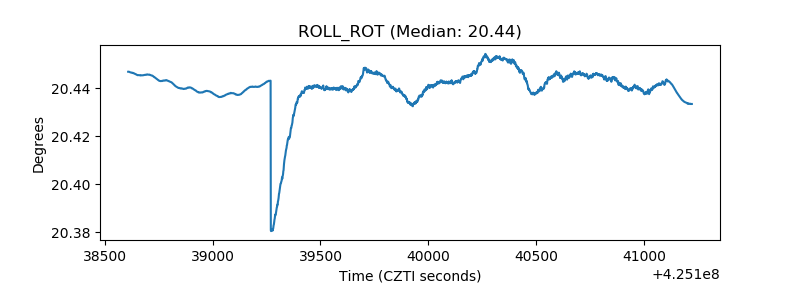 |
| _Roll_DEC | 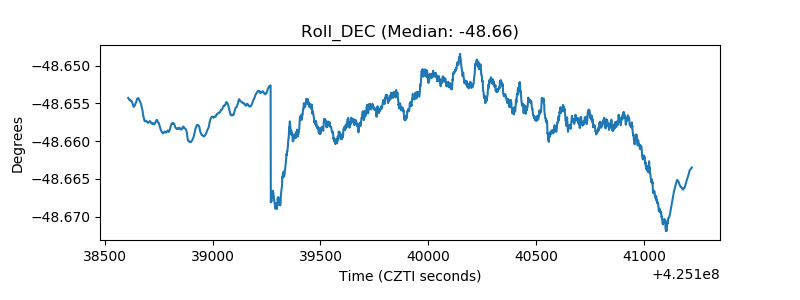 |
| _Roll_RA | 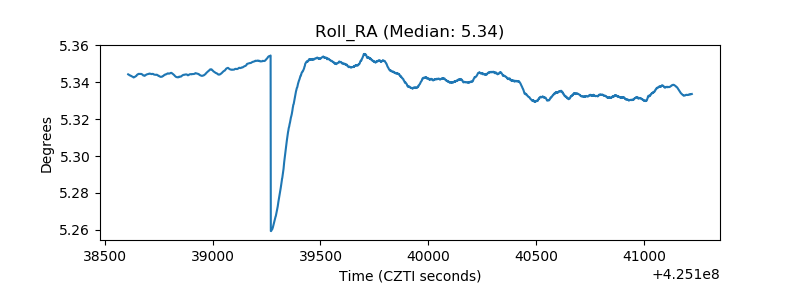 |
| Veto Counter | 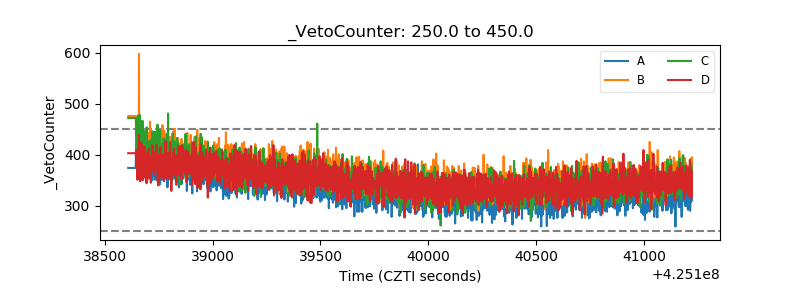 |