| Param | Original file | Final file |
|---|---|---|
| Filename | modeM0/AS1A12_093T02_9000005704_41811cztM0_level2.fits | modeM0/AS1A12_093T02_9000005704_41811cztM0_level2_quad_clean.evt |
| Size (bytes) | 86,351,040 | 21,162,240 |
| Size | 82.4 MB | 20.2 MB |
| Events in quadrant A | 791,346 | 144,304 |
| Events in quadrant B | 611,358 | 146,354 |
| Events in quadrant C | 970,068 | 125,798 |
| Events in quadrant D | 721,621 | 128,656 |
| Mode M9 | |||
|---|---|---|---|
| Quadrant | BADHDUFLAG | Total packets | Discarded packets |
| A | 0 | 18 | 0 |
| B | 0 | 18 | 0 |
| C | 0 | 18 | 0 |
| D | 0 | 18 | 0 |
| Mode M0 | |||
|---|---|---|---|
| Quadrant | BADHDUFLAG | Total packets | Discarded packets |
| A | 0 | 3095 | 1 |
| B | 0 | 2636 | 1 |
| C | 0 | 3573 | 1 |
| D | 0 | 2960 | 2 |
| Mode SS | |||
|---|---|---|---|
| Quadrant | BADHDUFLAG | Total packets | Discarded packets |
| A | 0 | 28 | 0 |
| B | 0 | 28 | 0 |
| C | 0 | 28 | 0 |
| D | 0 | 28 | 0 |
| Quadrant | Total seconds | Saturated seconds | Saturation percentage |
|---|---|---|---|
| A | 1274 | 9 | 0.706436% |
| B | 1274 | 6 | 0.470958% |
| C | 1274 | 128 | 10.047096% |
| D | 1273 | 24 | 1.885310% |
Noise dominated data is calculated using 1-second bins in cleaned event files. If a bin has >2000 counts, and if more than 50% of those come from <1% of pixels, then it is considered to be noise-dominated and hence unusable.
| Quadrant | # 1 sec bins | Bins with >0 counts | Bins with >2000 counts | High rate bins dominated by noise | Noise dominated (total time) | Noise dominated (detector-on time) | Marked lightcurve |
|---|---|---|---|---|---|---|---|
| A | 3035 | 1275 | 4 | 4 | 0.13% | 0.31% | 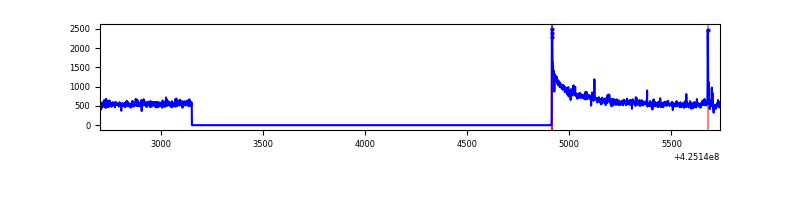 |
| B | 3035 | 1274 | 1 | 1 | 0.03% | 0.08% | 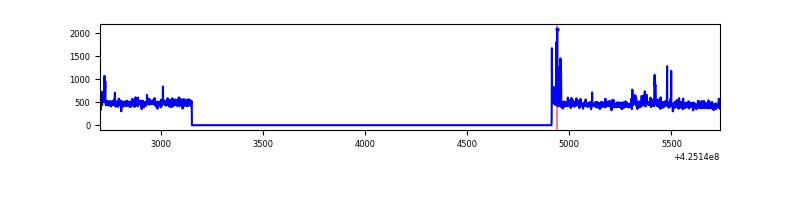 |
| C | 3035 | 1274 | 128 | 128 | 4.22% | 10.05% | 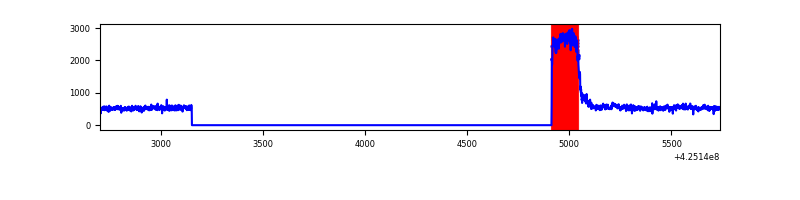 |
| D | 3035 | 1274 | 18 | 18 | 0.59% | 1.41% | 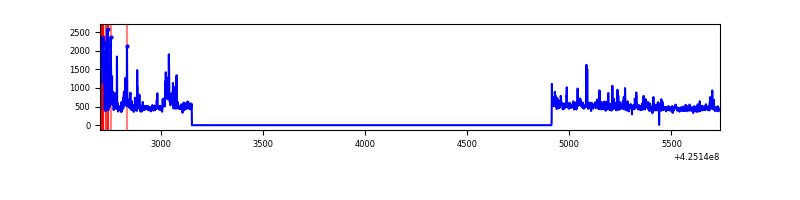 |
Top three noisy pixels from each quadrant. If the there are fewer than three noisy pixels in the level2.evt file, extra rows are filled as -1
| Pixel properties | Quadrant properties | ||||||
|---|---|---|---|---|---|---|---|
| Quadrant | DetID | PixID | Counts | Sigma | Mean | Median | Sigma |
| A | 10 | 83 | 194307 | 5969.65 | 147 | 143 | 32.5 |
| A | 12 | 189 | 11315 | 343.49 | 147 | 143 | 32.5 |
| A | 13 | 248 | 6879 | 207.1 | 147 | 143 | 32.5 |
| B | 4 | 171 | 25186 | 824.39 | 145 | 140 | 30.4 |
| B | 5 | 255 | 6647 | 214.18 | 145 | 140 | 30.4 |
| B | 0 | 186 | 5130 | 164.25 | 145 | 140 | 30.4 |
| C | 0 | 10 | 406404 | 12457.53 | 131 | 131 | 32.6 |
| C | 15 | 214 | 50923 | 1557.43 | 131 | 131 | 32.6 |
| C | 13 | 61 | 886 | 23.15 | 131 | 131 | 32.6 |
| D | 2 | 249 | 102659 | 2754.95 | 143 | 138 | 37.2 |
| D | 12 | 79 | 44380 | 1188.87 | 143 | 138 | 37.2 |
| D | 12 | 218 | 10035 | 265.95 | 143 | 138 | 37.2 |
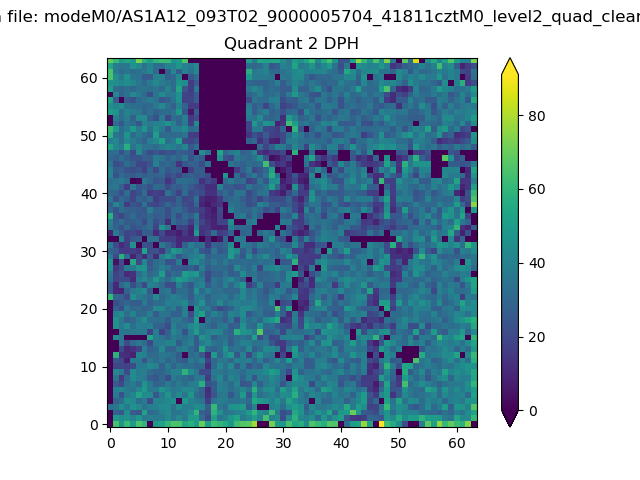
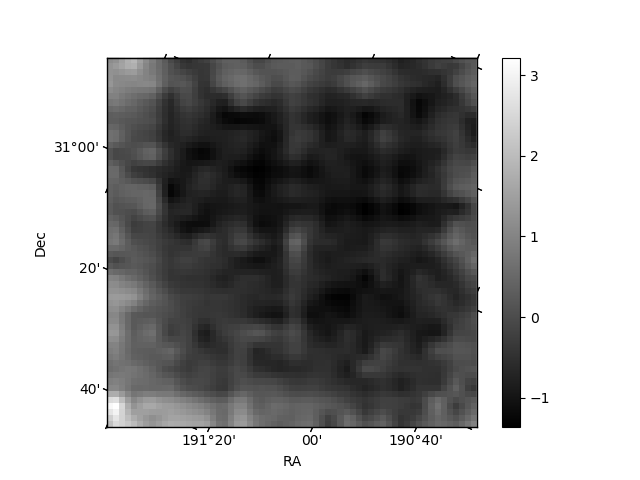
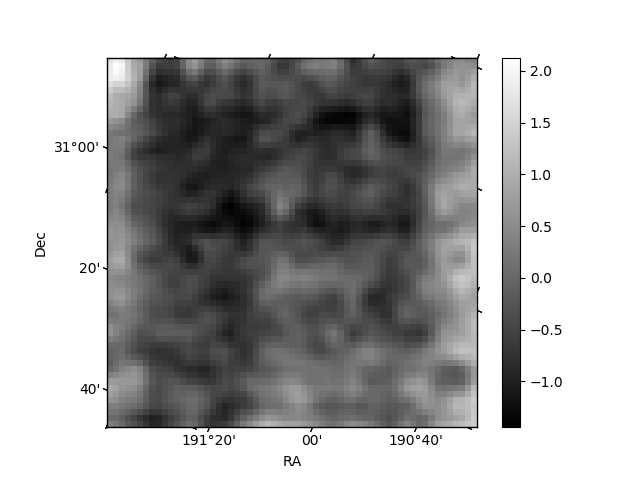
Histogram calculated using DETX and DETY for each event in the final _common_clean file
| Quadrant A |  |
 |
Quadrant B |
|---|---|---|---|
| Quadrant D | 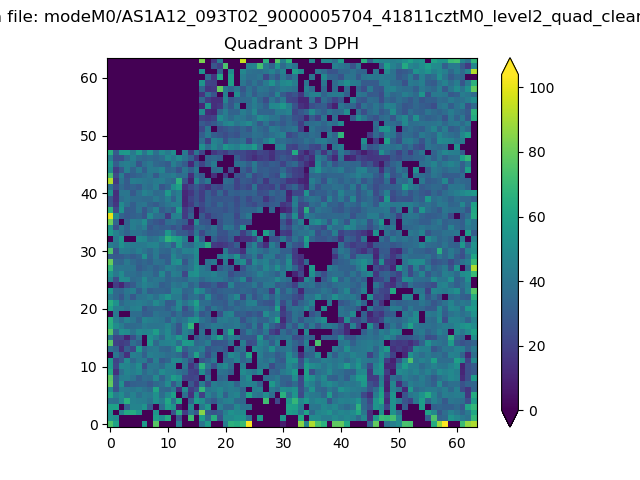 |
 |
Quadrant C |
| Plot type | Count rate plots | Images |
|---|---|---|
| Comparison with Poisson distribution Blue bars denote a histogram of data divided into 1 sec bins. Red curve is a Poisson curve with rate = median count rate of data. |
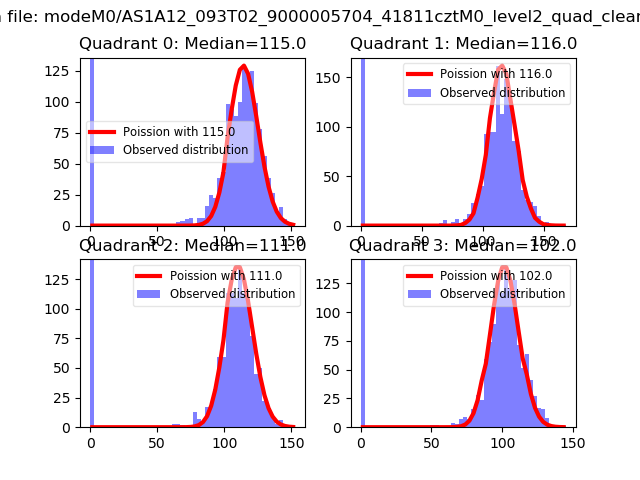 |
 |
| Quadrant-wise count rates Data is divided into 100 sec bins |
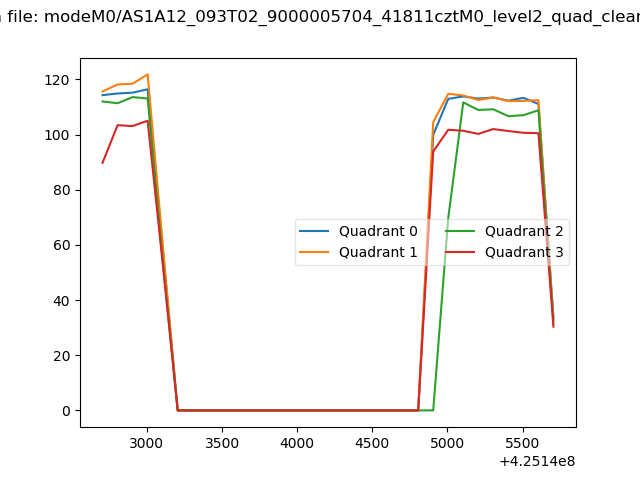 |
|
| Module-wise count rates for Quadrant A Data is divided into 100 sec bins |
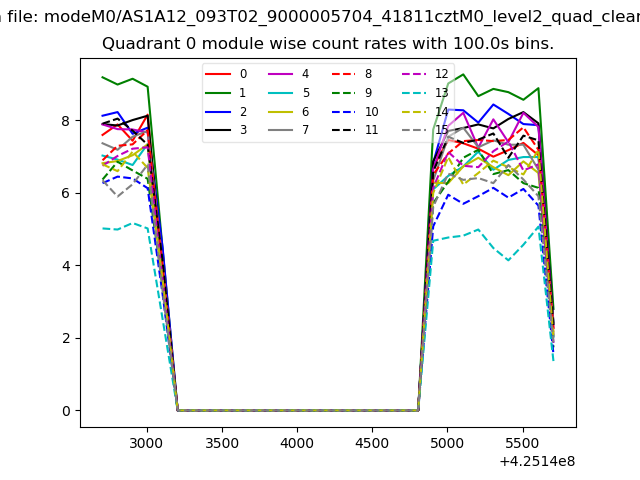 |
 |
| Module-wise count rates for Quadrant B Data is divided into 100 sec bins |
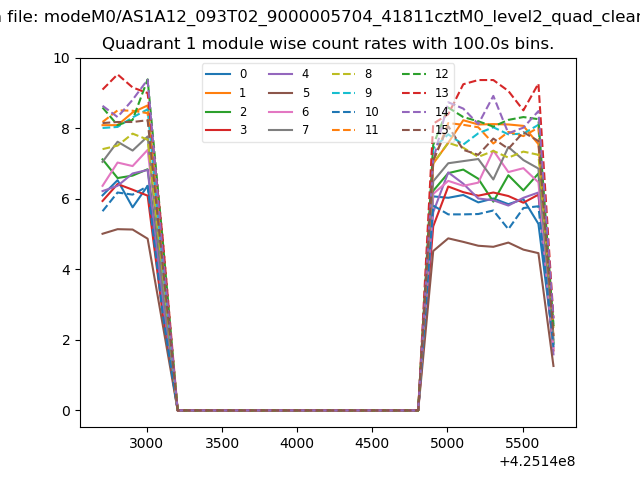 |
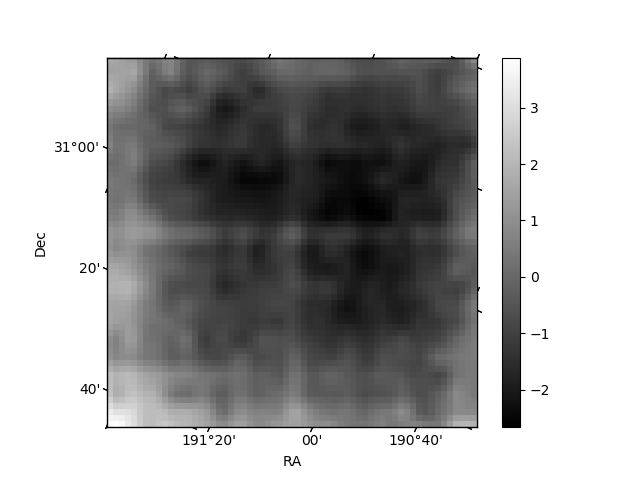 |
| Module-wise count rates for Quadrant C Data is divided into 100 sec bins |
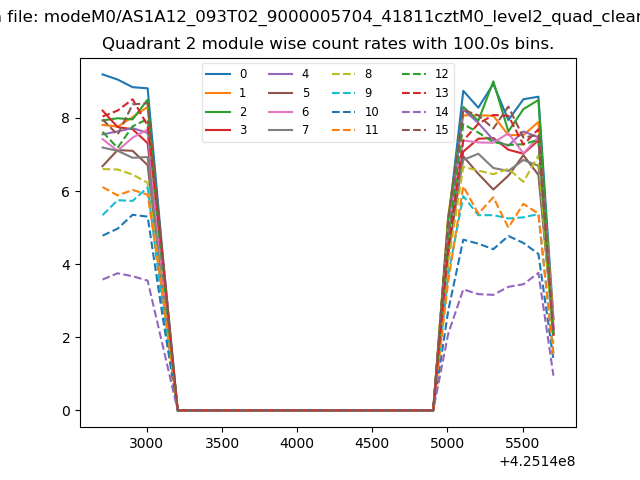 |
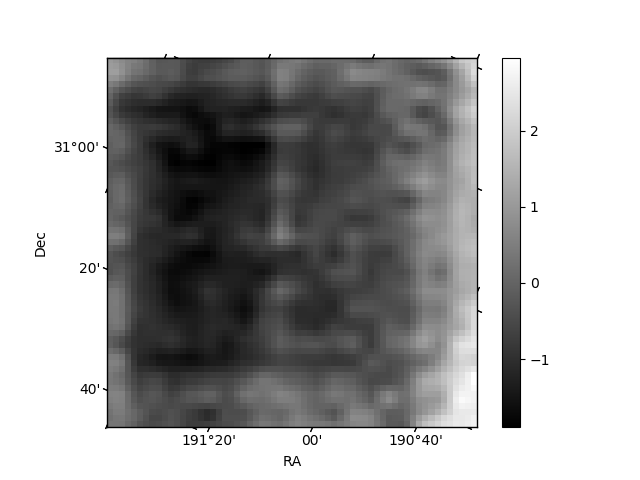 |
| Module-wise count rates for Quadrant D Data is divided into 100 sec bins |
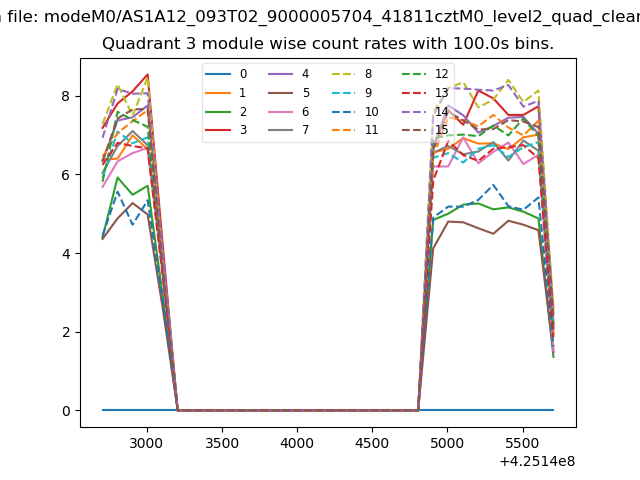 |
 |
| Parameter | Plot |
|---|---|
| CZT HV Monitor | 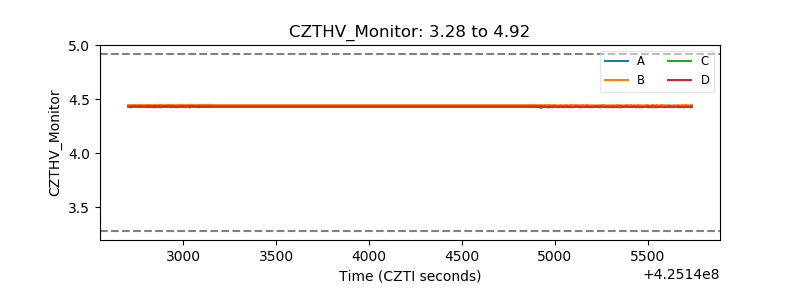 |
| D_VDD | 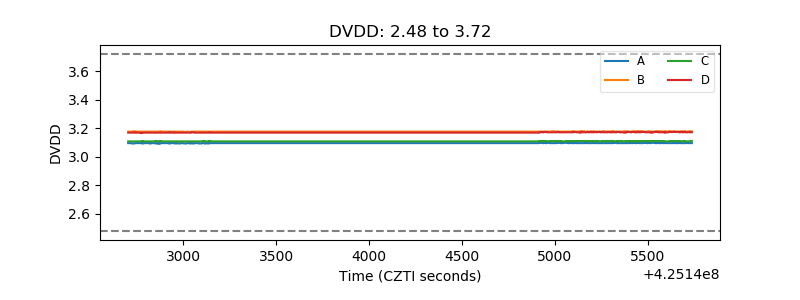 |
| Temperature 1 | 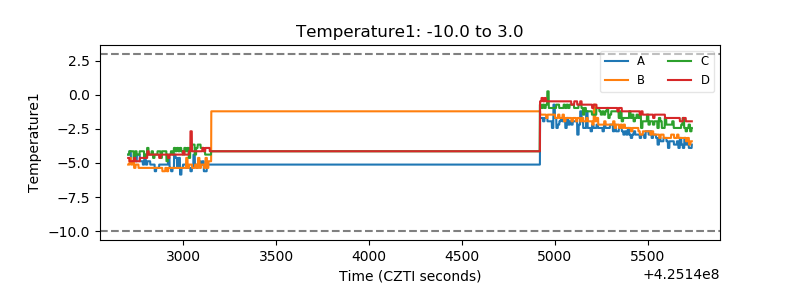 |
| Veto HV Monitor | 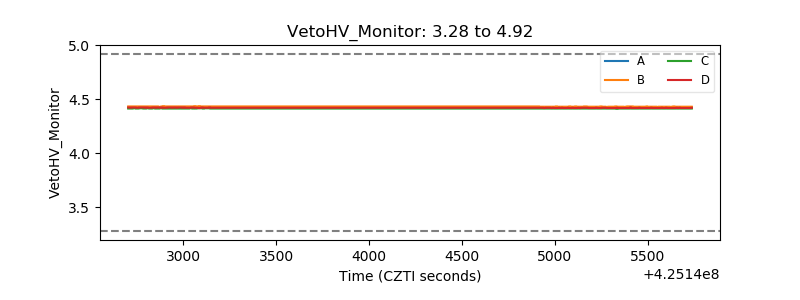 |
| Veto LLD | 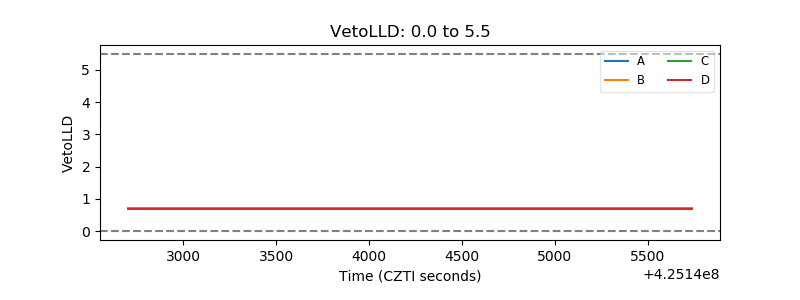 |
| Alpha Counter | 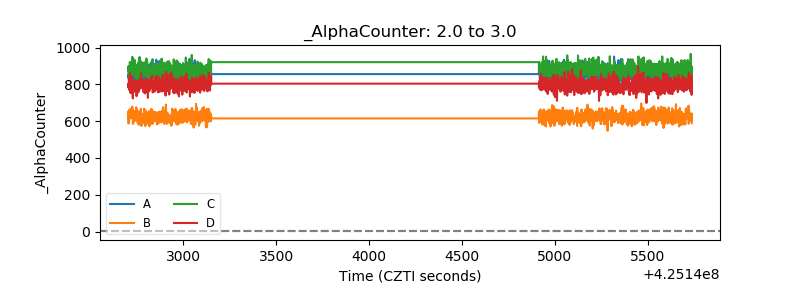 |
| _CPM_Rate |  |
| CZT Counter | 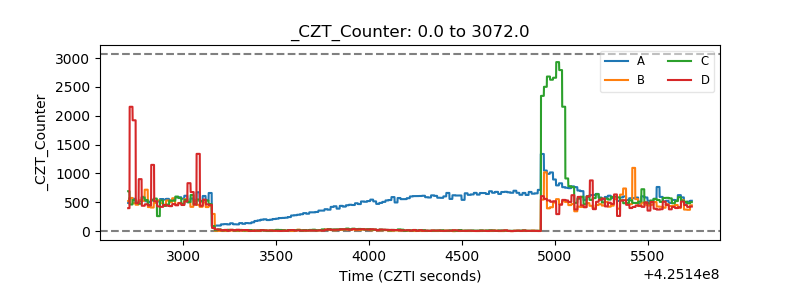 |
| +2.5 Volts monitor |  |
| +5 Volts monitor | 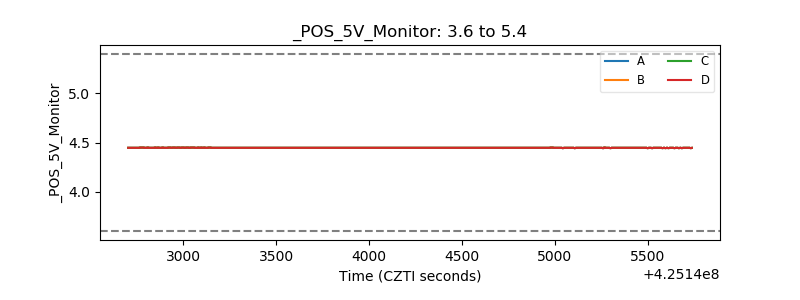 |
| _ROLL_ROT | 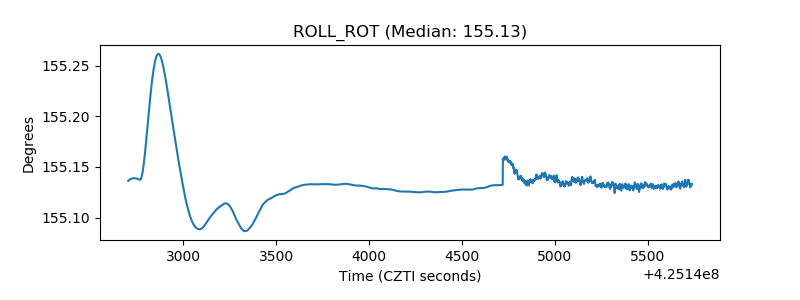 |
| _Roll_DEC |  |
| _Roll_RA | 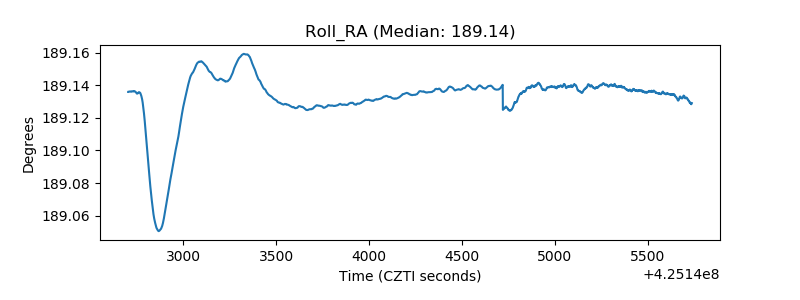 |
| Veto Counter | 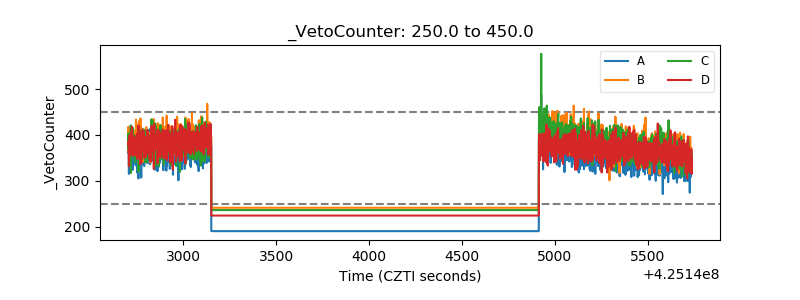 |