| Param | Original file | Final file |
|---|---|---|
| Filename | modeM0/AS1A12_093T02_9000005704_41816cztM0_level2.fits | modeM0/AS1A12_093T02_9000005704_41816cztM0_level2_quad_clean.evt |
| Size (bytes) | 953,881,920 | 248,091,840 |
| Size | 909.7 MB | 236.6 MB |
| Events in quadrant A | 9,353,178 | 1,658,782 |
| Events in quadrant B | 7,154,237 | 1,714,027 |
| Events in quadrant C | 8,776,336 | 1,587,216 |
| Events in quadrant D | 8,810,880 | 1,469,717 |
| Mode M9 | |||
|---|---|---|---|
| Quadrant | BADHDUFLAG | Total packets | Discarded packets |
| A | 0 | 55 | 0 |
| B | 0 | 55 | 0 |
| C | 0 | 55 | 0 |
| D | 0 | 55 | 0 |
| Mode M0 | |||
|---|---|---|---|
| Quadrant | BADHDUFLAG | Total packets | Discarded packets |
| A | 0 | 37736 | 4 |
| B | 0 | 32192 | 4 |
| C | 0 | 35836 | 4 |
| D | 0 | 37774 | 4 |
| Mode SS | |||
|---|---|---|---|
| Quadrant | BADHDUFLAG | Total packets | Discarded packets |
| A | 0 | 322 | 0 |
| B | 0 | 322 | 0 |
| C | 0 | 322 | 0 |
| D | 0 | 322 | 0 |
| Quadrant | Total seconds | Saturated seconds | Saturation percentage |
|---|---|---|---|
| A | 15676 | 256 | 1.633070% |
| B | 15676 | 32 | 0.204134% |
| C | 15677 | 477 | 3.042674% |
| D | 15677 | 570 | 3.635900% |
Noise dominated data is calculated using 1-second bins in cleaned event files. If a bin has >2000 counts, and if more than 50% of those come from <1% of pixels, then it is considered to be noise-dominated and hence unusable.
| Quadrant | # 1 sec bins | Bins with >0 counts | Bins with >2000 counts | High rate bins dominated by noise | Noise dominated (total time) | Noise dominated (detector-on time) | Marked lightcurve |
|---|---|---|---|---|---|---|---|
| A | 21167 | 15680 | 188 | 188 | 0.89% | 1.20% | 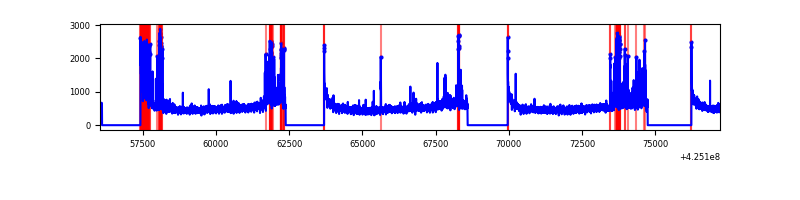 |
| B | 21167 | 15676 | 1 | 1 | 0.00% | 0.01% | 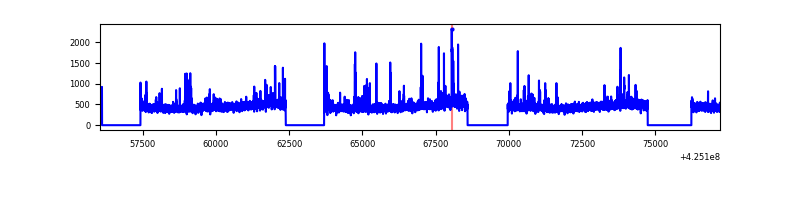 |
| C | 21168 | 15677 | 479 | 479 | 2.26% | 3.06% | 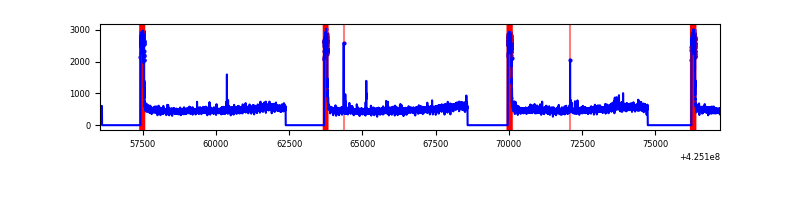 |
| D | 21168 | 15678 | 525 | 525 | 2.48% | 3.35% | 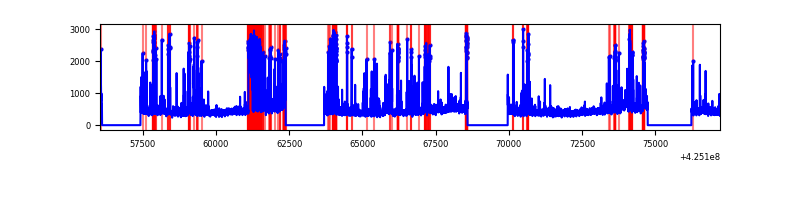 |
Top three noisy pixels from each quadrant. If the there are fewer than three noisy pixels in the level2.evt file, extra rows are filled as -1
| Pixel properties | Quadrant properties | ||||||
|---|---|---|---|---|---|---|---|
| Quadrant | DetID | PixID | Counts | Sigma | Mean | Median | Sigma |
| A | 10 | 83 | 1410303 | 3989.7 | 1722 | 1686 | 353.1 |
| A | 14 | 24 | 1020637 | 2886.02 | 1722 | 1686 | 353.1 |
| A | 12 | 189 | 169509 | 475.33 | 1722 | 1686 | 353.1 |
| B | 4 | 171 | 216760 | 642.45 | 1718 | 1668 | 334.8 |
| B | 0 | 245 | 66058 | 192.32 | 1718 | 1668 | 334.8 |
| B | 12 | 111 | 43558 | 125.12 | 1718 | 1668 | 334.8 |
| C | 0 | 10 | 1691828 | 4374.1 | 1647 | 1655 | 386.4 |
| C | 15 | 214 | 624931 | 1613.02 | 1647 | 1655 | 386.4 |
| C | 14 | 254 | 23308 | 56.04 | 1647 | 1655 | 386.4 |
| D | 13 | 249 | 1705244 | 4185.12 | 1654 | 1608 | 407.1 |
| D | 2 | 249 | 339060 | 828.98 | 1654 | 1608 | 407.1 |
| D | 12 | 79 | 186983 | 455.39 | 1654 | 1608 | 407.1 |
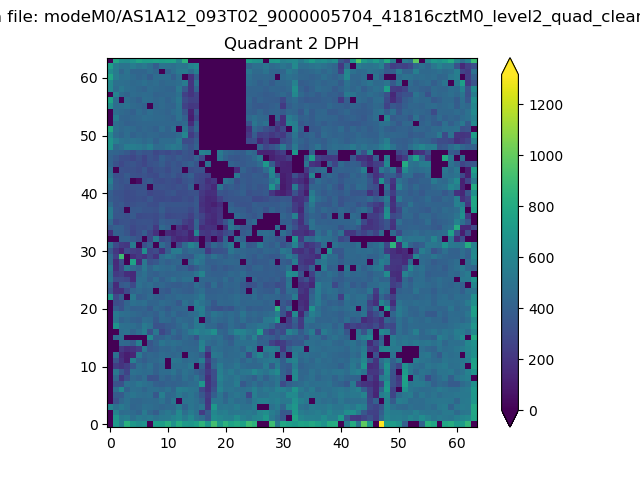
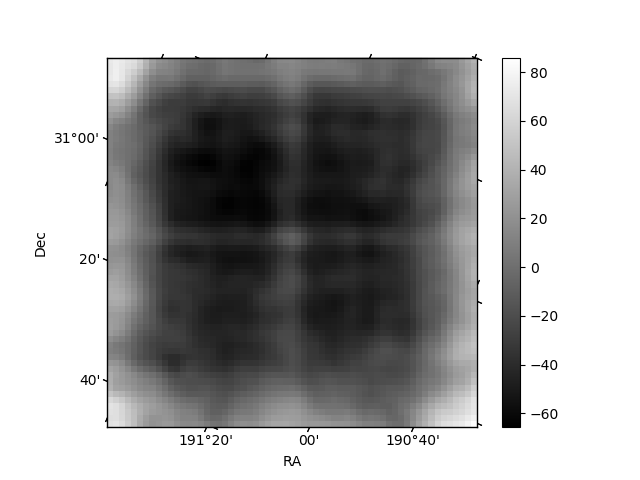
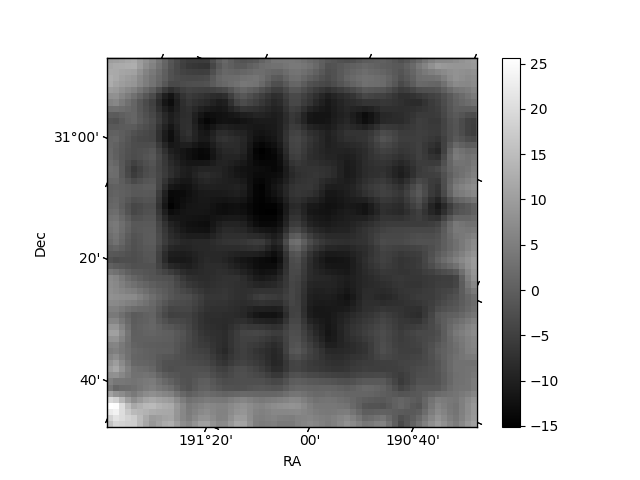
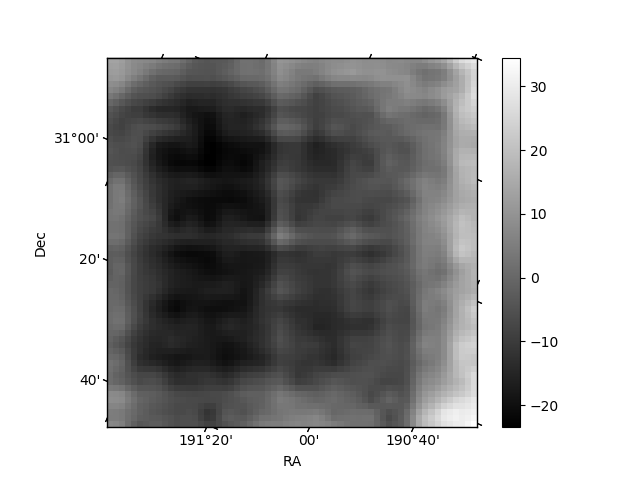
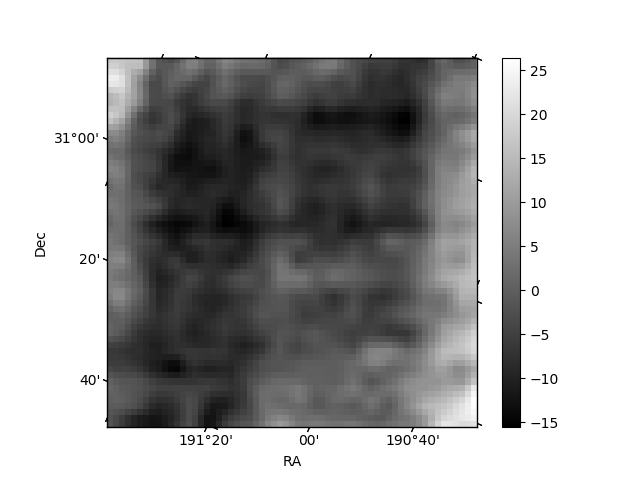
Histogram calculated using DETX and DETY for each event in the final _common_clean file
| Quadrant A | 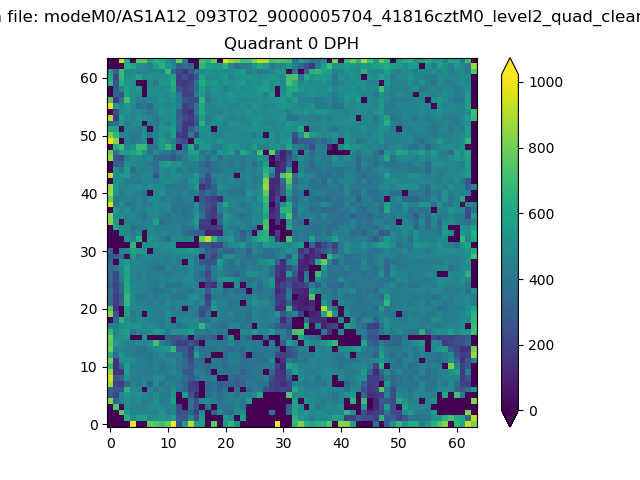 |
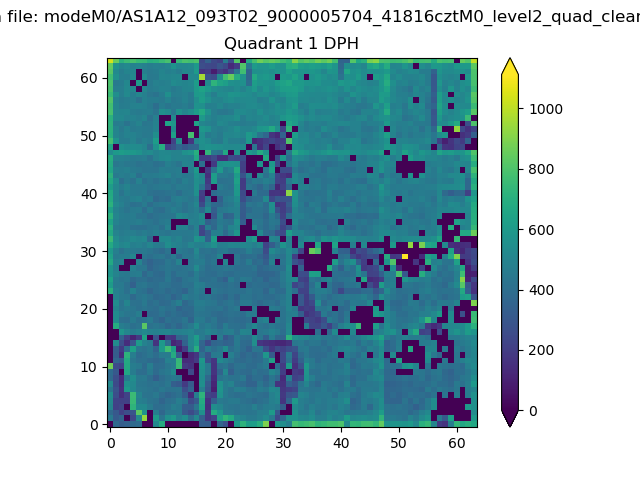 |
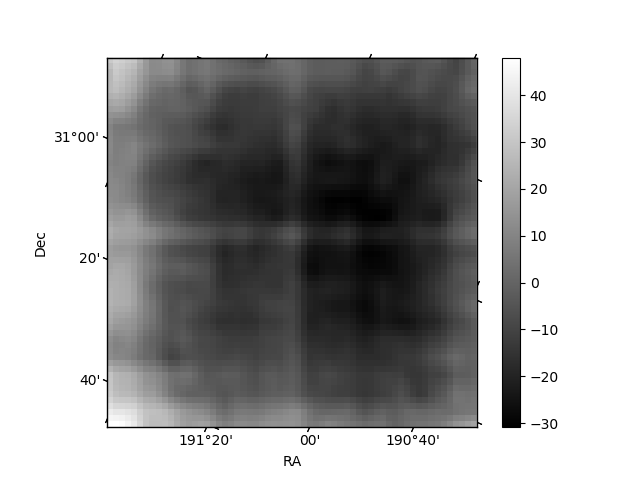
Quadrant B |
|---|---|---|---|
| Quadrant D | 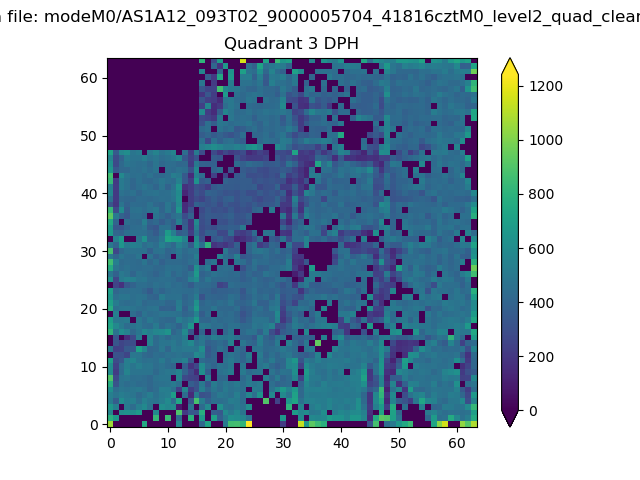 |
 |
Quadrant C |
| Plot type | Count rate plots | Images |
|---|---|---|
| Comparison with Poisson distribution Blue bars denote a histogram of data divided into 1 sec bins. Red curve is a Poisson curve with rate = median count rate of data. |
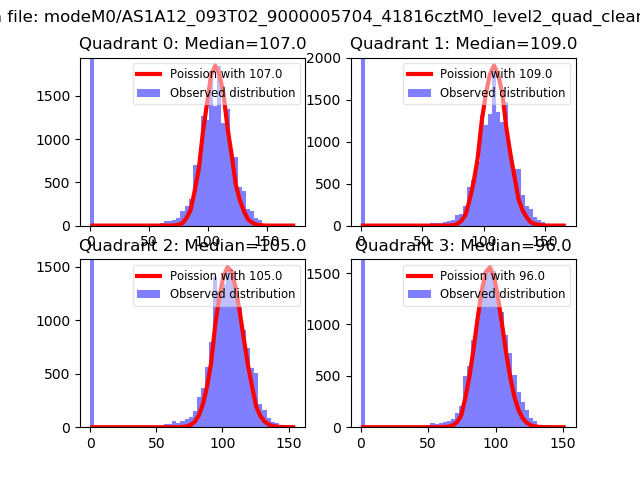 |
 |
| Quadrant-wise count rates Data is divided into 100 sec bins |
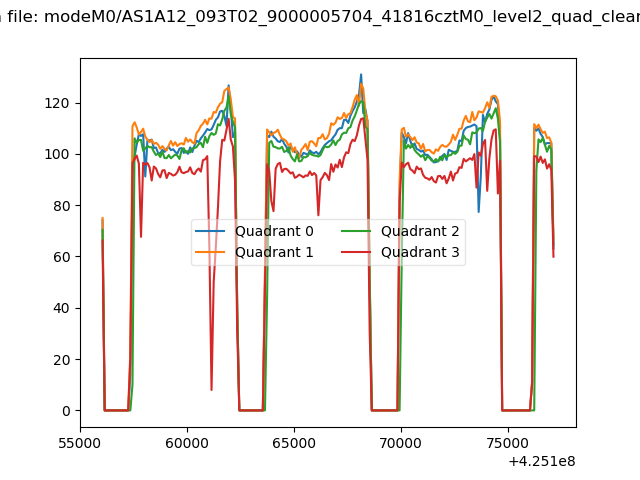 |
|
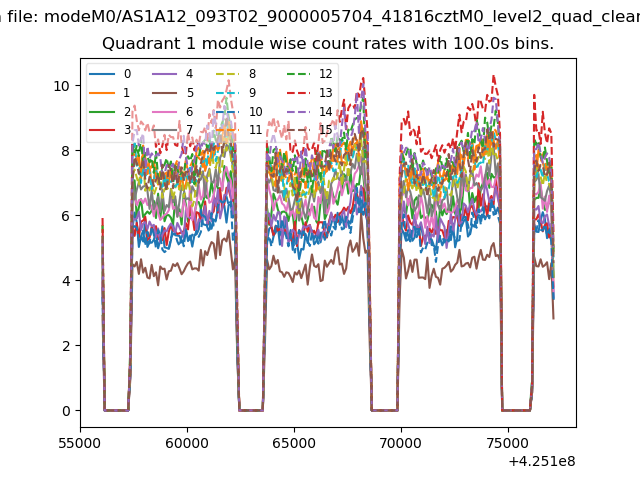
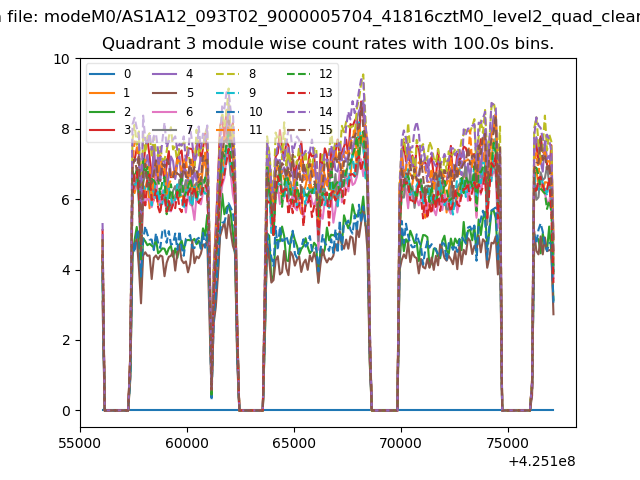
| Module-wise count rates for Quadrant A Data is divided into 100 sec bins |
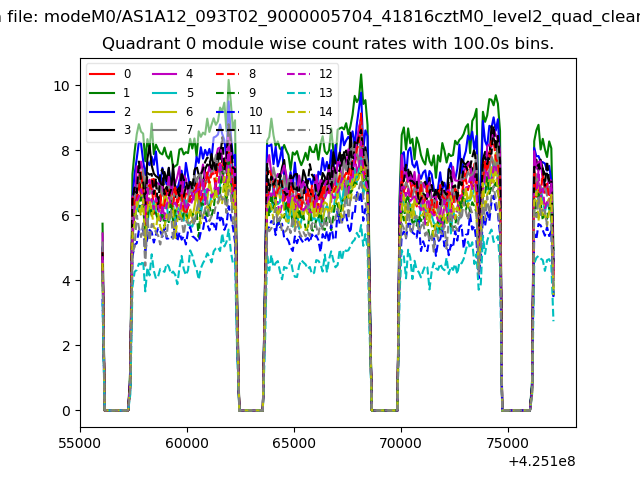 |
 |
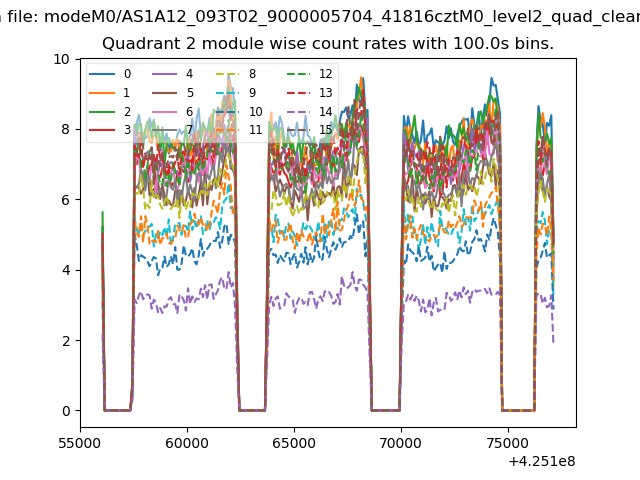
| Module-wise count rates for Quadrant B Data is divided into 100 sec bins |
 |
 |
| Module-wise count rates for Quadrant C Data is divided into 100 sec bins |
 |
 |
| Module-wise count rates for Quadrant D Data is divided into 100 sec bins |
 |
 |
| Parameter | Plot |
|---|---|
| CZT HV Monitor | 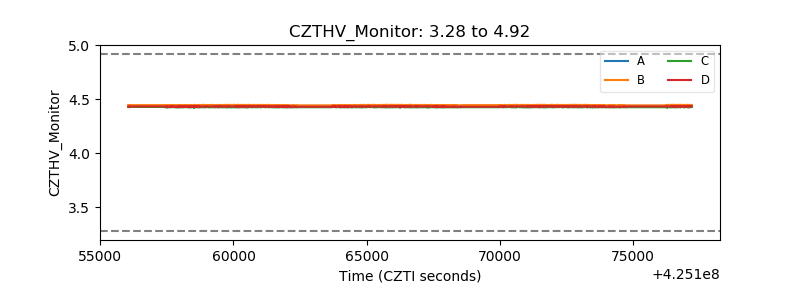 |
| D_VDD | 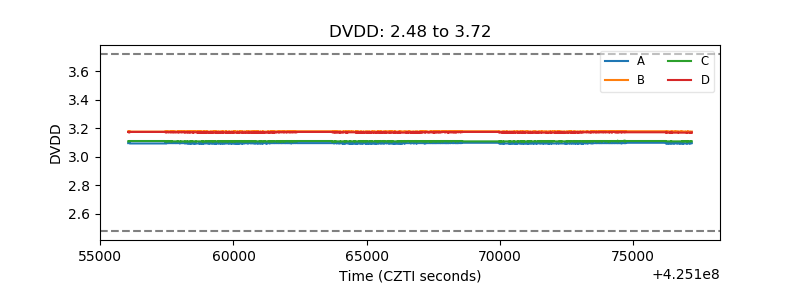 |
| Temperature 1 | 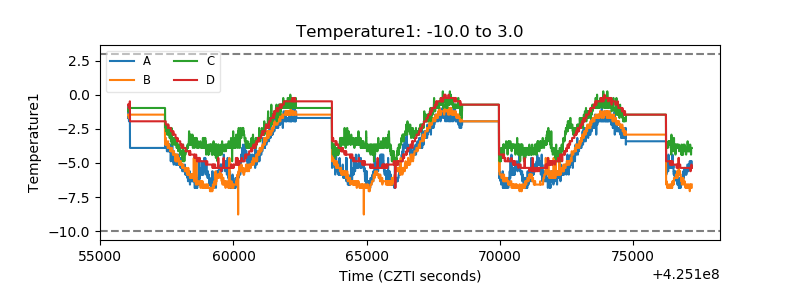 |
| Veto HV Monitor | 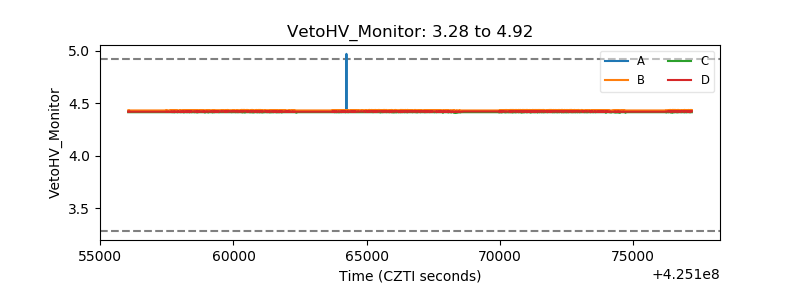 |
| Veto LLD | 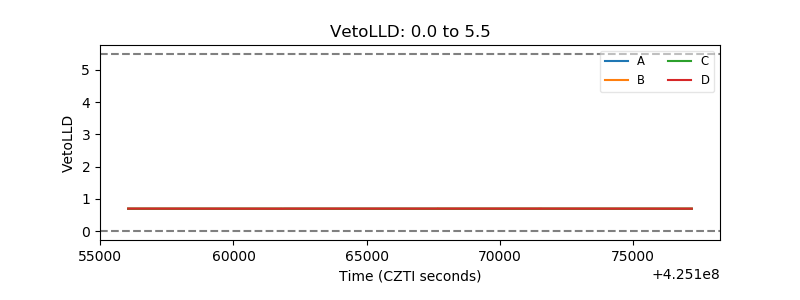 |
| Alpha Counter | 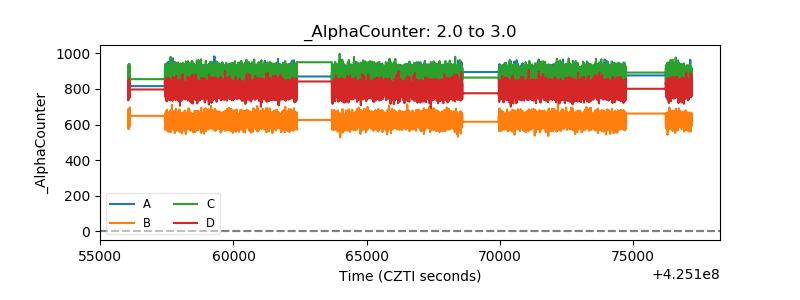 |
| _CPM_Rate | 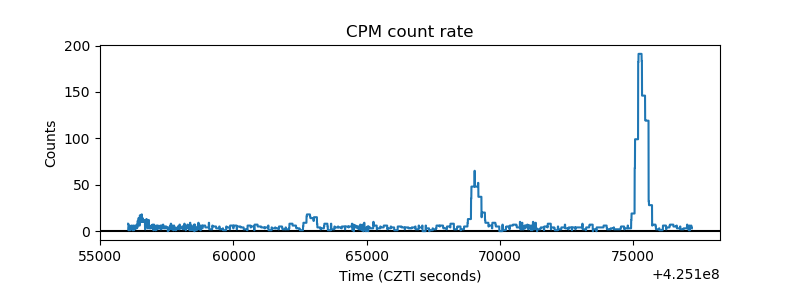 |
| CZT Counter | 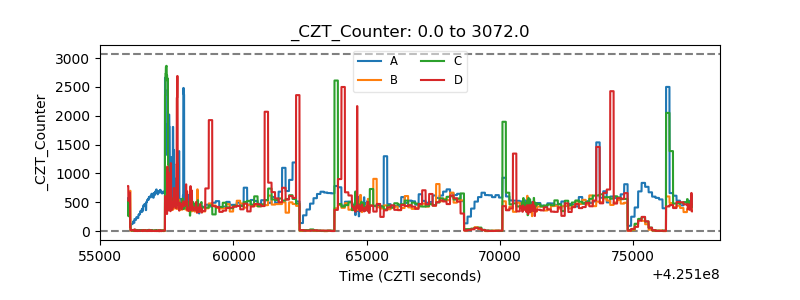 |
| +2.5 Volts monitor |  |
| +5 Volts monitor |  |
| _ROLL_ROT | 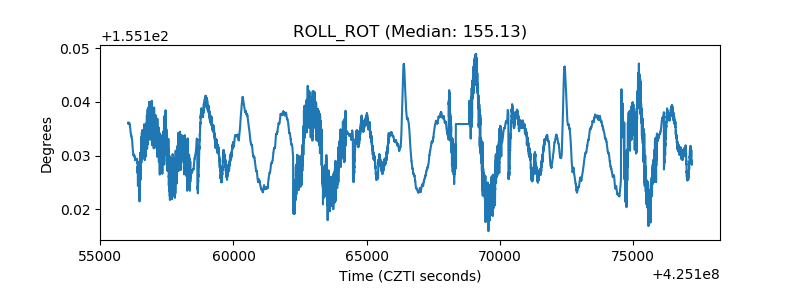 |
| _Roll_DEC |  |
| _Roll_RA | 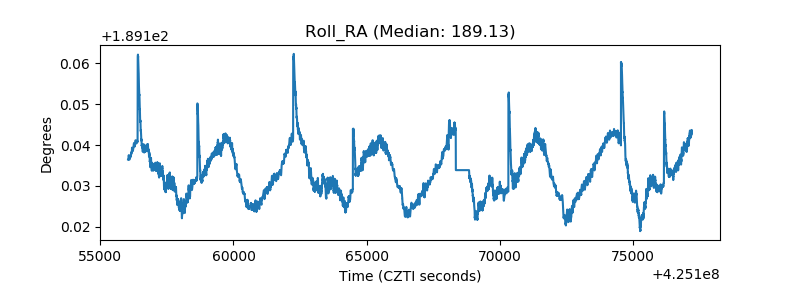 |
| Veto Counter | 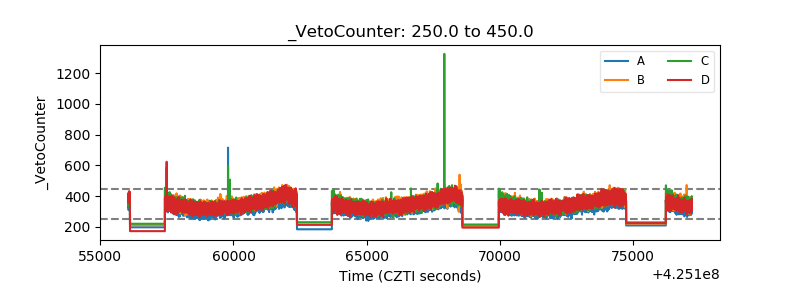 |