| Param | Original file | Final file |
|---|---|---|
| Filename | modeM0/AS1A12_093T02_9000005704_41817cztM0_level2.fits | modeM0/AS1A12_093T02_9000005704_41817cztM0_level2_quad_clean.evt |
| Size (bytes) | 746,400,960 | 196,493,760 |
| Size | 711.8 MB | 187.4 MB |
| Events in quadrant A | 6,942,213 | 1,322,508 |
| Events in quadrant B | 5,581,194 | 1,357,628 |
| Events in quadrant C | 7,242,079 | 1,243,228 |
| Events in quadrant D | 6,921,368 | 1,185,508 |
| Mode M9 | |||
|---|---|---|---|
| Quadrant | BADHDUFLAG | Total packets | Discarded packets |
| A | 0 | 63 | 0 |
| B | 0 | 63 | 0 |
| C | 0 | 63 | 0 |
| D | 0 | 63 | 0 |
| Mode M0 | |||
|---|---|---|---|
| Quadrant | BADHDUFLAG | Total packets | Discarded packets |
| A | 0 | 28113 | 8 |
| B | 0 | 24924 | 4 |
| C | 0 | 28833 | 4 |
| D | 0 | 29046 | 4 |
| Mode SS | |||
|---|---|---|---|
| Quadrant | BADHDUFLAG | Total packets | Discarded packets |
| A | 0 | 252 | 0 |
| B | 0 | 252 | 0 |
| C | 0 | 252 | 0 |
| D | 0 | 252 | 0 |
| Quadrant | Total seconds | Saturated seconds | Saturation percentage |
|---|---|---|---|
| A | 12152 | 63 | 0.518433% |
| B | 12154 | 27 | 0.222149% |
| C | 12154 | 488 | 4.015139% |
| D | 12154 | 250 | 2.056936% |
Noise dominated data is calculated using 1-second bins in cleaned event files. If a bin has >2000 counts, and if more than 50% of those come from <1% of pixels, then it is considered to be noise-dominated and hence unusable.
| Quadrant | # 1 sec bins | Bins with >0 counts | Bins with >2000 counts | High rate bins dominated by noise | Noise dominated (total time) | Noise dominated (detector-on time) | Marked lightcurve |
|---|---|---|---|---|---|---|---|
| A | 40695 | 12157 | 41 | 41 | 0.10% | 0.34% | 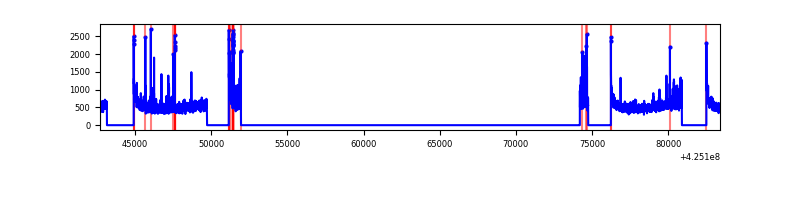 |
| B | 40695 | 12155 | 8 | 8 | 0.02% | 0.07% | 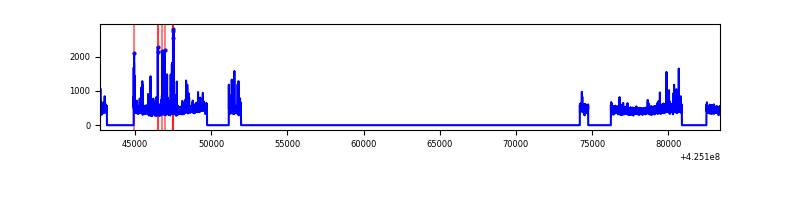 |
| C | 40695 | 12155 | 484 | 484 | 1.19% | 3.98% | 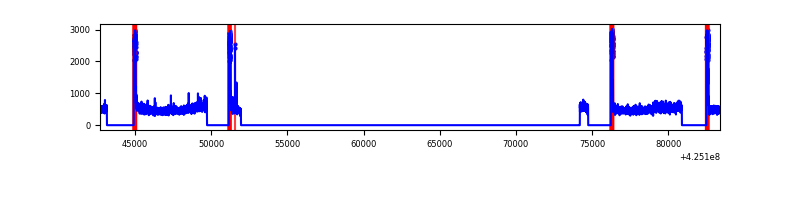 |
| D | 40695 | 12156 | 241 | 241 | 0.59% | 1.98% | 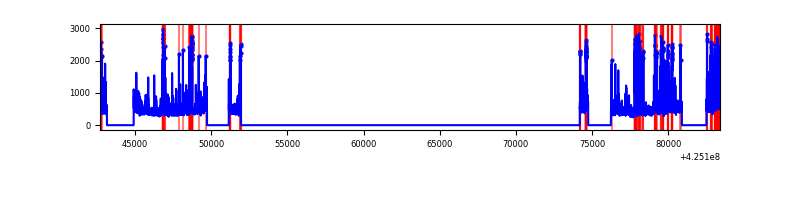 |
Top three noisy pixels from each quadrant. If the there are fewer than three noisy pixels in the level2.evt file, extra rows are filled as -1
| Pixel properties | Quadrant properties | ||||||
|---|---|---|---|---|---|---|---|
| Quadrant | DetID | PixID | Counts | Sigma | Mean | Median | Sigma |
| A | 10 | 83 | 1233673 | 4460.06 | 1348 | 1319 | 276.3 |
| A | 14 | 24 | 248605 | 894.96 | 1348 | 1319 | 276.3 |
| A | 12 | 189 | 118363 | 423.6 | 1348 | 1319 | 276.3 |
| B | 4 | 171 | 163907 | 629.57 | 1341 | 1301 | 258.3 |
| B | 0 | 183 | 52355 | 197.67 | 1341 | 1301 | 258.3 |
| B | 12 | 111 | 33186 | 123.45 | 1341 | 1301 | 258.3 |
| C | 0 | 10 | 1755671 | 5858.55 | 1276 | 1281 | 299.5 |
| C | 15 | 214 | 488076 | 1625.59 | 1276 | 1281 | 299.5 |
| C | 15 | 159 | 21379 | 67.11 | 1276 | 1281 | 299.5 |
| D | 13 | 249 | 572671 | 1766.02 | 1310 | 1272 | 323.6 |
| D | 12 | 6 | 419410 | 1292.34 | 1310 | 1272 | 323.6 |
| D | 12 | 79 | 355052 | 1093.43 | 1310 | 1272 | 323.6 |
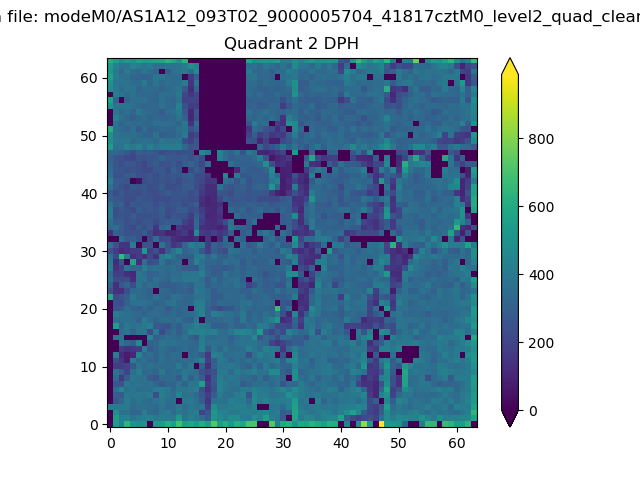
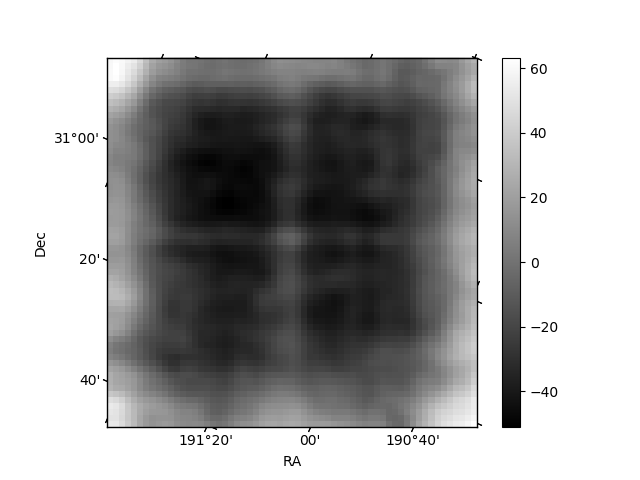
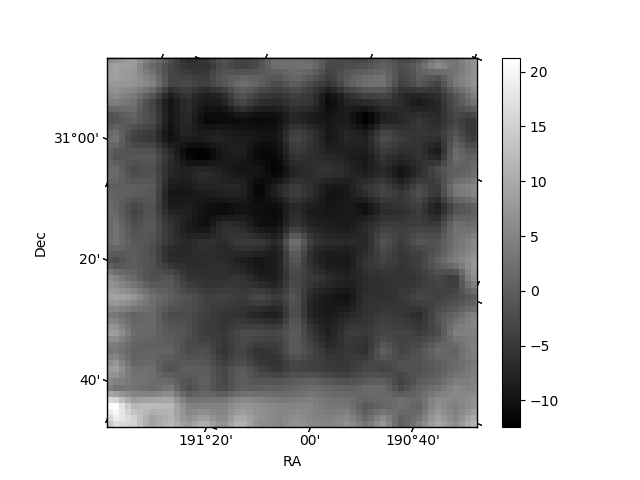
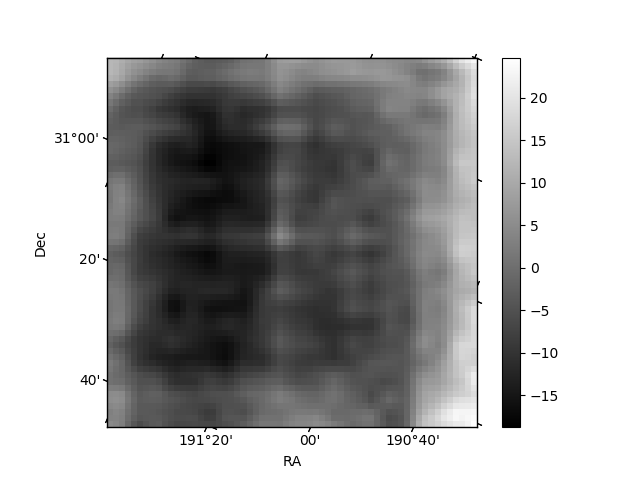
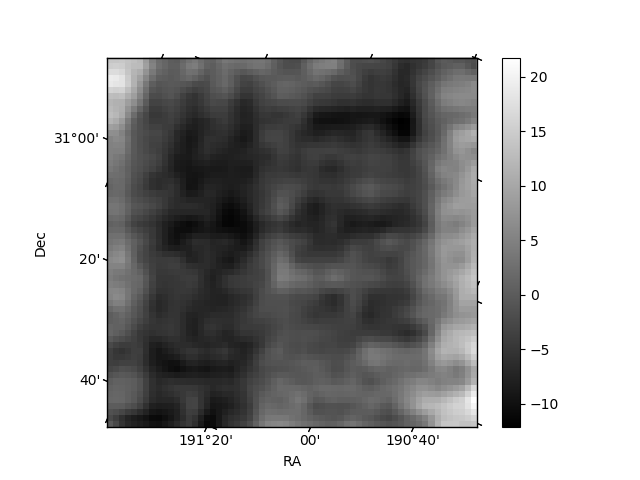
Histogram calculated using DETX and DETY for each event in the final _common_clean file
| Quadrant A | 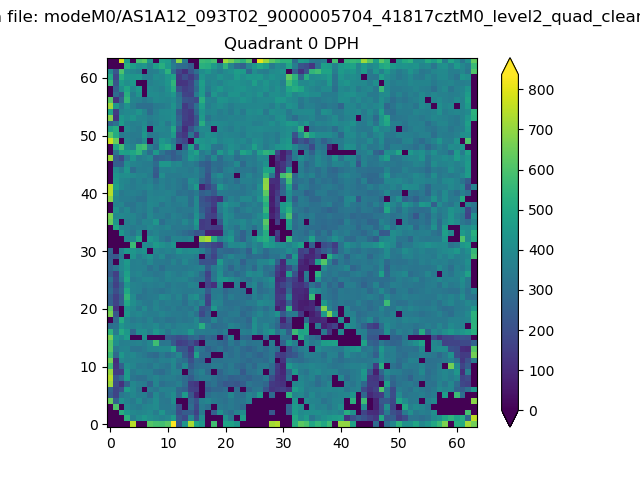 |
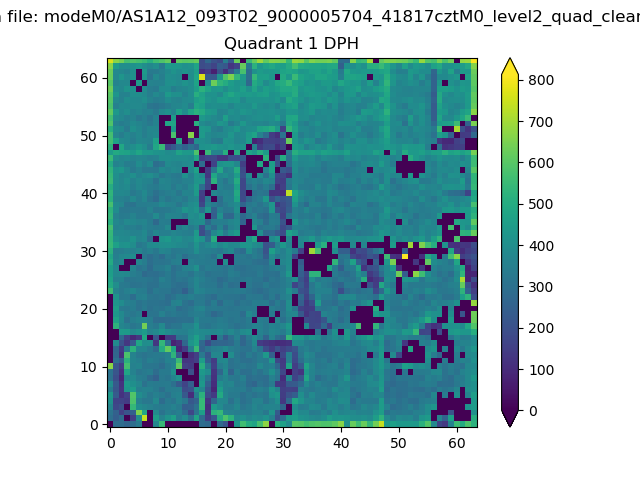 |
Quadrant B |
|---|---|---|---|
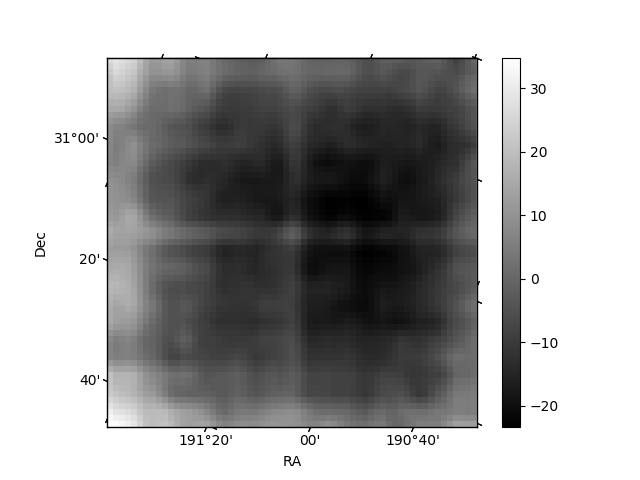
| Quadrant D | 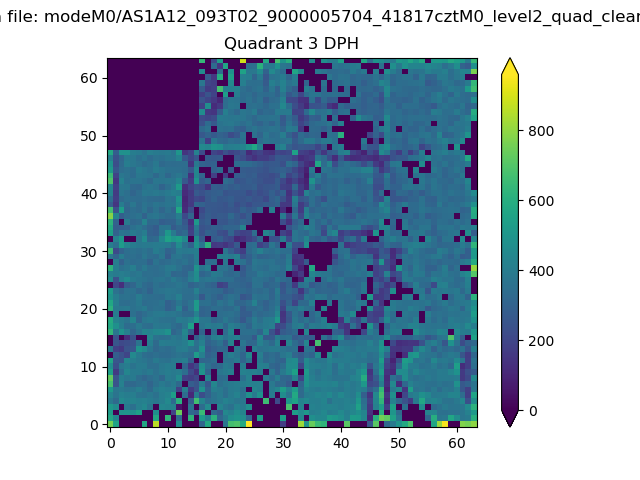 |
 |
Quadrant C |
| Plot type | Count rate plots | Images |
|---|---|---|
| Comparison with Poisson distribution Blue bars denote a histogram of data divided into 1 sec bins. Red curve is a Poisson curve with rate = median count rate of data. |
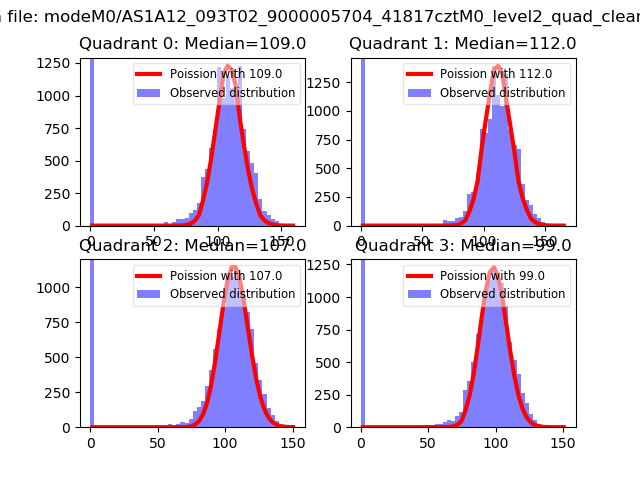 |
 |
| Quadrant-wise count rates Data is divided into 100 sec bins |
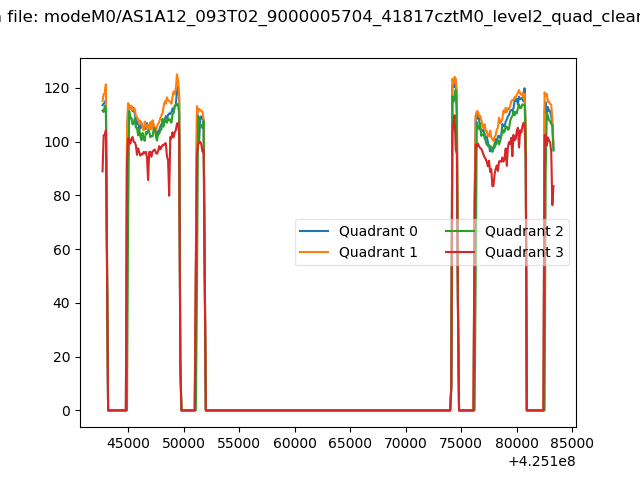 |
|
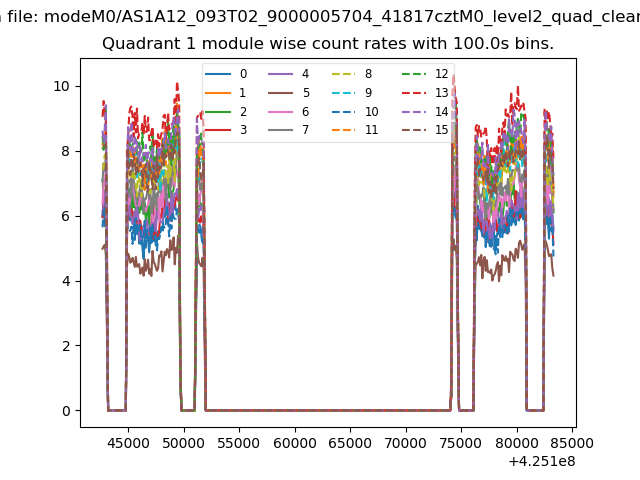
| Module-wise count rates for Quadrant A Data is divided into 100 sec bins |
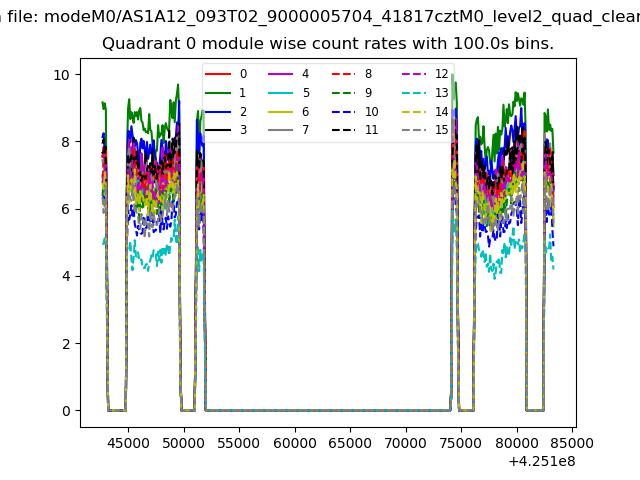 |
 |
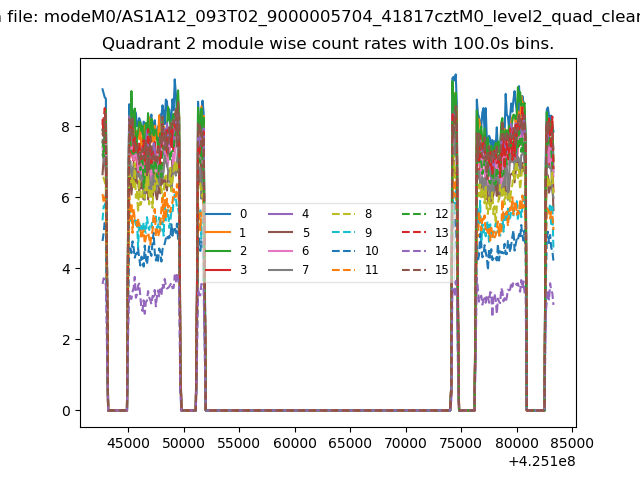
| Module-wise count rates for Quadrant B Data is divided into 100 sec bins |
 |
 |
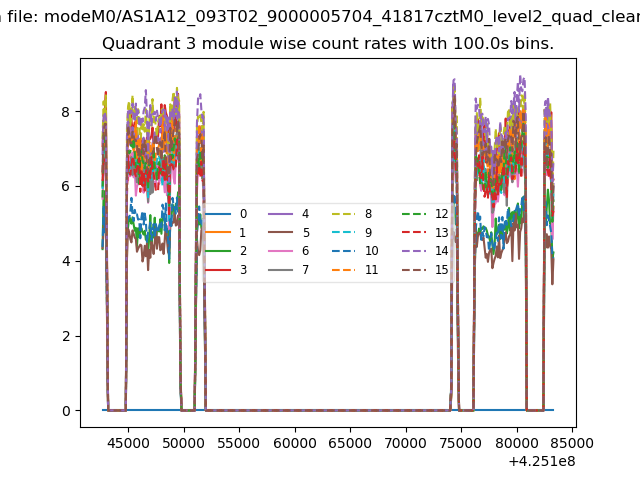
| Module-wise count rates for Quadrant C Data is divided into 100 sec bins |
 |
 |
| Module-wise count rates for Quadrant D Data is divided into 100 sec bins |
 |
 |
| Parameter | Plot |
|---|---|
| CZT HV Monitor | 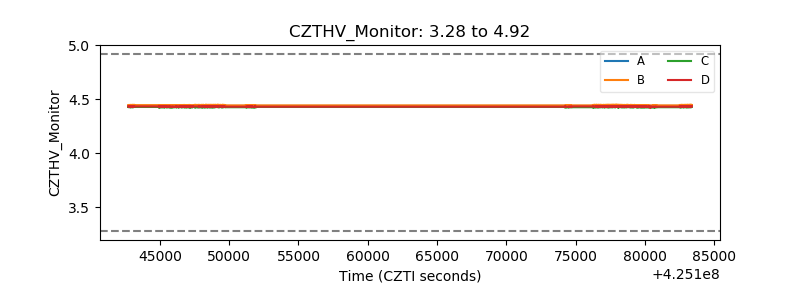 |
| D_VDD | 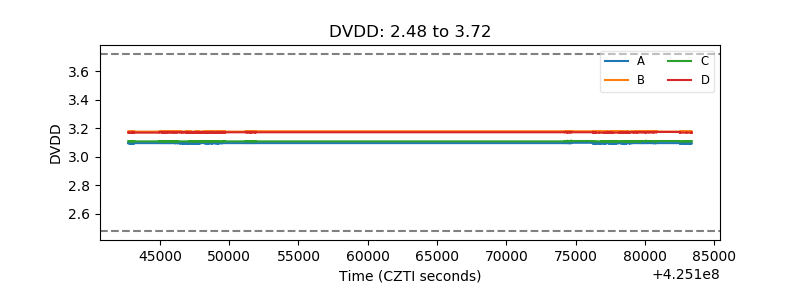 |
| Temperature 1 | 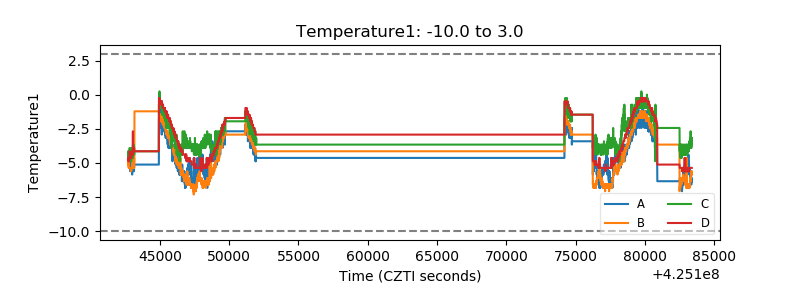 |
| Veto HV Monitor | 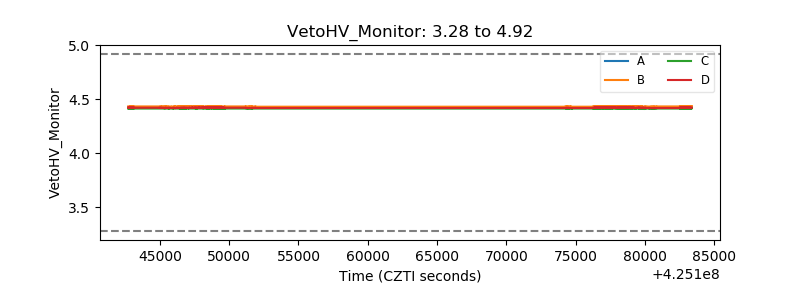 |
| Veto LLD | 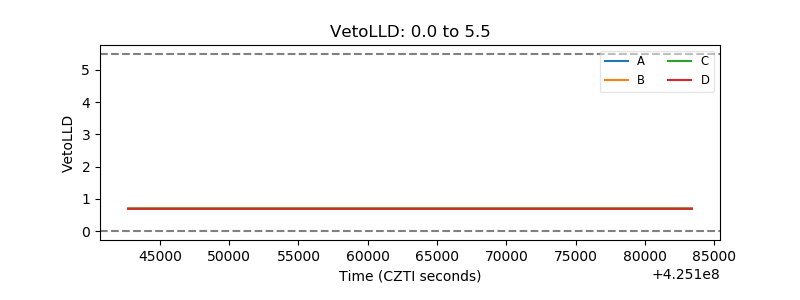 |
| Alpha Counter | 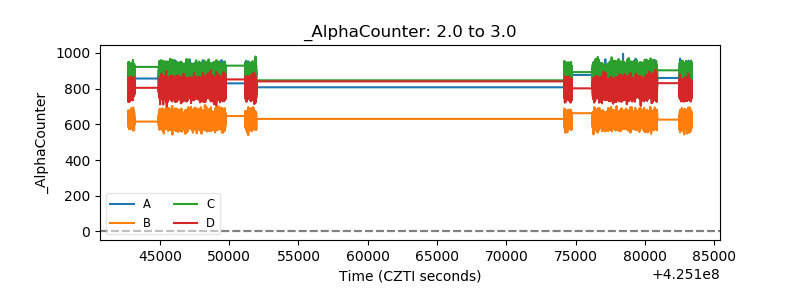 |
| _CPM_Rate | 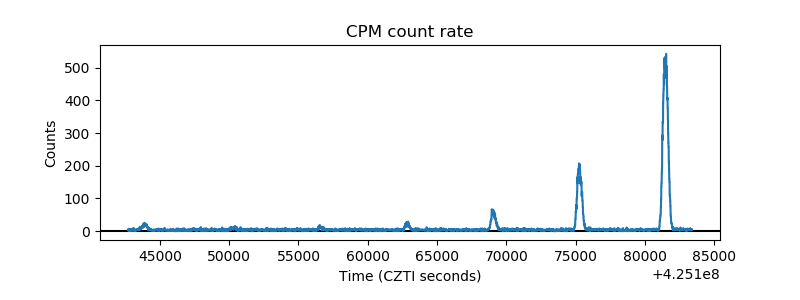 |
| CZT Counter | 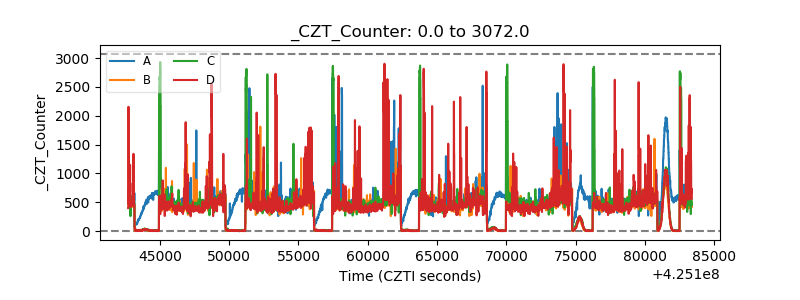 |
| +2.5 Volts monitor |  |
| +5 Volts monitor | 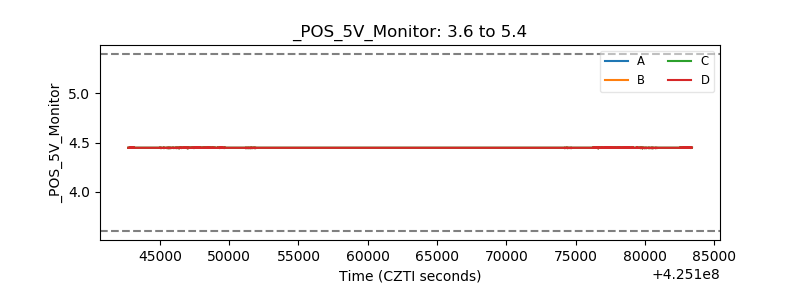 |
| _ROLL_ROT | 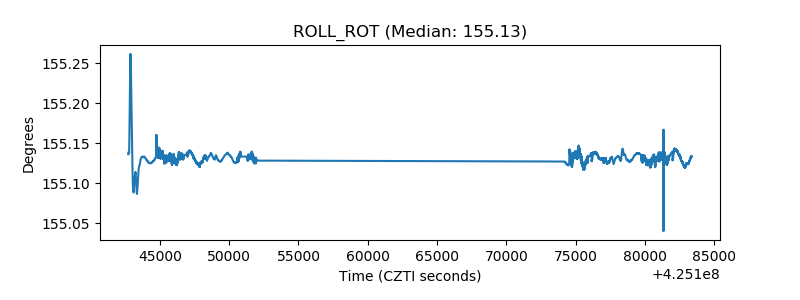 |
| _Roll_DEC | 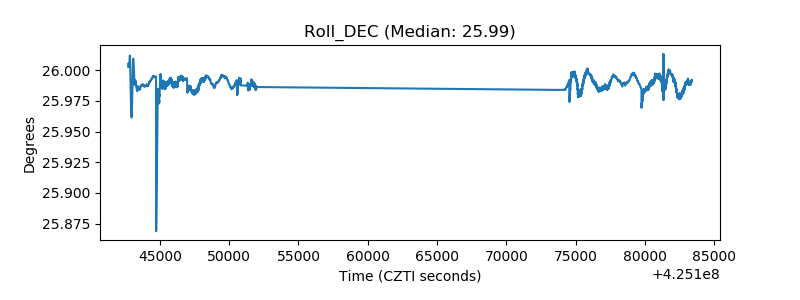 |
| _Roll_RA | 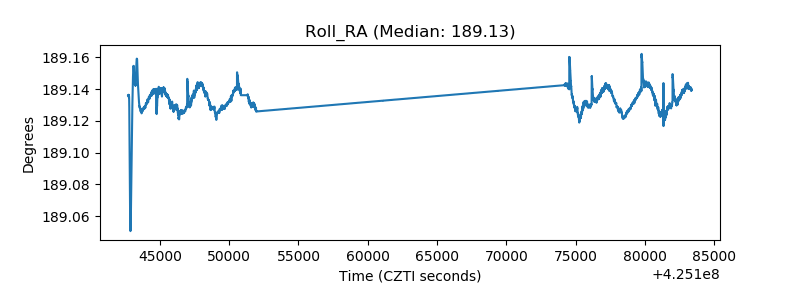 |
| Veto Counter | 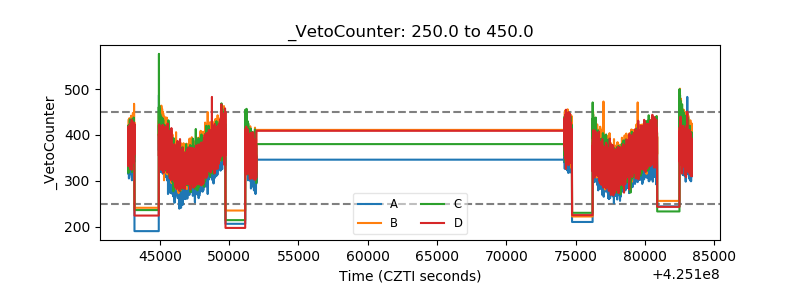 |