| Param | Original file | Final file |
|---|---|---|
| Filename | modeM0/AS1A12_093T02_9000005704_41819cztM0_level2.fits | modeM0/AS1A12_093T02_9000005704_41819cztM0_level2_quad_clean.evt |
| Size (bytes) | 379,275,840 | 98,619,840 |
| Size | 361.7 MB | 94.1 MB |
| Events in quadrant A | 3,399,158 | 668,065 |
| Events in quadrant B | 2,767,802 | 686,451 |
| Events in quadrant C | 3,649,883 | 623,141 |
| Events in quadrant D | 3,759,160 | 592,173 |
| Mode M9 | |||
|---|---|---|---|
| Quadrant | BADHDUFLAG | Total packets | Discarded packets |
| A | 0 | 33 | 0 |
| B | 0 | 33 | 0 |
| C | 0 | 33 | 0 |
| D | 0 | 33 | 0 |
| Mode M0 | |||
|---|---|---|---|
| Quadrant | BADHDUFLAG | Total packets | Discarded packets |
| A | 0 | 13751 | 2 |
| B | 0 | 12156 | 2 |
| C | 0 | 14385 | 2 |
| D | 0 | 15039 | 2 |
| Mode SS | |||
|---|---|---|---|
| Quadrant | BADHDUFLAG | Total packets | Discarded packets |
| A | 0 | 124 | 0 |
| B | 0 | 124 | 0 |
| C | 0 | 124 | 0 |
| D | 0 | 124 | 0 |
| Quadrant | Total seconds | Saturated seconds | Saturation percentage |
|---|---|---|---|
| A | 5955 | 21 | 0.352645% |
| B | 5955 | 18 | 0.302267% |
| C | 5955 | 250 | 4.198153% |
| D | 5956 | 139 | 2.333781% |
Noise dominated data is calculated using 1-second bins in cleaned event files. If a bin has >2000 counts, and if more than 50% of those come from <1% of pixels, then it is considered to be noise-dominated and hence unusable.
| Quadrant | # 1 sec bins | Bins with >0 counts | Bins with >2000 counts | High rate bins dominated by noise | Noise dominated (total time) | Noise dominated (detector-on time) | Marked lightcurve |
|---|---|---|---|---|---|---|---|
| A | 9300 | 5957 | 3 | 3 | 0.03% | 0.05% | 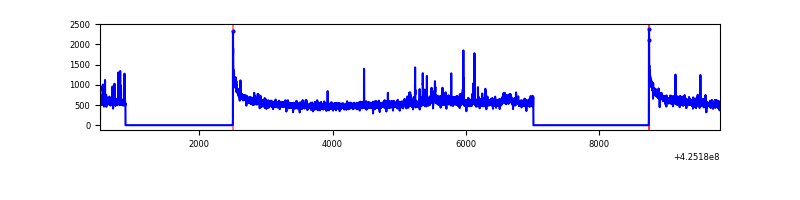 |
| B | 9300 | 5956 | 5 | 5 | 0.05% | 0.08% | 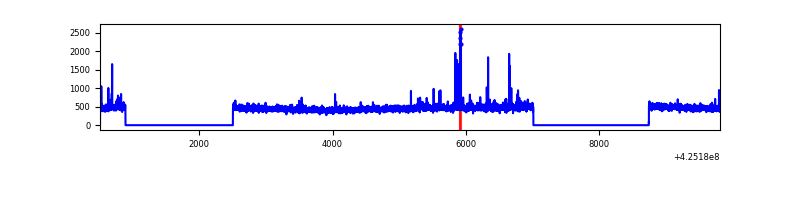 |
| C | 9300 | 5956 | 246 | 246 | 2.65% | 4.13% | 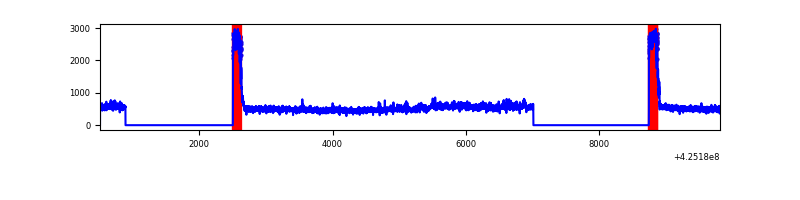 |
| D | 9301 | 5958 | 133 | 133 | 1.43% | 2.23% | 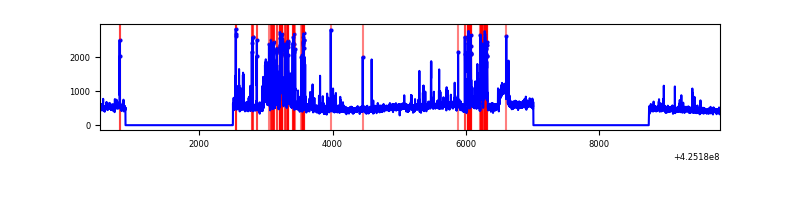 |
Top three noisy pixels from each quadrant. If the there are fewer than three noisy pixels in the level2.evt file, extra rows are filled as -1
| Pixel properties | Quadrant properties | ||||||
|---|---|---|---|---|---|---|---|
| Quadrant | DetID | PixID | Counts | Sigma | Mean | Median | Sigma |
| A | 10 | 83 | 610753 | 4376.7 | 678 | 664 | 139.4 |
| A | 14 | 24 | 85613 | 609.41 | 678 | 664 | 139.4 |
| A | 12 | 189 | 60678 | 430.53 | 678 | 664 | 139.4 |
| B | 5 | 32 | 27708 | 204.84 | 674 | 655 | 132.1 |
| B | 0 | 245 | 24454 | 180.21 | 674 | 655 | 132.1 |
| B | 0 | 183 | 23178 | 170.54 | 674 | 655 | 132.1 |
| C | 0 | 10 | 925566 | 6177.93 | 636 | 639 | 149.7 |
| C | 15 | 214 | 238710 | 1590.16 | 636 | 639 | 149.7 |
| C | 13 | 61 | 4348 | 24.77 | 636 | 639 | 149.7 |
| D | 12 | 79 | 487431 | 3033.76 | 652 | 633 | 160.5 |
| D | 13 | 249 | 311272 | 1935.92 | 652 | 633 | 160.5 |
| D | 12 | 6 | 281018 | 1747.38 | 652 | 633 | 160.5 |
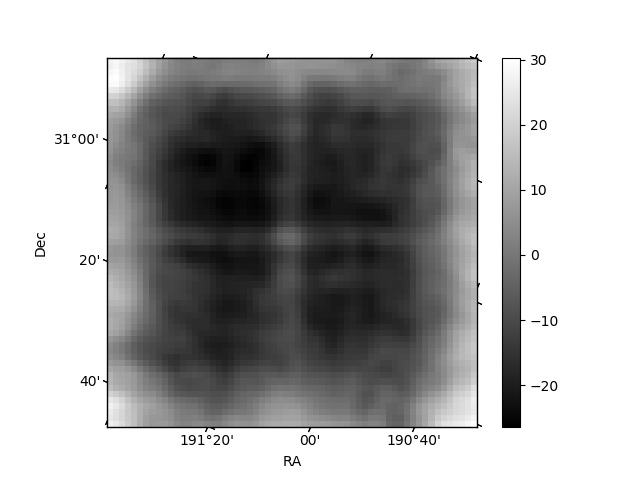
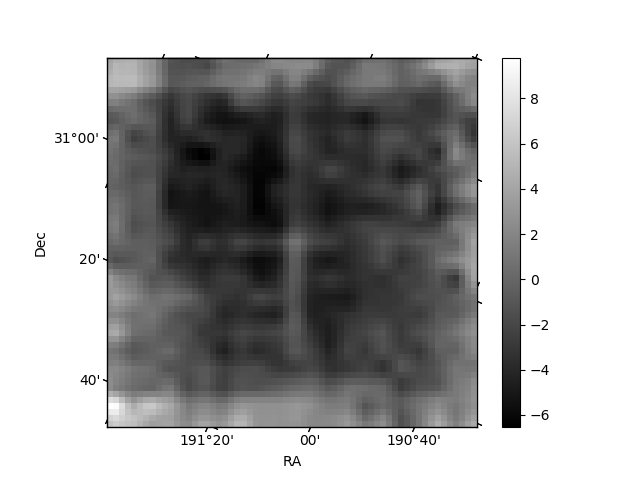
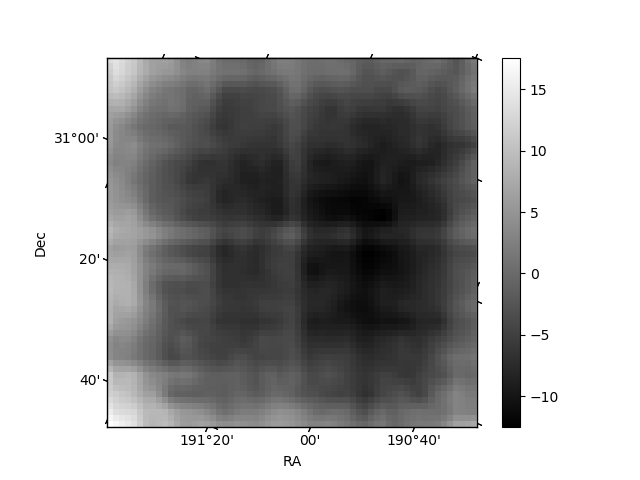
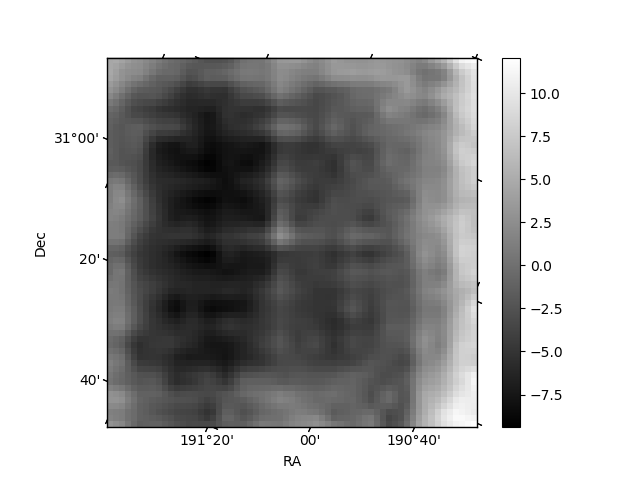
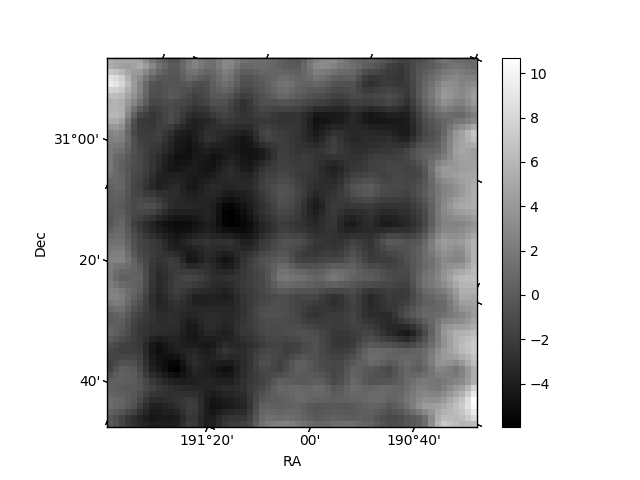
Histogram calculated using DETX and DETY for each event in the final _common_clean file
| Quadrant A | 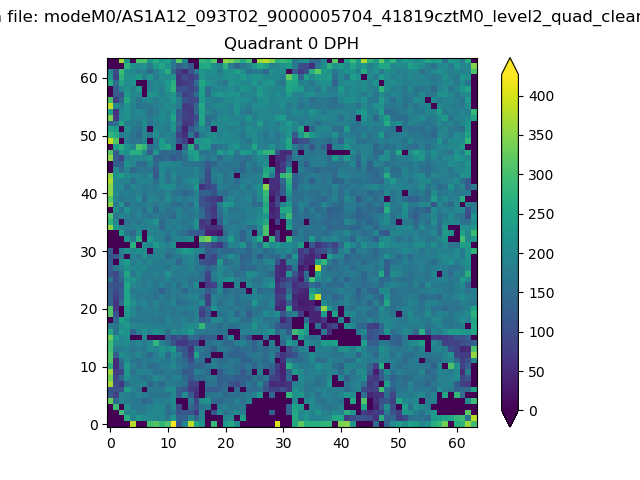 |
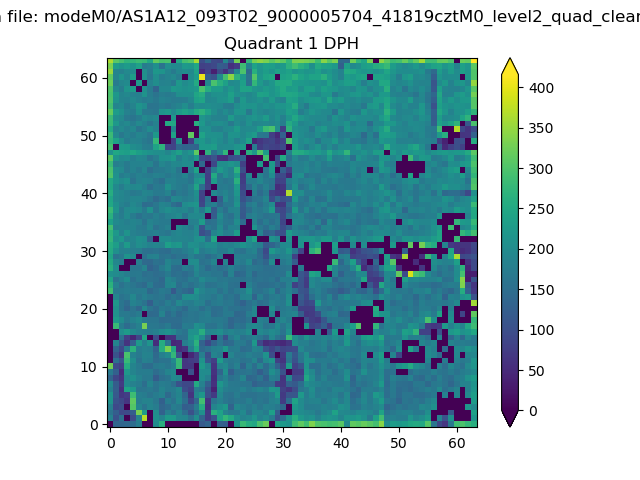 |
Quadrant B |
|---|---|---|---|
| Quadrant D | 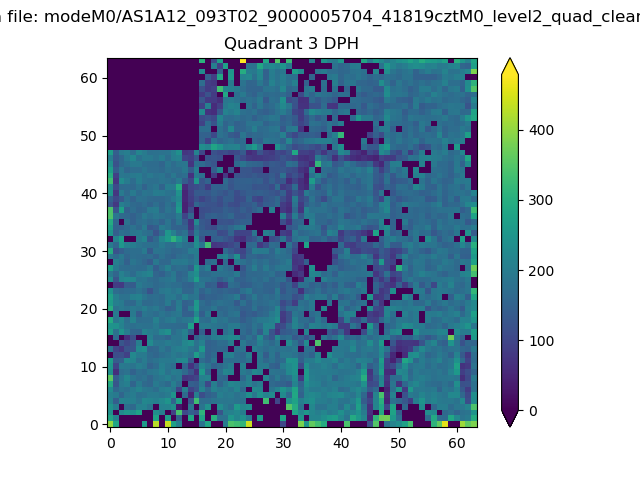 |
 |
Quadrant C |
| Plot type | Count rate plots | Images |
|---|---|---|
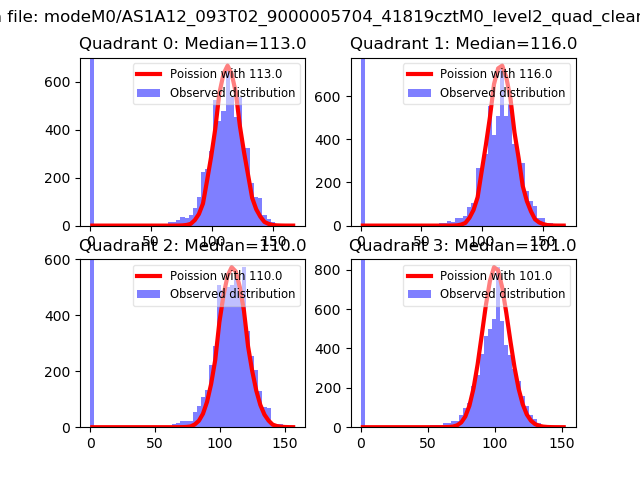
| Comparison with Poisson distribution Blue bars denote a histogram of data divided into 1 sec bins. Red curve is a Poisson curve with rate = median count rate of data. |
 |
 |
| Quadrant-wise count rates Data is divided into 100 sec bins |
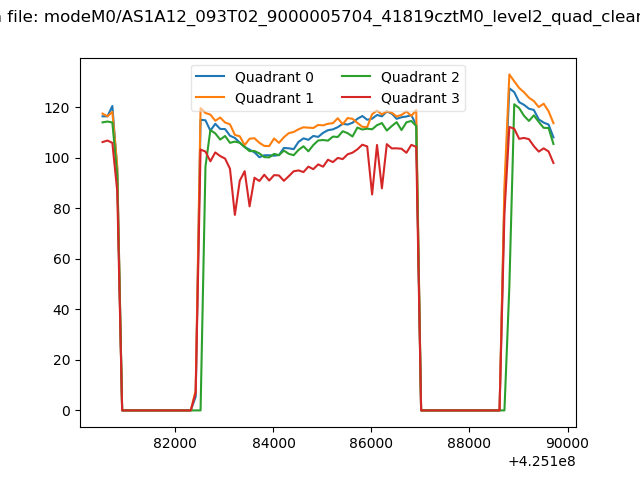 |
|
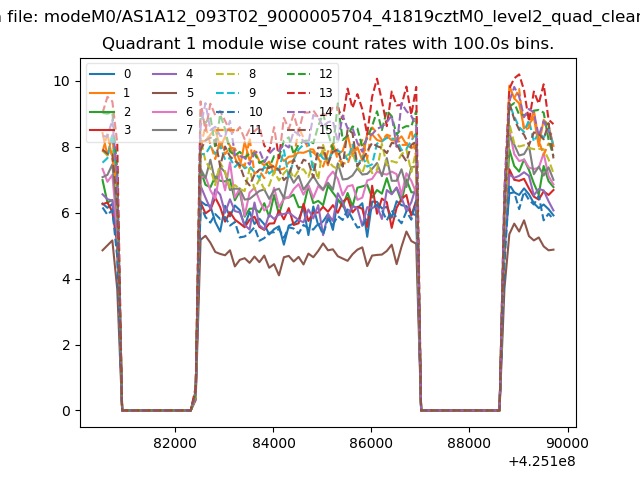
| Module-wise count rates for Quadrant A Data is divided into 100 sec bins |
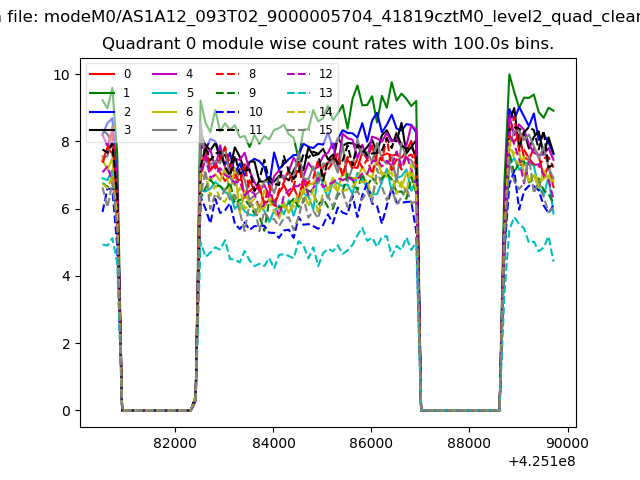 |
 |
| Module-wise count rates for Quadrant B Data is divided into 100 sec bins |
 |
 |
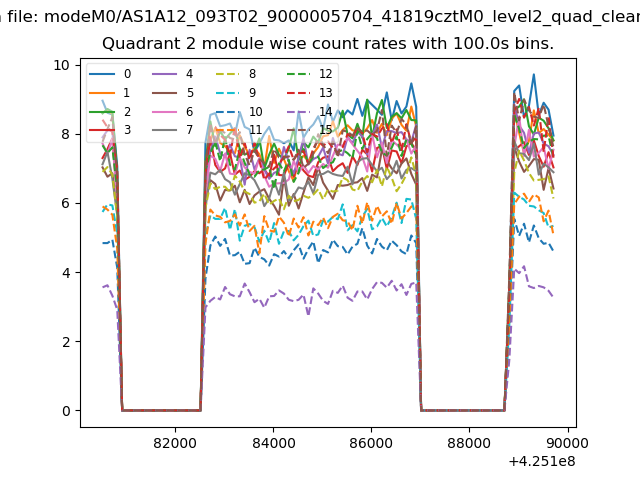
| Module-wise count rates for Quadrant C Data is divided into 100 sec bins |
 |
 |
| Module-wise count rates for Quadrant D Data is divided into 100 sec bins |
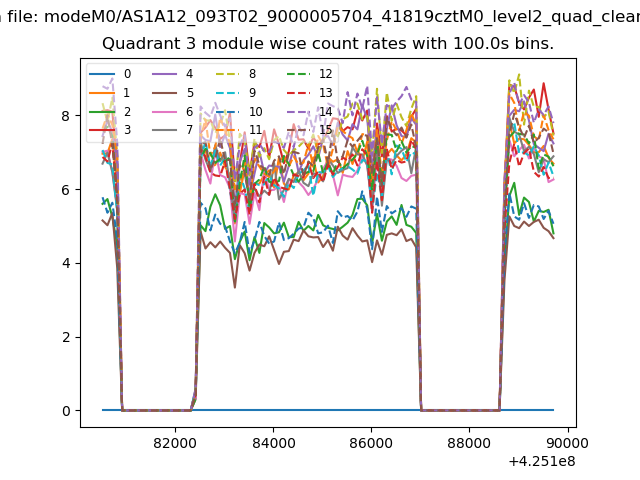 |
 |
| Parameter | Plot |
|---|---|
| CZT HV Monitor | 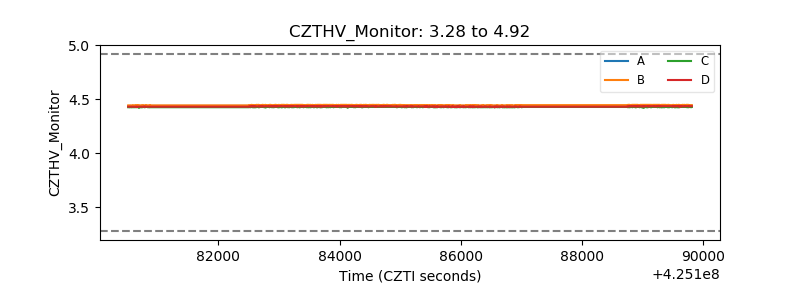 |
| D_VDD | 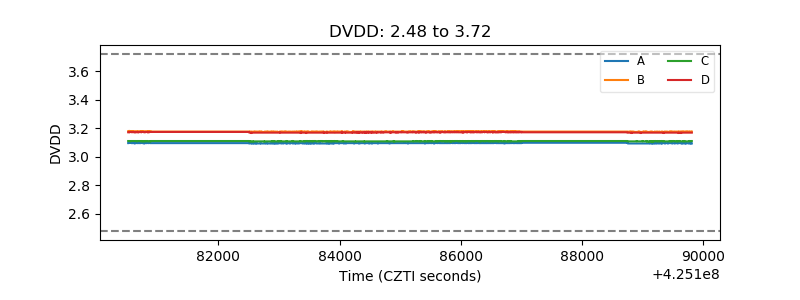 |
| Temperature 1 | 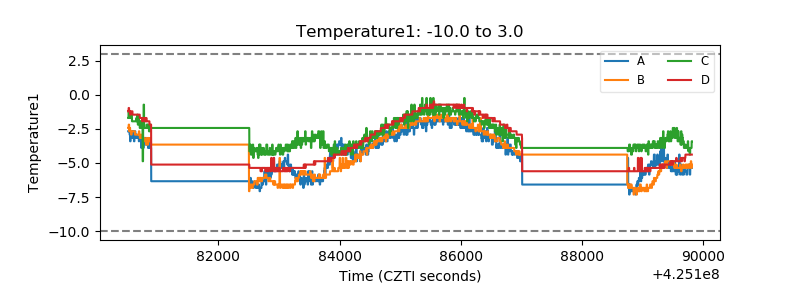 |
| Veto HV Monitor | 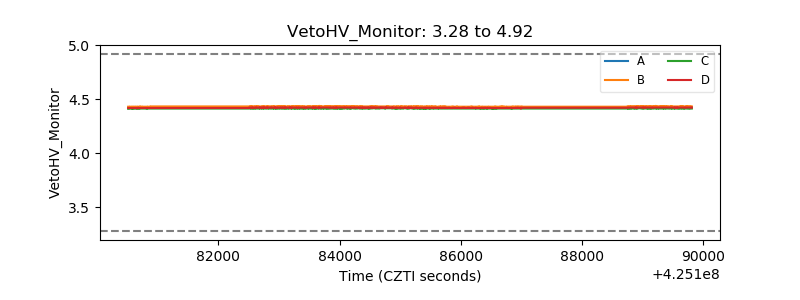 |
| Veto LLD | 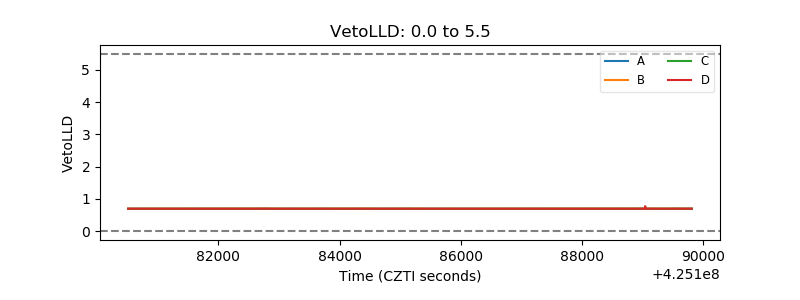 |
| Alpha Counter | 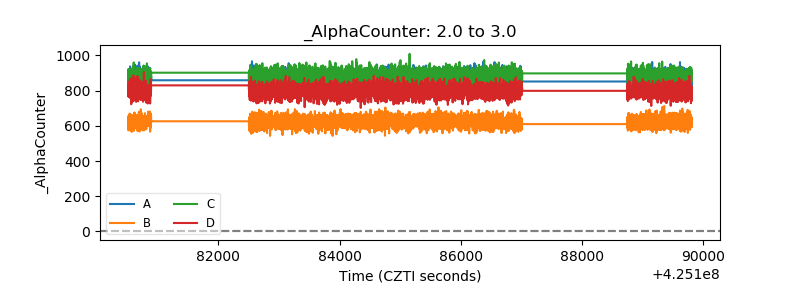 |
| _CPM_Rate | 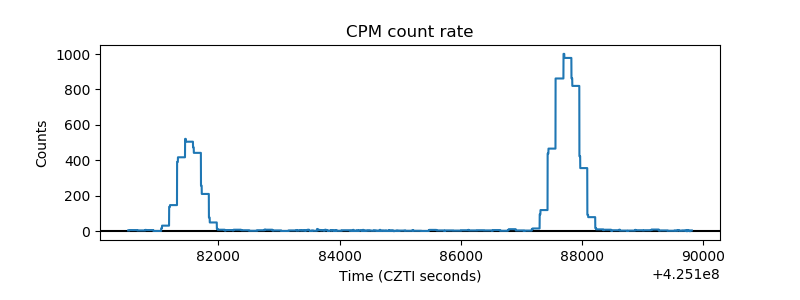 |
| CZT Counter | 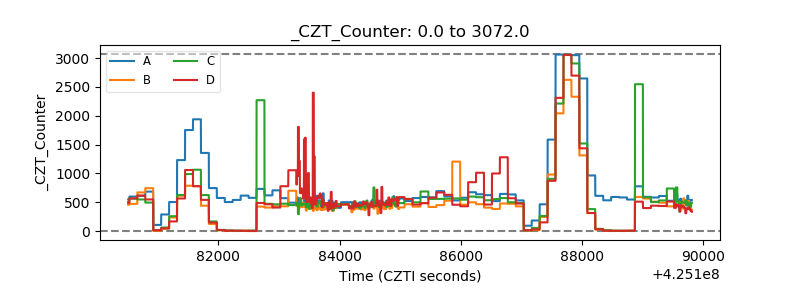 |
| +2.5 Volts monitor |  |
| +5 Volts monitor | 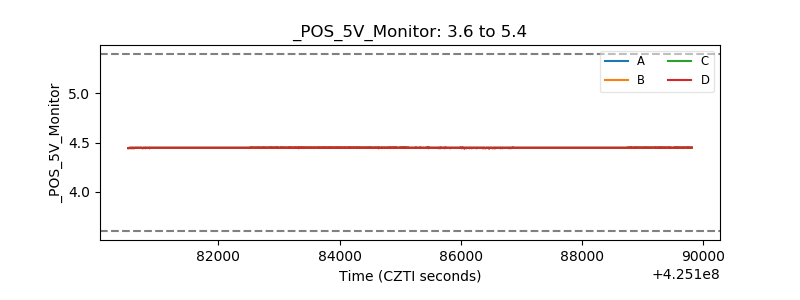 |
| _ROLL_ROT | 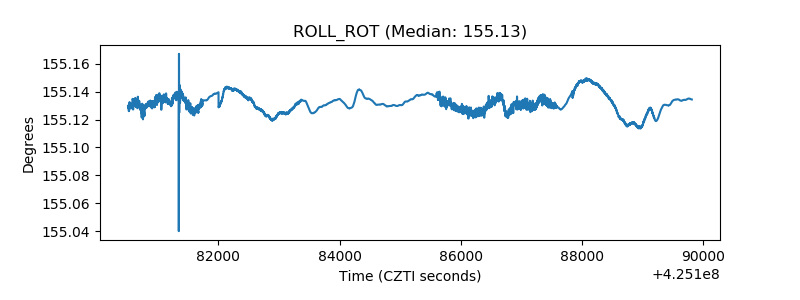 |
| _Roll_DEC | 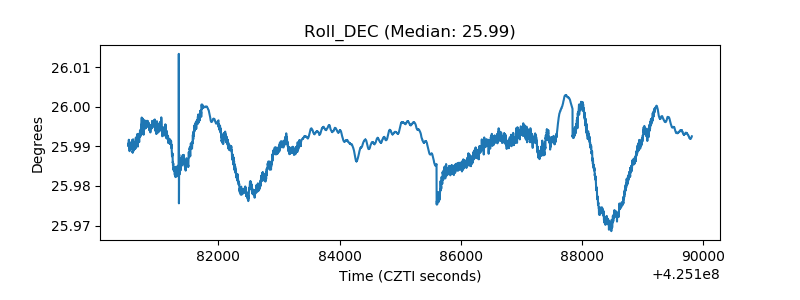 |
| _Roll_RA | 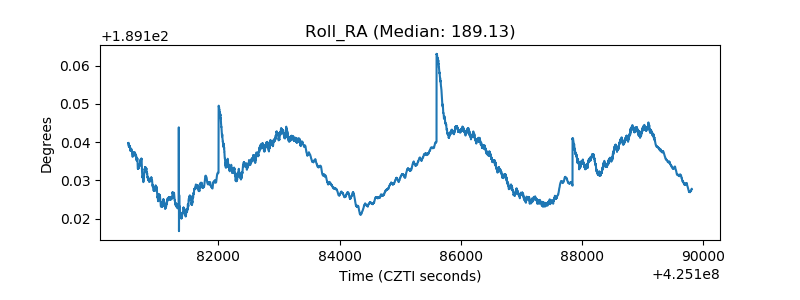 |
| Veto Counter | 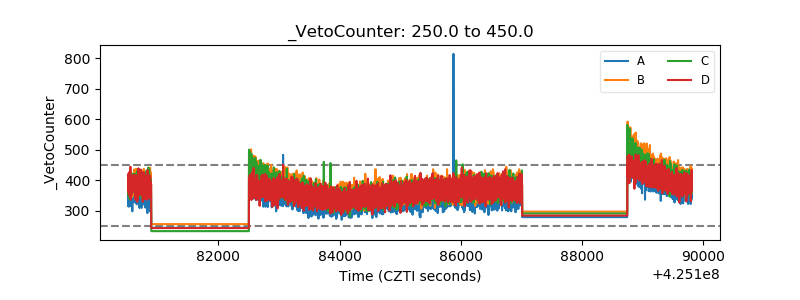 |