| Param | Original file | Final file |
|---|---|---|
| Filename | modeM0/AS1A12_093T02_9000005704_41821cztM0_level2.fits | modeM0/AS1A12_093T02_9000005704_41821cztM0_level2_quad_clean.evt |
| Size (bytes) | 325,163,520 | 92,606,400 |
| Size | 310.1 MB | 88.3 MB |
| Events in quadrant A | 3,066,266 | 642,320 |
| Events in quadrant B | 2,469,123 | 662,415 |
| Events in quadrant C | 3,439,353 | 575,983 |
| Events in quadrant D | 2,664,603 | 566,545 |
| Mode M9 | |||
|---|---|---|---|
| Quadrant | BADHDUFLAG | Total packets | Discarded packets |
| A | 0 | 29 | 0 |
| B | 0 | 30 | 0 |
| C | 0 | 30 | 0 |
| D | 0 | 30 | 0 |
| Mode M0 | |||
|---|---|---|---|
| Quadrant | BADHDUFLAG | Total packets | Discarded packets |
| A | 0 | 12225 | 2 |
| B | 0 | 10379 | 2 |
| C | 0 | 13187 | 2 |
| D | 0 | 11193 | 2 |
| Mode SS | |||
|---|---|---|---|
| Quadrant | BADHDUFLAG | Total packets | Discarded packets |
| A | 0 | 104 | 0 |
| B | 0 | 104 | 0 |
| C | 0 | 104 | 0 |
| D | 0 | 104 | 0 |
| Quadrant | Total seconds | Saturated seconds | Saturation percentage |
|---|---|---|---|
| A | 5097 | 16 | 0.313910% |
| B | 5097 | 7 | 0.137336% |
| C | 5097 | 274 | 5.375711% |
| D | 5097 | 56 | 1.098686% |
Noise dominated data is calculated using 1-second bins in cleaned event files. If a bin has >2000 counts, and if more than 50% of those come from <1% of pixels, then it is considered to be noise-dominated and hence unusable.
| Quadrant | # 1 sec bins | Bins with >0 counts | Bins with >2000 counts | High rate bins dominated by noise | Noise dominated (total time) | Noise dominated (detector-on time) | Marked lightcurve |
|---|---|---|---|---|---|---|---|
| A | 7099 | 5098 | 4 | 4 | 0.06% | 0.08% | 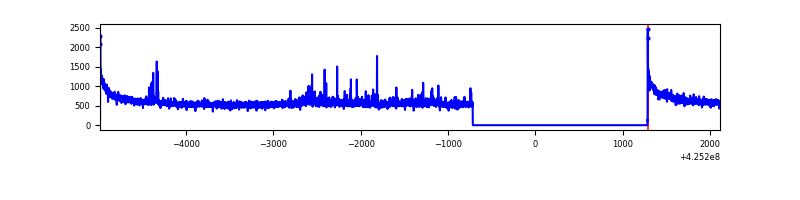 |
| B | 7099 | 5098 | 3 | 3 | 0.04% | 0.06% | 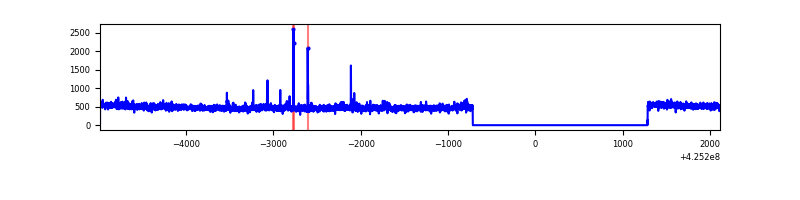 |
| C | 7099 | 5098 | 269 | 269 | 3.79% | 5.28% | 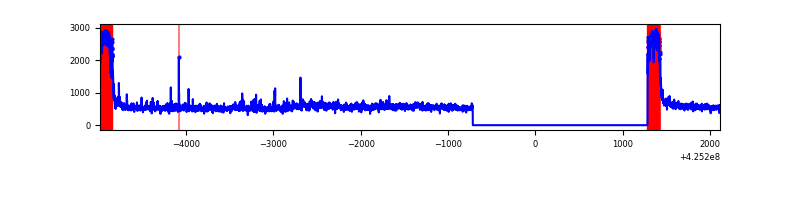 |
| D | 7099 | 5098 | 55 | 55 | 0.77% | 1.08% | 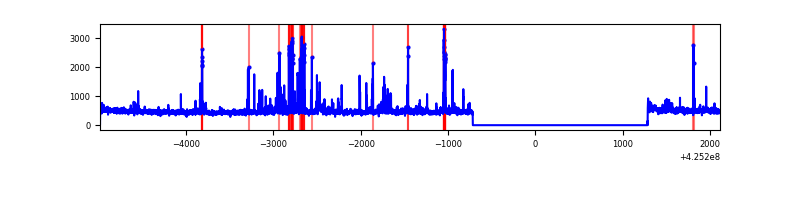 |
Top three noisy pixels from each quadrant. If the there are fewer than three noisy pixels in the level2.evt file, extra rows are filled as -1
| Pixel properties | Quadrant properties | ||||||
|---|---|---|---|---|---|---|---|
| Quadrant | DetID | PixID | Counts | Sigma | Mean | Median | Sigma |
| A | 10 | 83 | 552327 | 4340.66 | 621 | 609 | 127.1 |
| A | 12 | 189 | 78793 | 615.11 | 621 | 609 | 127.1 |
| A | 14 | 24 | 21066 | 160.94 | 621 | 609 | 127.1 |
| B | 0 | 245 | 16594 | 135.6 | 613 | 598 | 118.0 |
| B | 0 | 183 | 15143 | 123.3 | 613 | 598 | 118.0 |
| B | 15 | 85 | 14818 | 120.55 | 613 | 598 | 118.0 |
| C | 0 | 10 | 970876 | 7377.99 | 568 | 573 | 131.5 |
| C | 15 | 214 | 203941 | 1546.37 | 568 | 573 | 131.5 |
| C | 15 | 111 | 45190 | 339.26 | 568 | 573 | 131.5 |
| D | 13 | 249 | 131779 | 901.13 | 596 | 582 | 145.6 |
| D | 10 | 199 | 113299 | 774.2 | 596 | 582 | 145.6 |
| D | 5 | 222 | 42100 | 285.17 | 596 | 582 | 145.6 |
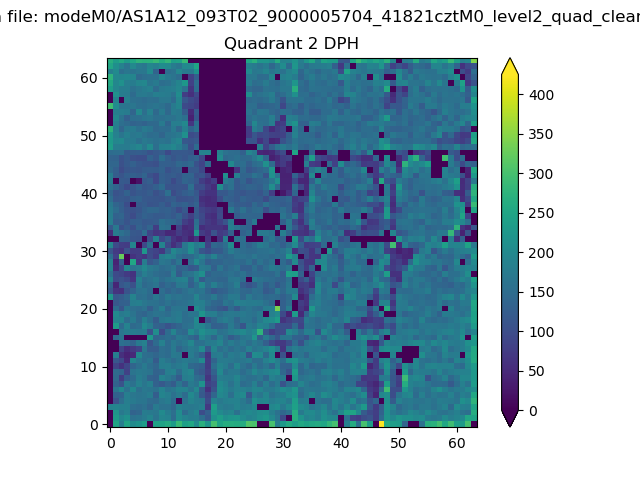
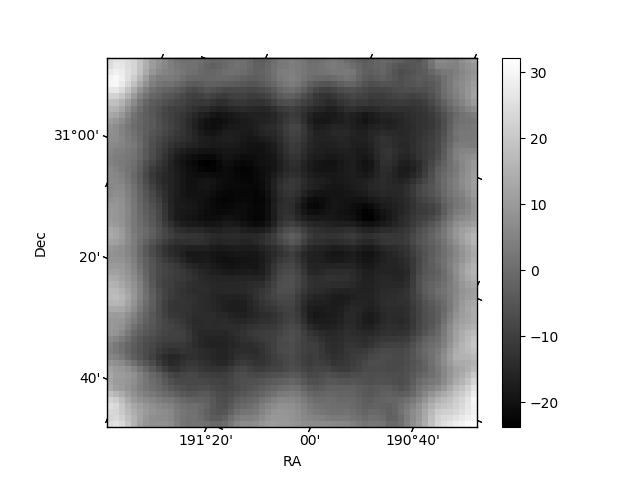
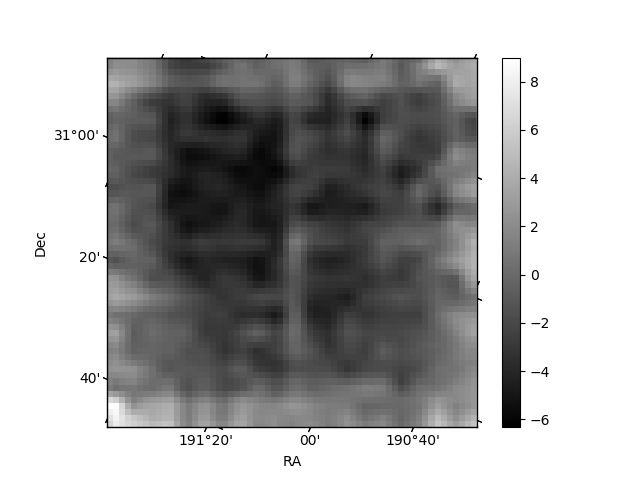
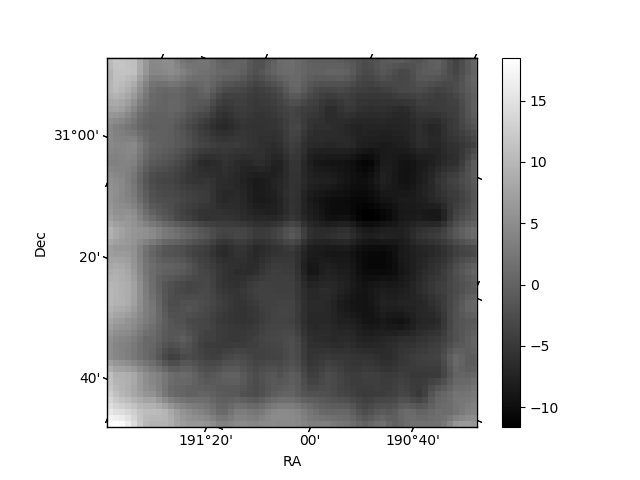
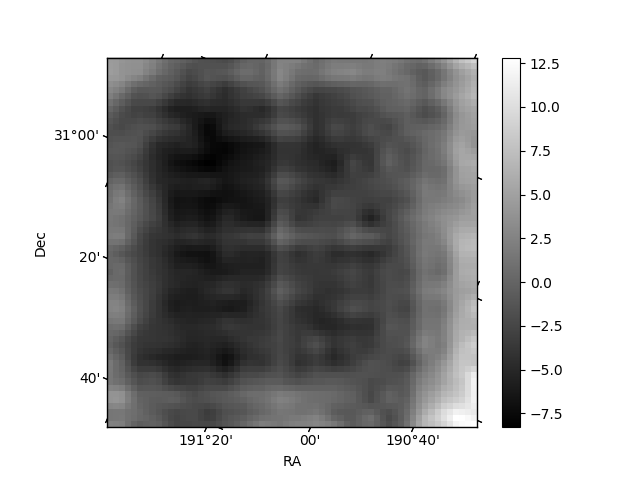
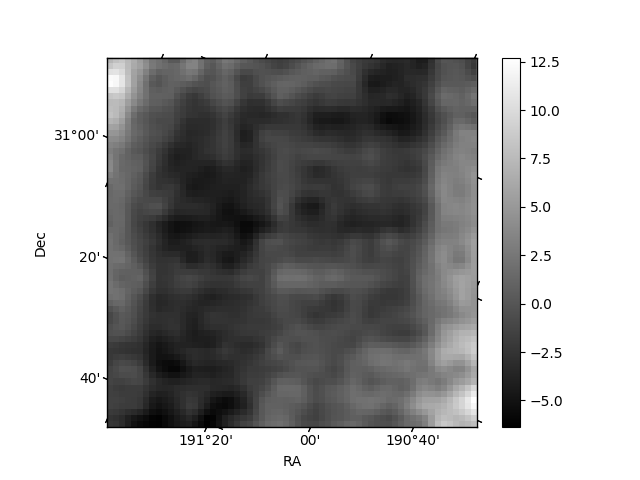
Histogram calculated using DETX and DETY for each event in the final _common_clean file
| Quadrant A | 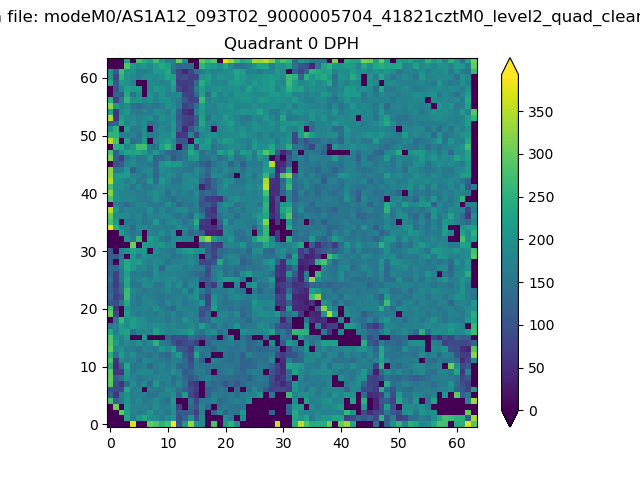 |
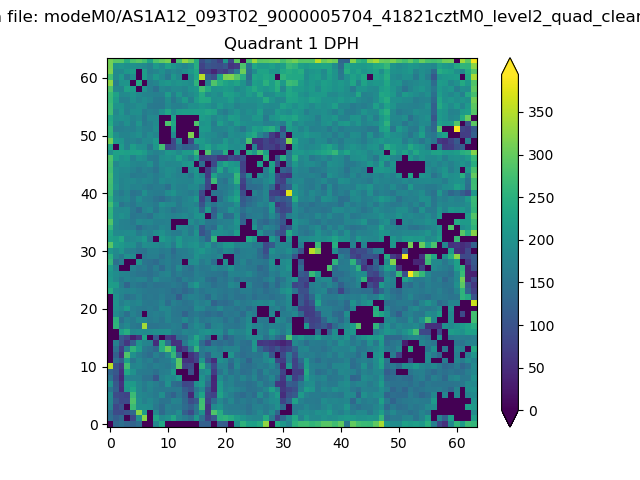 |
Quadrant B |
|---|---|---|---|
| Quadrant D | 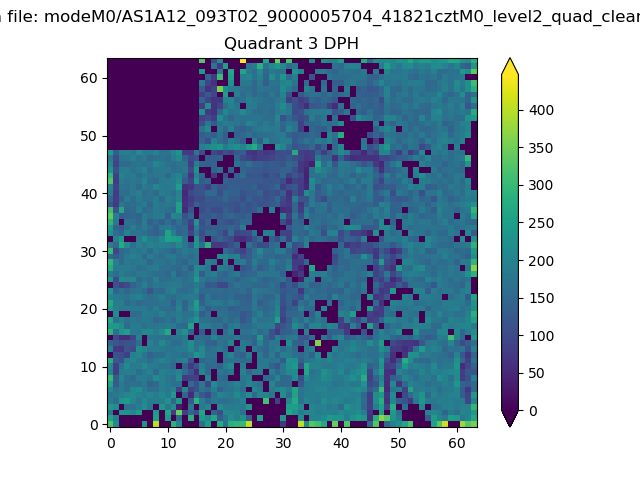 |
 |
Quadrant C |
| Plot type | Count rate plots | Images |
|---|---|---|
| Comparison with Poisson distribution Blue bars denote a histogram of data divided into 1 sec bins. Red curve is a Poisson curve with rate = median count rate of data. |
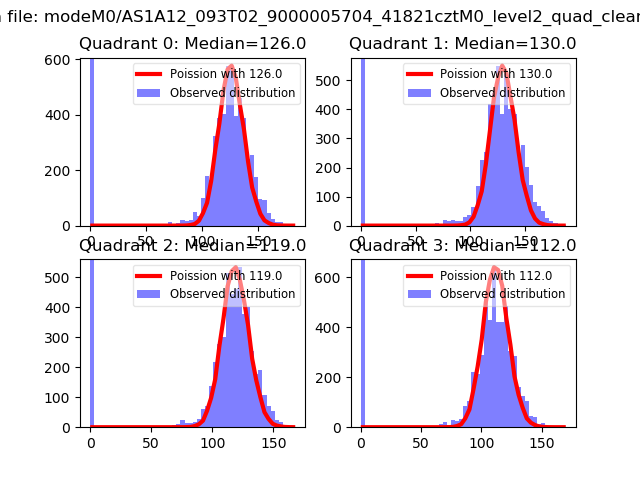 |
 |
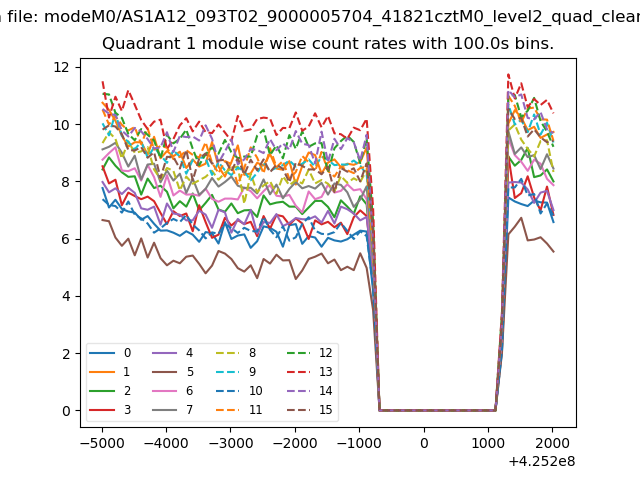
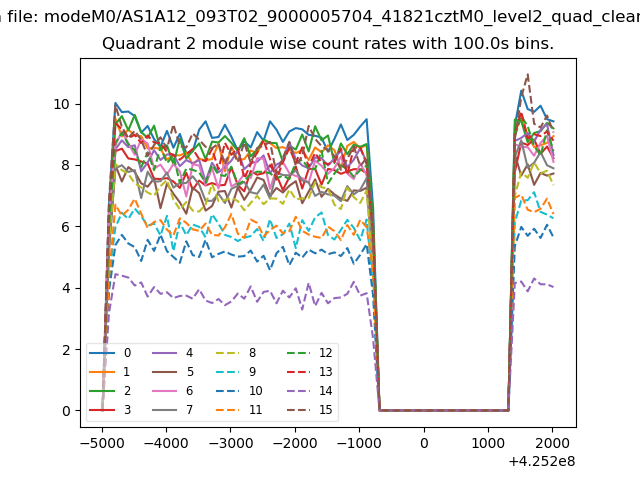
| Quadrant-wise count rates Data is divided into 100 sec bins |
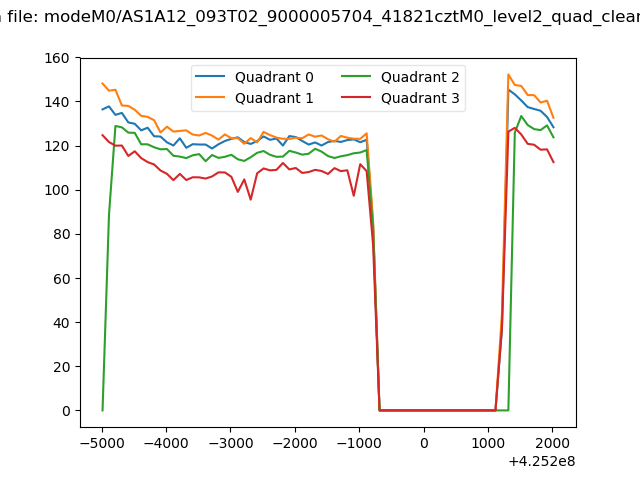 |
|
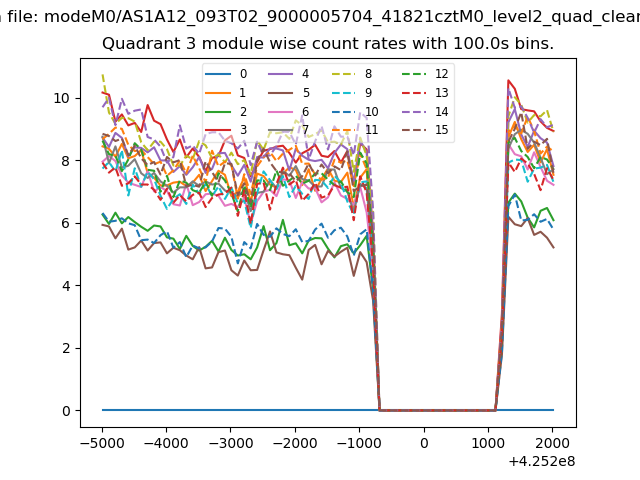
| Module-wise count rates for Quadrant A Data is divided into 100 sec bins |
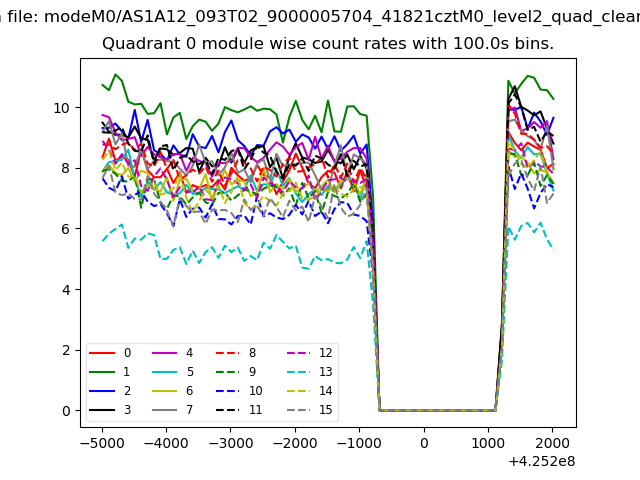 |
 |
| Module-wise count rates for Quadrant B Data is divided into 100 sec bins |
 |
 |
| Module-wise count rates for Quadrant C Data is divided into 100 sec bins |
 |
 |
| Module-wise count rates for Quadrant D Data is divided into 100 sec bins |
 |
 |
| Parameter | Plot |
|---|---|
| CZT HV Monitor | 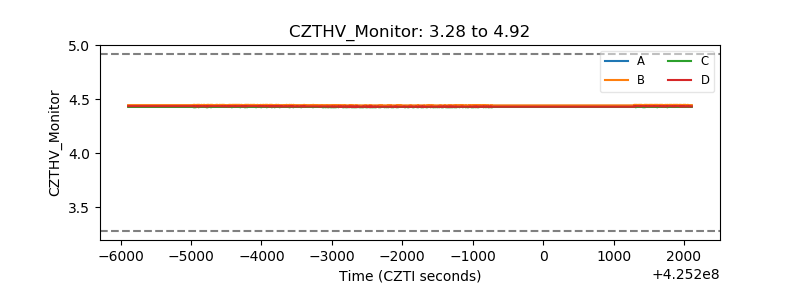 |
| D_VDD |  |
| Temperature 1 | 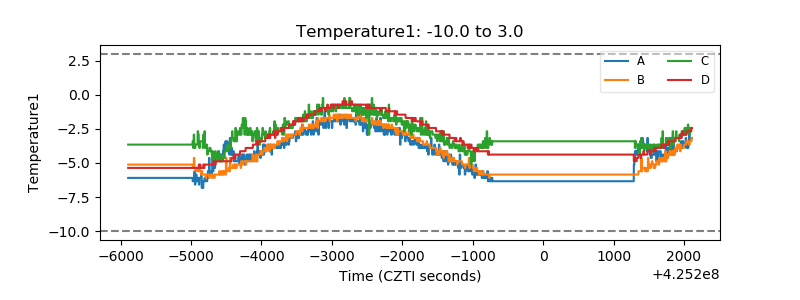 |
| Veto HV Monitor | 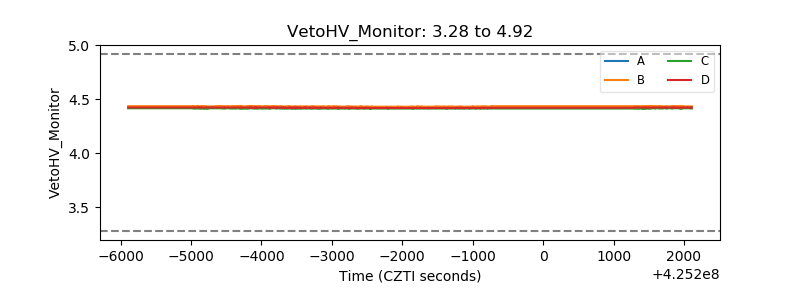 |
| Veto LLD | 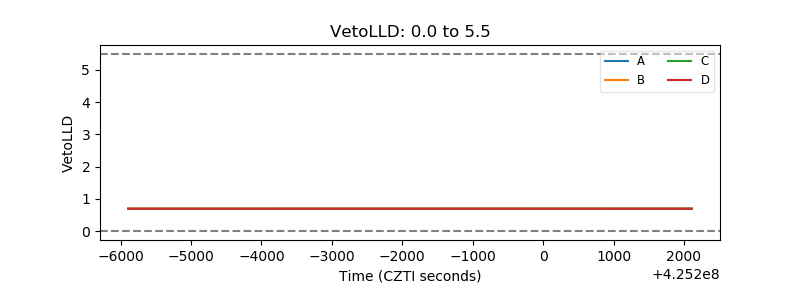 |
| Alpha Counter | 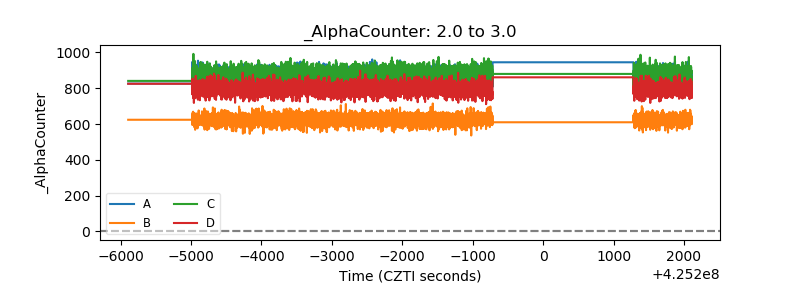 |
| _CPM_Rate | 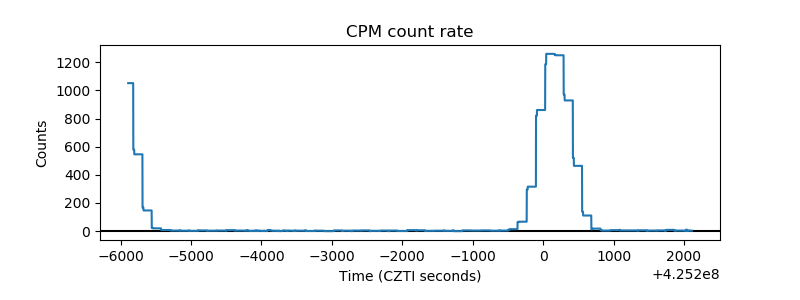 |
| CZT Counter | 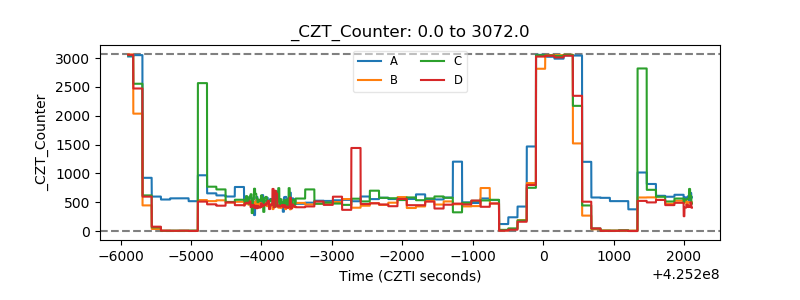 |
| +2.5 Volts monitor |  |
| +5 Volts monitor | 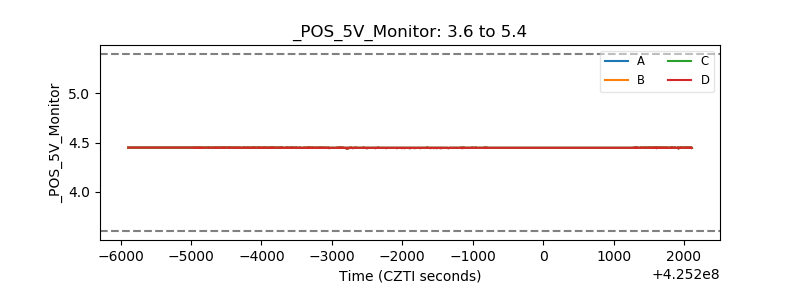 |
| _ROLL_ROT | 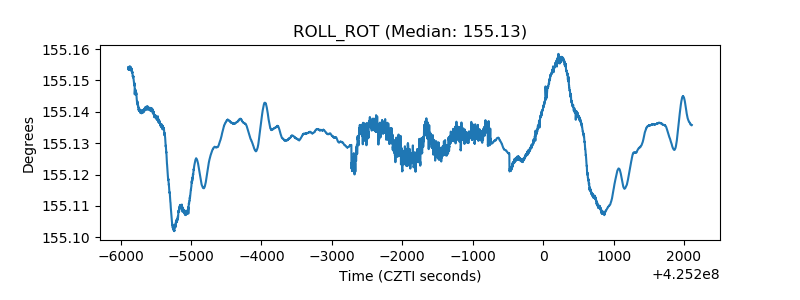 |
| _Roll_DEC | 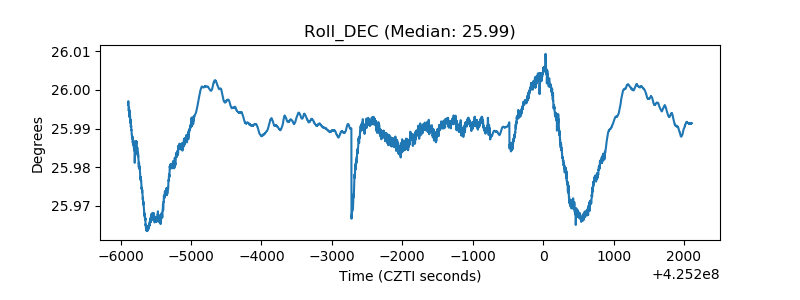 |
| _Roll_RA | 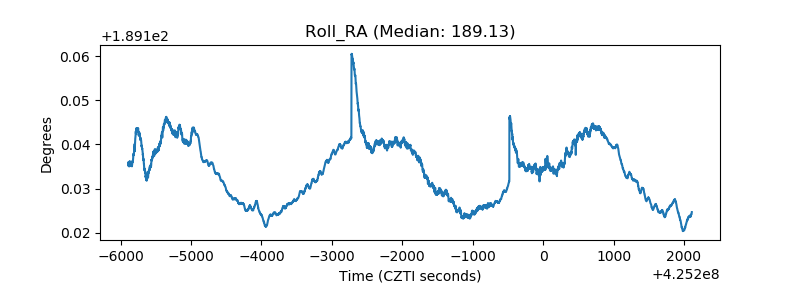 |
| Veto Counter | 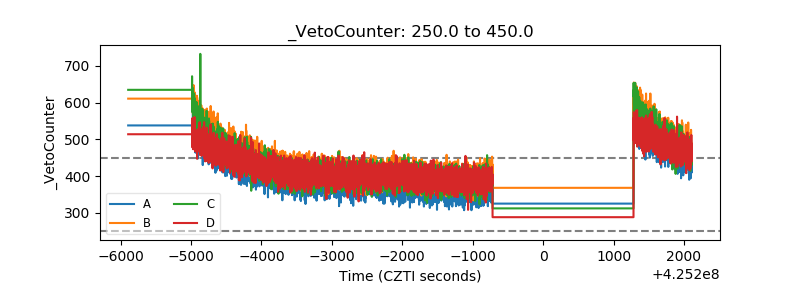 |