| Param | Original file | Final file |
|---|---|---|
| Filename | modeM0/AS1A12_093T02_9000005704_41822cztM0_level2.fits | modeM0/AS1A12_093T02_9000005704_41822cztM0_level2_quad_clean.evt |
| Size (bytes) | 335,116,800 | 90,967,680 |
| Size | 319.6 MB | 86.8 MB |
| Events in quadrant A | 3,238,027 | 633,746 |
| Events in quadrant B | 2,438,139 | 649,985 |
| Events in quadrant C | 3,359,907 | 564,860 |
| Events in quadrant D | 2,983,994 | 559,291 |
| Mode M9 | |||
|---|---|---|---|
| Quadrant | BADHDUFLAG | Total packets | Discarded packets |
| A | 0 | 31 | 0 |
| B | 0 | 32 | 0 |
| C | 0 | 32 | 0 |
| D | 0 | 32 | 0 |
| Mode M0 | |||
|---|---|---|---|
| Quadrant | BADHDUFLAG | Total packets | Discarded packets |
| A | 0 | 12895 | 2 |
| B | 0 | 10140 | 2 |
| C | 0 | 12770 | 2 |
| D | 0 | 11902 | 2 |
| Mode SS | |||
|---|---|---|---|
| Quadrant | BADHDUFLAG | Total packets | Discarded packets |
| A | 0 | 102 | 0 |
| B | 0 | 102 | 0 |
| C | 0 | 102 | 0 |
| D | 0 | 102 | 0 |
| Quadrant | Total seconds | Saturated seconds | Saturation percentage |
|---|---|---|---|
| A | 4943 | 42 | 0.849686% |
| B | 4942 | 5 | 0.101174% |
| C | 4942 | 300 | 6.070417% |
| D | 4942 | 54 | 1.092675% |
Noise dominated data is calculated using 1-second bins in cleaned event files. If a bin has >2000 counts, and if more than 50% of those come from <1% of pixels, then it is considered to be noise-dominated and hence unusable.
| Quadrant | # 1 sec bins | Bins with >0 counts | Bins with >2000 counts | High rate bins dominated by noise | Noise dominated (total time) | Noise dominated (detector-on time) | Marked lightcurve |
|---|---|---|---|---|---|---|---|
| A | 7036 | 4944 | 33 | 33 | 0.47% | 0.67% | 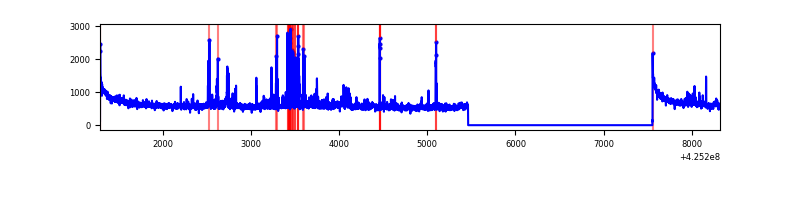 |
| B | 7035 | 4943 | 0 | 0 | 0.00% | 0.00% | 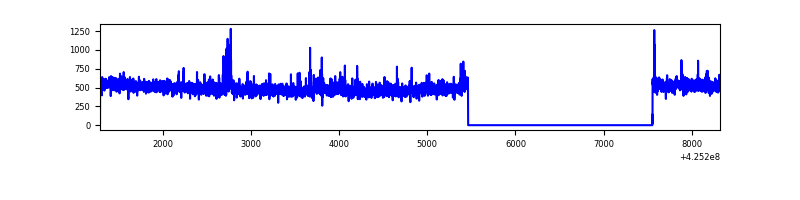 |
| C | 7035 | 4943 | 281 | 281 | 3.99% | 5.68% | 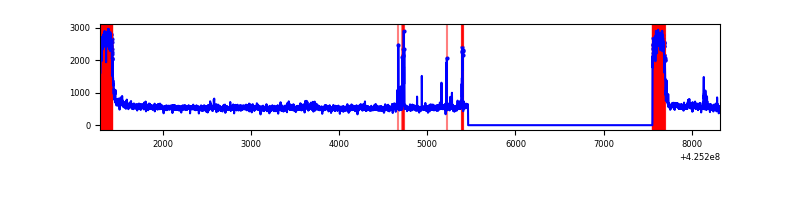 |
| D | 7035 | 4943 | 60 | 60 | 0.85% | 1.21% | 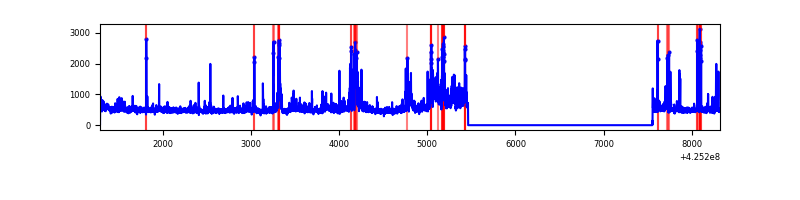 |
Top three noisy pixels from each quadrant. If the there are fewer than three noisy pixels in the level2.evt file, extra rows are filled as -1
| Pixel properties | Quadrant properties | ||||||
|---|---|---|---|---|---|---|---|
| Quadrant | DetID | PixID | Counts | Sigma | Mean | Median | Sigma |
| A | 10 | 83 | 545712 | 4419.69 | 606 | 595 | 123.3 |
| A | 14 | 24 | 175920 | 1421.5 | 606 | 595 | 123.3 |
| A | 12 | 189 | 128649 | 1038.23 | 606 | 595 | 123.3 |
| B | 0 | 245 | 23801 | 202.69 | 598 | 585 | 114.5 |
| B | 0 | 183 | 18542 | 156.77 | 598 | 585 | 114.5 |
| B | 4 | 141 | 14974 | 125.62 | 598 | 585 | 114.5 |
| C | 0 | 10 | 909409 | 7069.73 | 550 | 555 | 128.6 |
| C | 15 | 214 | 198350 | 1538.59 | 550 | 555 | 128.6 |
| C | 14 | 254 | 102910 | 796.19 | 550 | 555 | 128.6 |
| D | 5 | 222 | 372475 | 2610.37 | 585 | 570 | 142.5 |
| D | 13 | 249 | 132335 | 924.85 | 585 | 570 | 142.5 |
| D | 12 | 79 | 100876 | 704.04 | 585 | 570 | 142.5 |
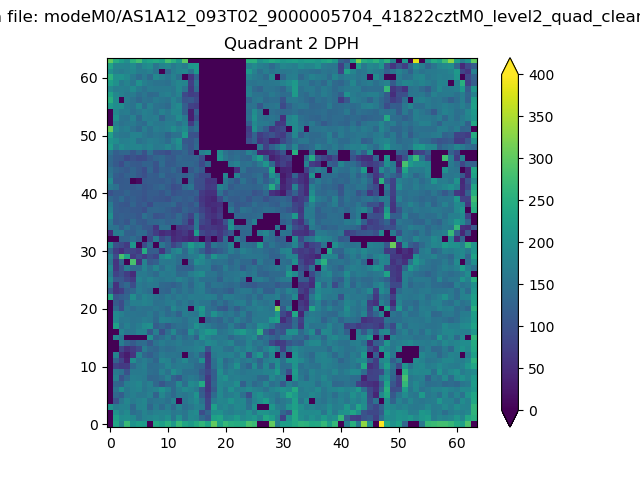
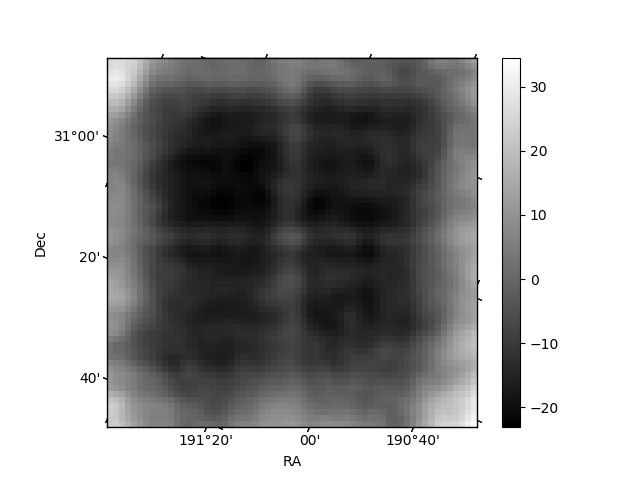
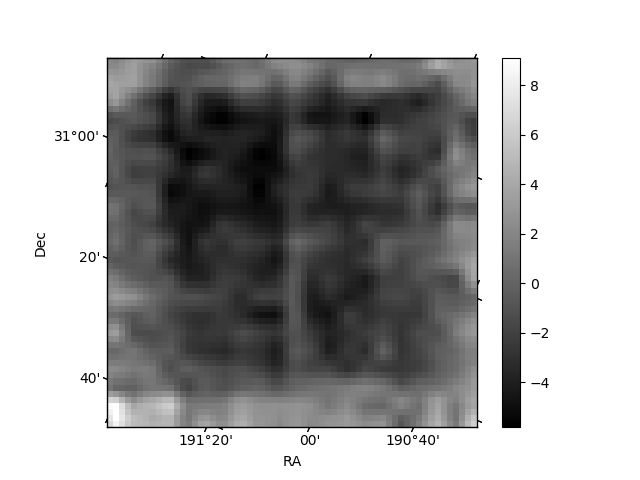
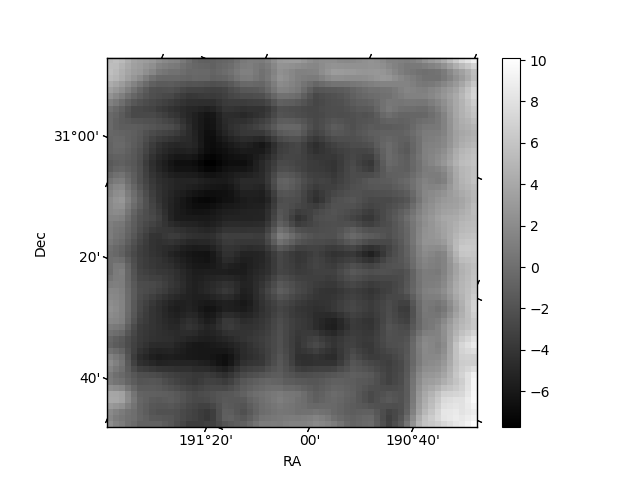
Histogram calculated using DETX and DETY for each event in the final _common_clean file
| Quadrant A | 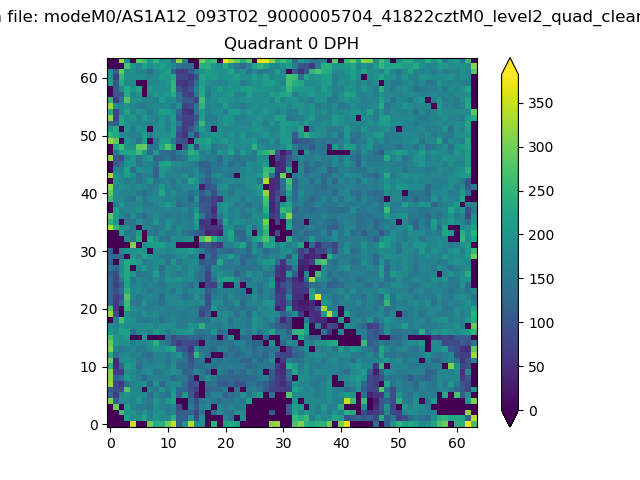 |
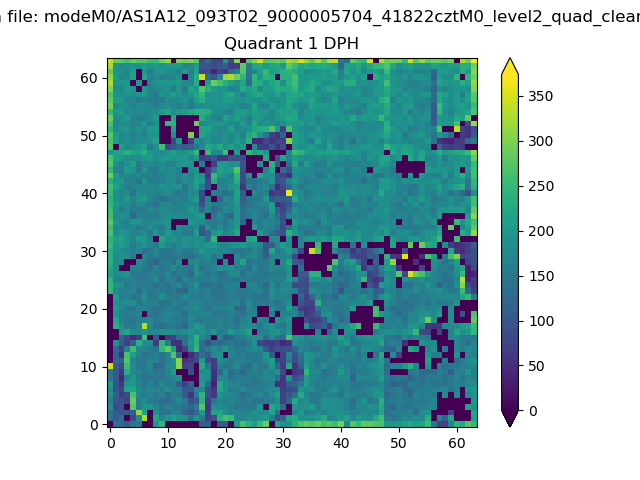 |
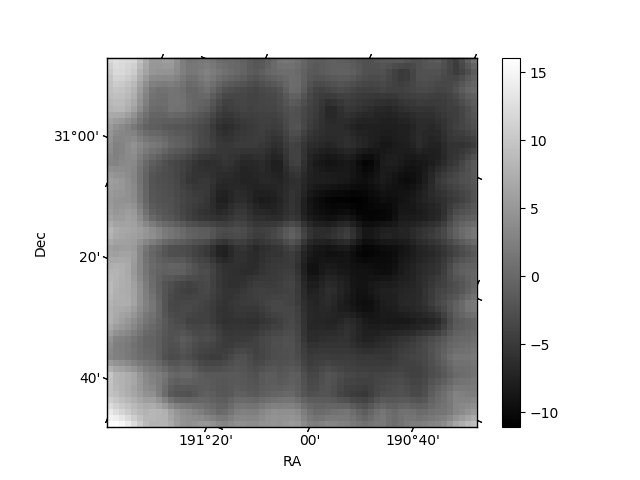
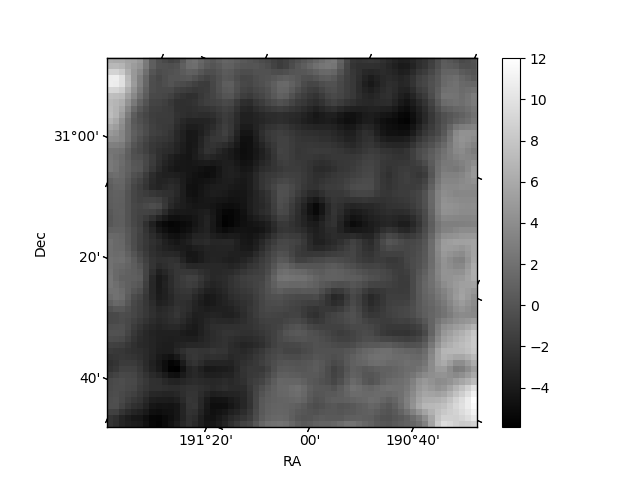
Quadrant B |
|---|---|---|---|
| Quadrant D | 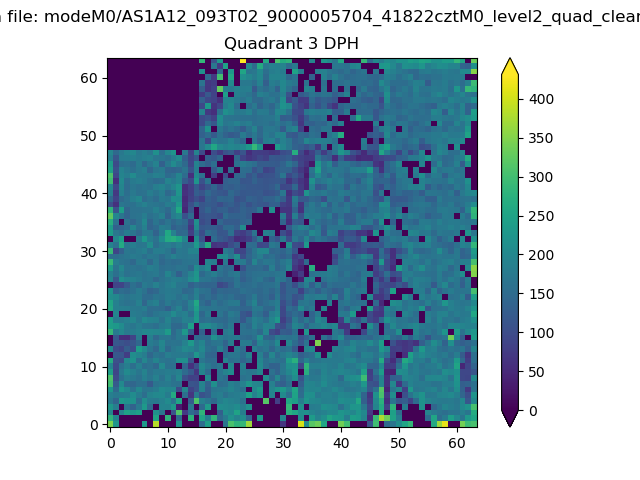 |
 |
Quadrant C |
| Plot type | Count rate plots | Images |
|---|---|---|
| Comparison with Poisson distribution Blue bars denote a histogram of data divided into 1 sec bins. Red curve is a Poisson curve with rate = median count rate of data. |
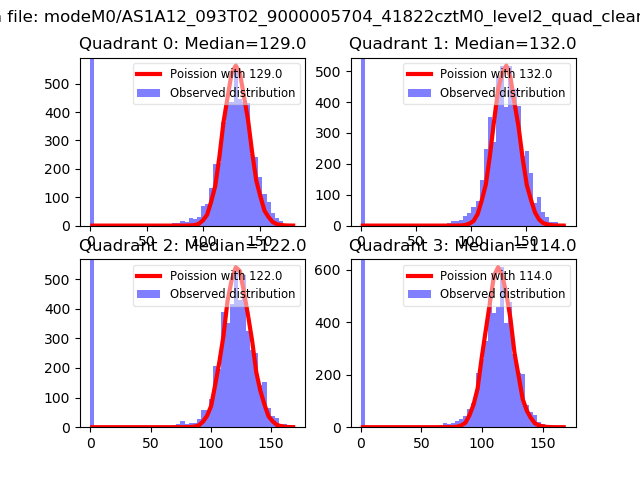 |
 |
| Quadrant-wise count rates Data is divided into 100 sec bins |
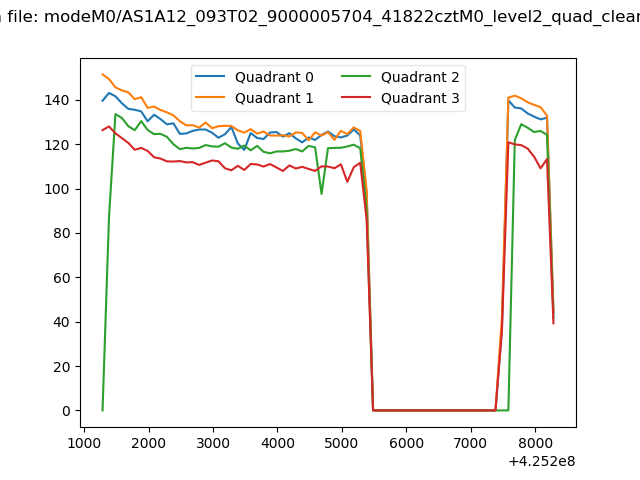 |
|
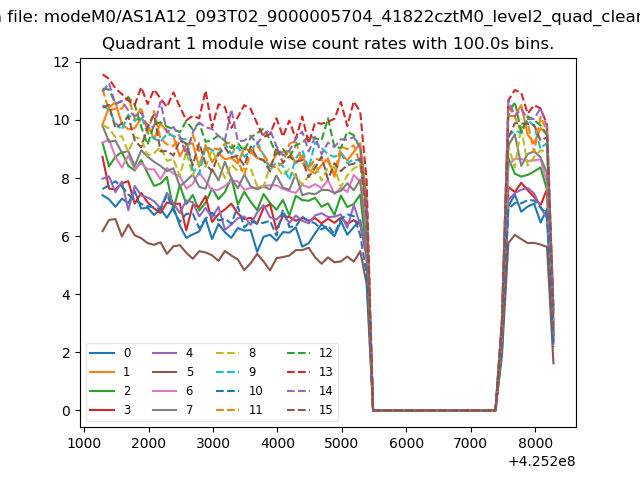
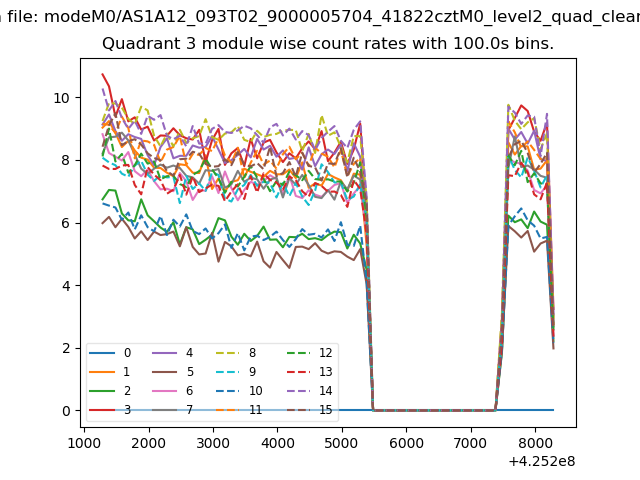
| Module-wise count rates for Quadrant A Data is divided into 100 sec bins |
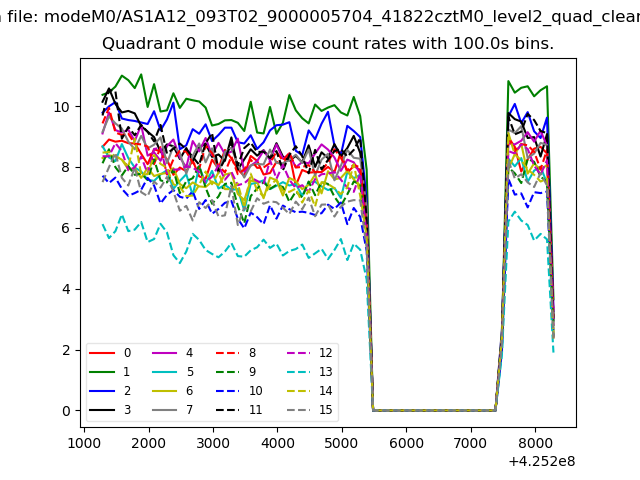 |
 |
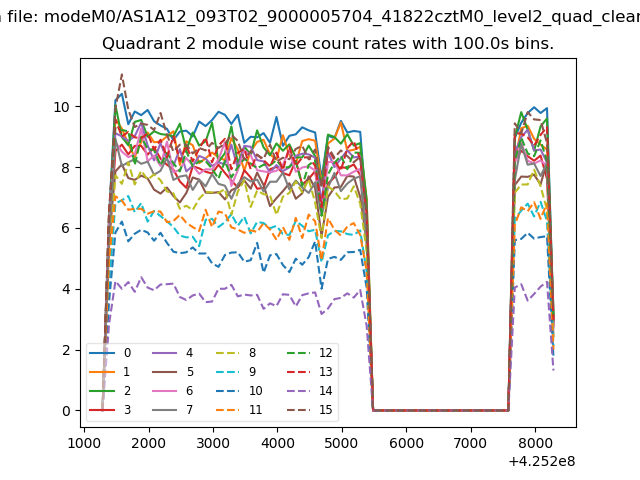
| Module-wise count rates for Quadrant B Data is divided into 100 sec bins |
 |
 |
| Module-wise count rates for Quadrant C Data is divided into 100 sec bins |
 |
 |
| Module-wise count rates for Quadrant D Data is divided into 100 sec bins |
 |
 |
| Parameter | Plot |
|---|---|
| CZT HV Monitor | 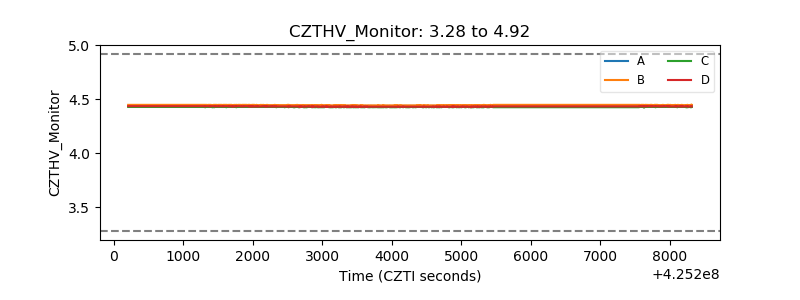 |
| D_VDD | 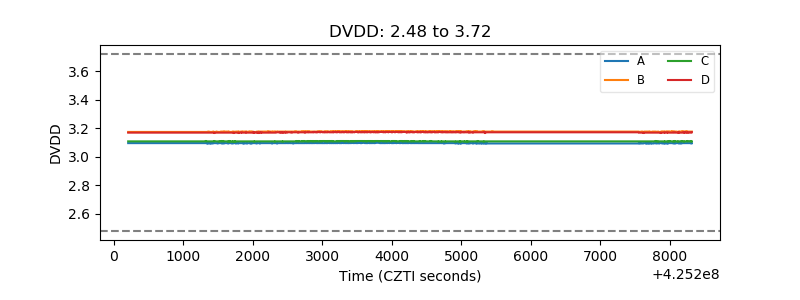 |
| Temperature 1 | 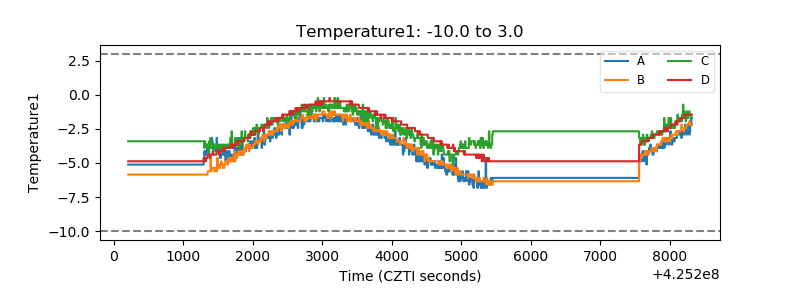 |
| Veto HV Monitor | 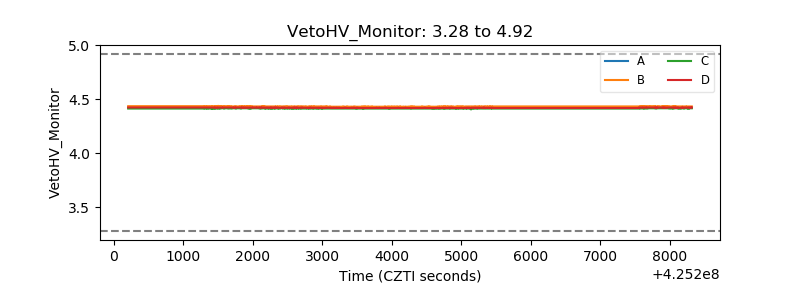 |
| Veto LLD | 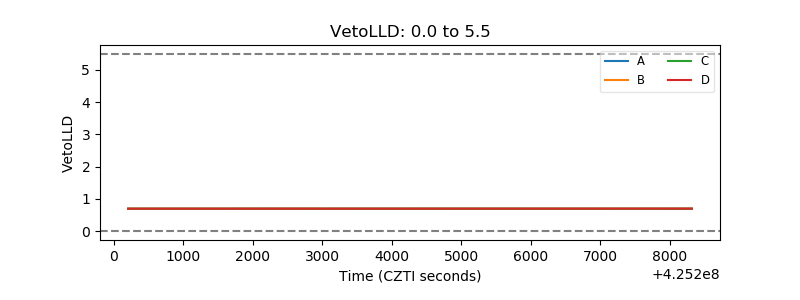 |
| Alpha Counter | 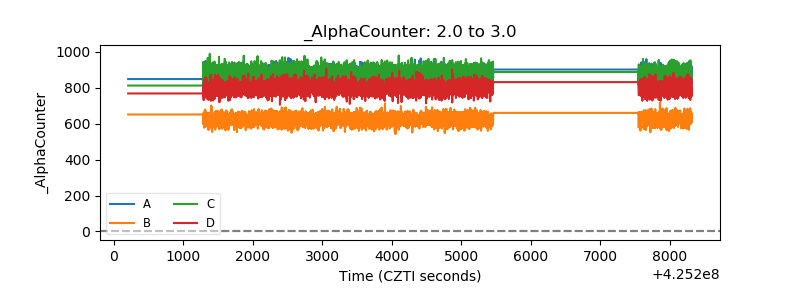 |
| _CPM_Rate | 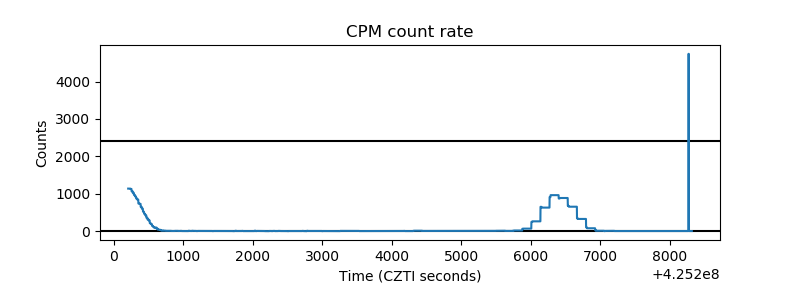 |
| CZT Counter | 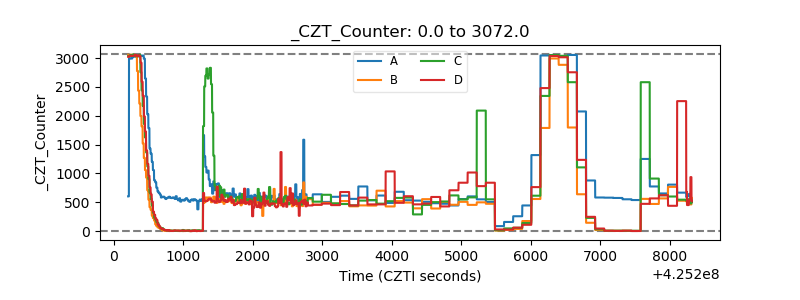 |
| +2.5 Volts monitor |  |
| +5 Volts monitor | 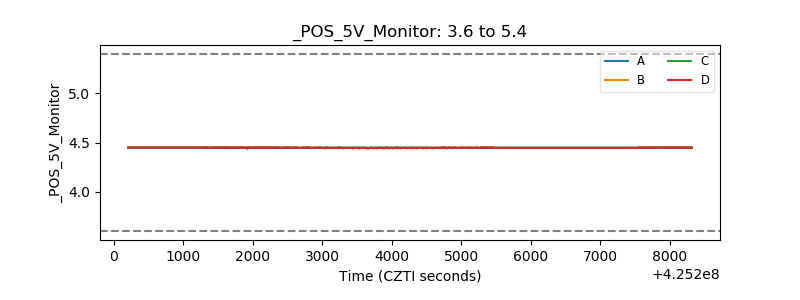 |
| _ROLL_ROT | 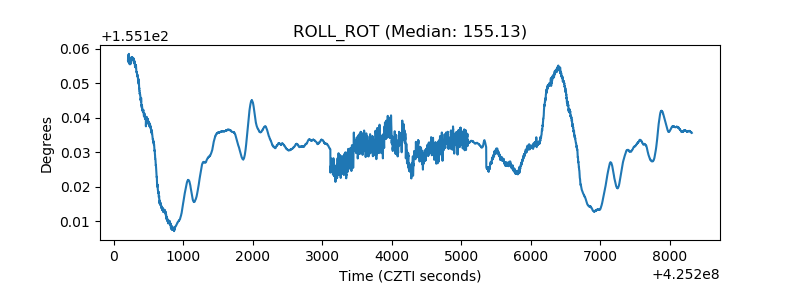 |
| _Roll_DEC | 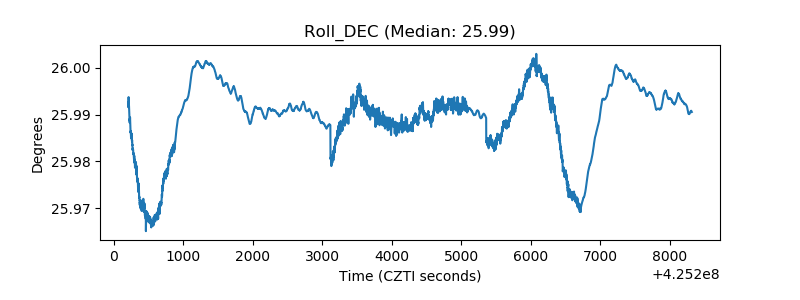 |
| _Roll_RA | 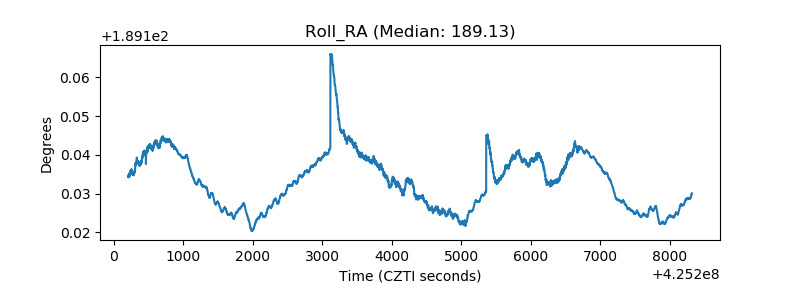 |
| Veto Counter | 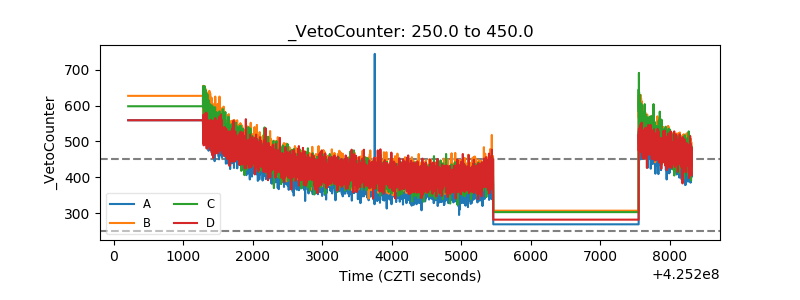 |