| Param | Original file | Final file |
|---|---|---|
| Filename | modeM0/AS1A12_097T03_9000005706_41823cztM0_level2.fits | modeM0/AS1A12_097T03_9000005706_41823cztM0_level2_quad_clean.evt |
| Size (bytes) | 59,189,760 | 13,910,400 |
| Size | 56.4 MB | 13.3 MB |
| Events in quadrant A | 669,274 | 92,251 |
| Events in quadrant B | 366,280 | 100,106 |
| Events in quadrant C | 706,986 | 78,430 |
| Events in quadrant D | 382,285 | 86,837 |
| Mode M0 | |||
|---|---|---|---|
| Quadrant | BADHDUFLAG | Total packets | Discarded packets |
| A | 0 | 2539 | 1 |
| B | 0 | 1630 | 1 |
| C | 0 | 2616 | 1 |
| D | 0 | 1713 | 1 |
| Mode SS | |||
|---|---|---|---|
| Quadrant | BADHDUFLAG | Total packets | Discarded packets |
| A | 0 | 16 | 0 |
| B | 0 | 16 | 0 |
| C | 0 | 16 | 0 |
| D | 0 | 16 | 0 |
| Mode M9 | |||
|---|---|---|---|
| Quadrant | BADHDUFLAG | Total packets | Discarded packets |
| A | 0 | 19 | 0 |
| B | 0 | 19 | 0 |
| C | 0 | 19 | 0 |
| D | 0 | 19 | 0 |
| Quadrant | Total seconds | Saturated seconds | Saturation percentage |
|---|---|---|---|
| A | 810 | 55 | 6.790123% |
| B | 809 | 1 | 0.123609% |
| C | 809 | 127 | 15.698393% |
| D | 809 | 4 | 0.494438% |
Noise dominated data is calculated using 1-second bins in cleaned event files. If a bin has >2000 counts, and if more than 50% of those come from <1% of pixels, then it is considered to be noise-dominated and hence unusable.
| Quadrant | # 1 sec bins | Bins with >0 counts | Bins with >2000 counts | High rate bins dominated by noise | Noise dominated (total time) | Noise dominated (detector-on time) | Marked lightcurve |
|---|---|---|---|---|---|---|---|
| A | 810 | 810 | 52 | 52 | 6.42% | 6.42% | 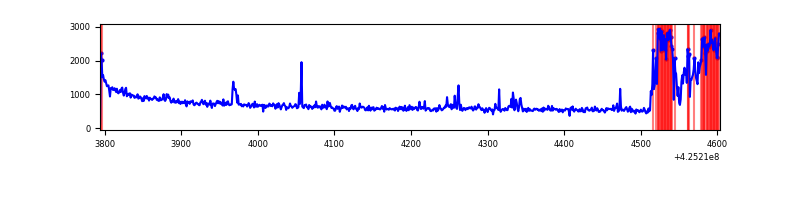 |
| B | 809 | 809 | 0 | 0 | 0.00% | 0.00% | 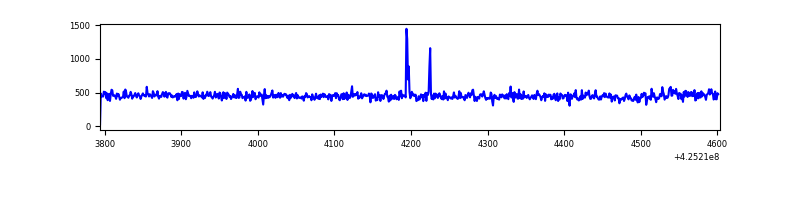 |
| C | 809 | 809 | 126 | 126 | 15.57% | 15.57% | 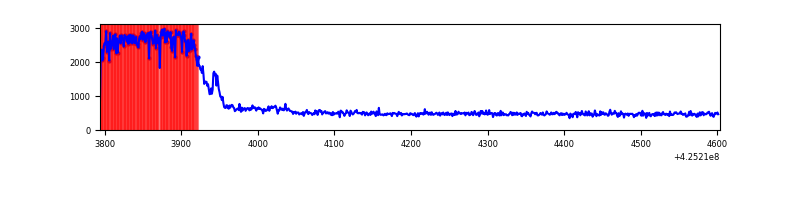 |
| D | 809 | 809 | 4 | 4 | 0.49% | 0.49% |  |
Top three noisy pixels from each quadrant. If the there are fewer than three noisy pixels in the level2.evt file, extra rows are filled as -1
| Pixel properties | Quadrant properties | ||||||
|---|---|---|---|---|---|---|---|
| Quadrant | DetID | PixID | Counts | Sigma | Mean | Median | Sigma |
| A | 14 | 24 | 145765 | 7363.25 | 90 | 89 | 19.8 |
| A | 10 | 83 | 145362 | 7342.88 | 90 | 89 | 19.8 |
| A | 7 | 3 | 19583 | 985.33 | 90 | 89 | 19.8 |
| B | 0 | 246 | 4326 | 215.16 | 91 | 89 | 19.7 |
| B | 0 | 245 | 2130 | 103.64 | 91 | 89 | 19.7 |
| B | 12 | 111 | 2116 | 102.93 | 91 | 89 | 19.7 |
| C | 0 | 10 | 371764 | 18859.09 | 76 | 76 | 19.7 |
| C | 15 | 214 | 33143 | 1677.79 | 76 | 76 | 19.7 |
| C | 14 | 254 | 2332 | 114.47 | 76 | 76 | 19.7 |
| D | 13 | 249 | 30368 | 1307.82 | 88 | 85 | 23.2 |
| D | 2 | 234 | 3347 | 140.87 | 88 | 85 | 23.2 |
| D | 2 | 249 | 3308 | 139.19 | 88 | 85 | 23.2 |
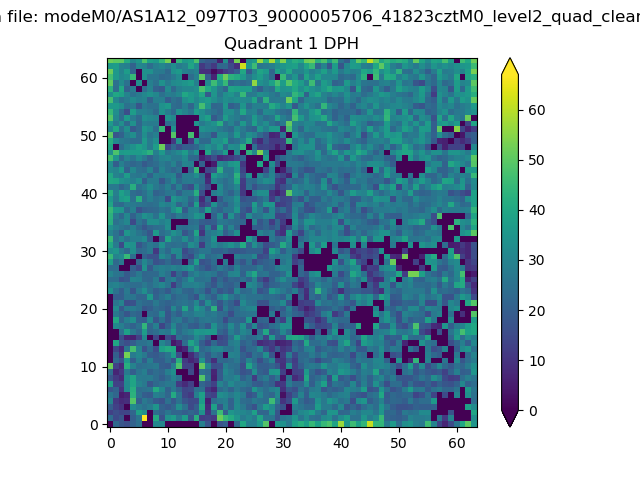
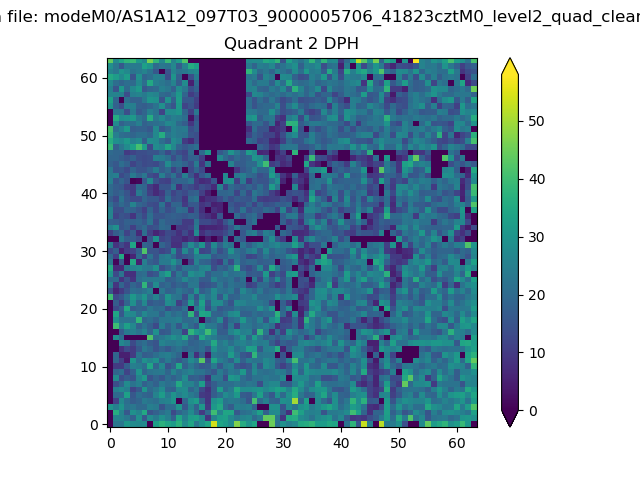
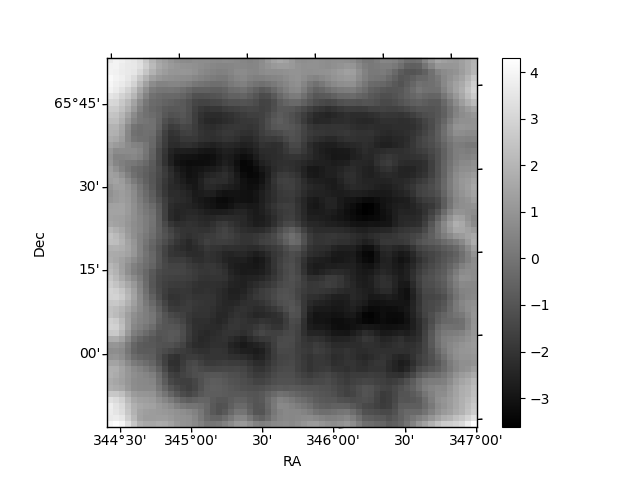
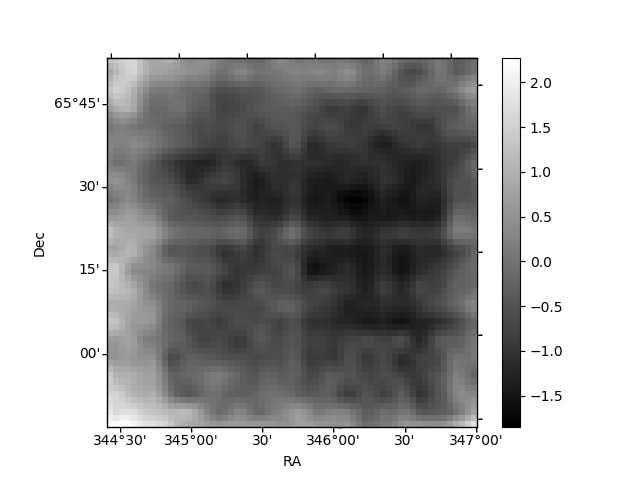
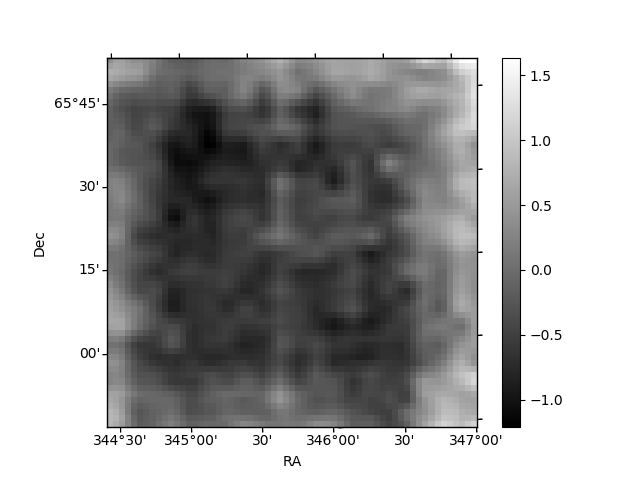
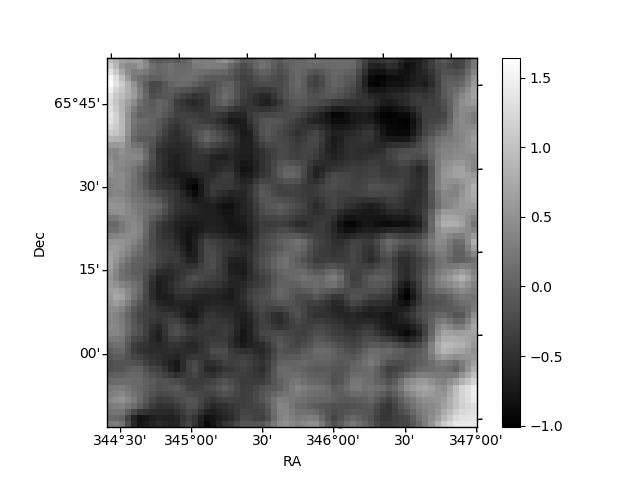
Histogram calculated using DETX and DETY for each event in the final _common_clean file
| Quadrant A | 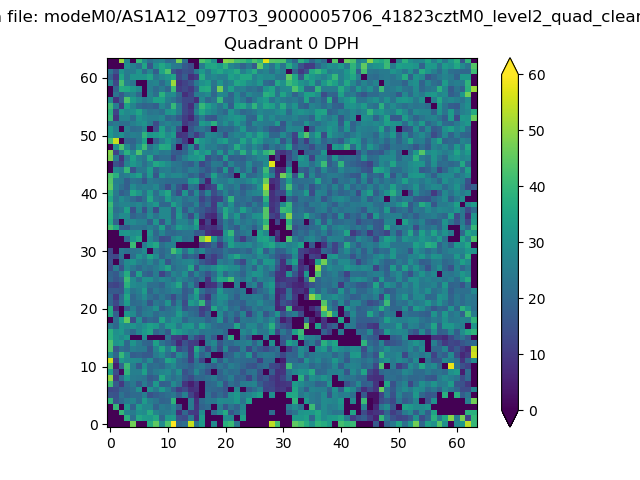 |
 |
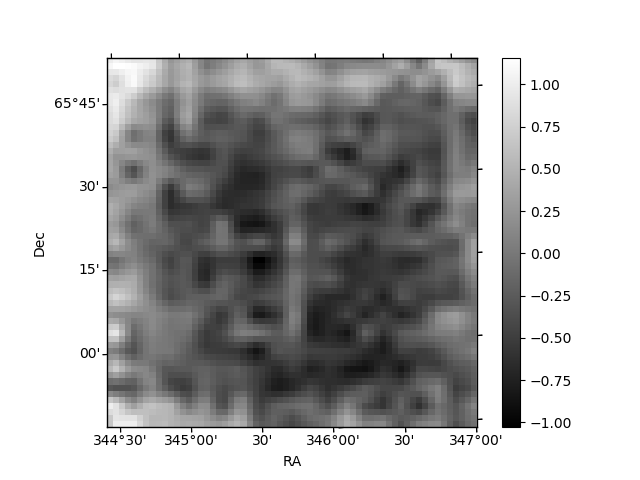
Quadrant B |
|---|---|---|---|
| Quadrant D | 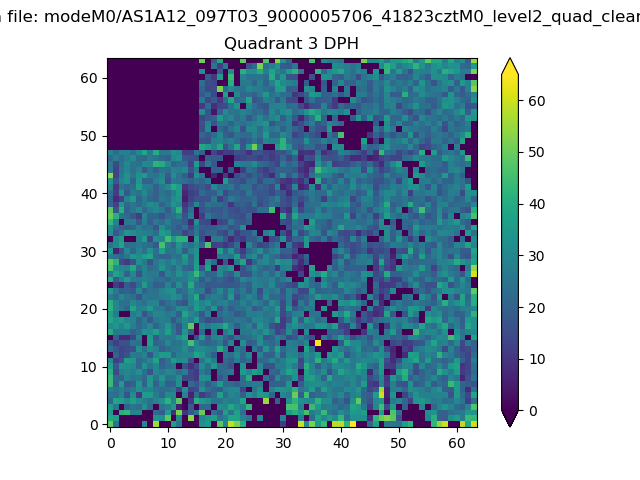 |
 |
Quadrant C |
| Plot type | Count rate plots | Images |
|---|---|---|
| Comparison with Poisson distribution Blue bars denote a histogram of data divided into 1 sec bins. Red curve is a Poisson curve with rate = median count rate of data. |
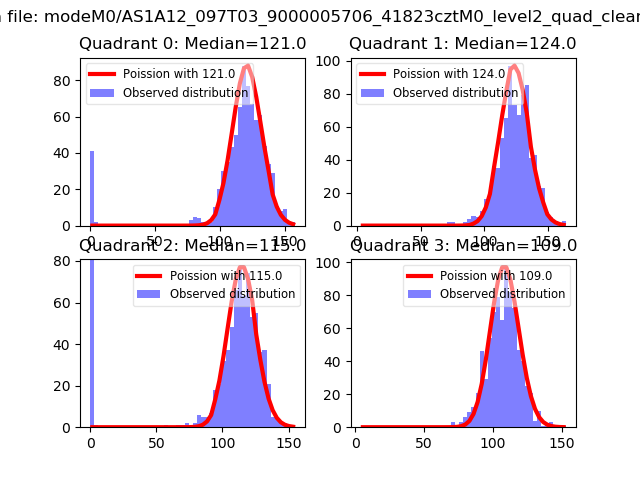 |
 |
| Quadrant-wise count rates Data is divided into 100 sec bins |
 |
|
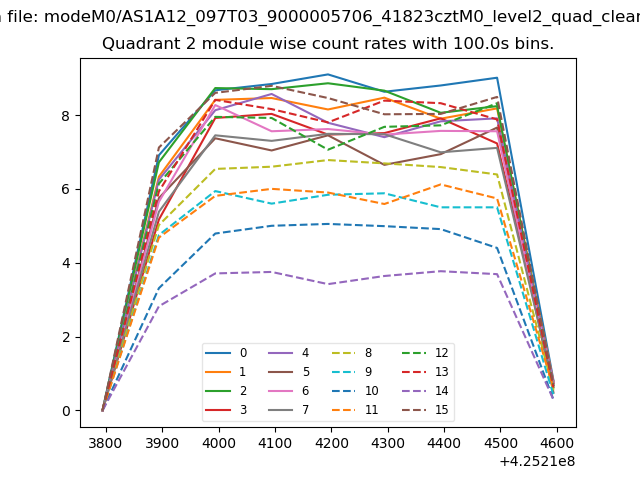
| Module-wise count rates for Quadrant A Data is divided into 100 sec bins |
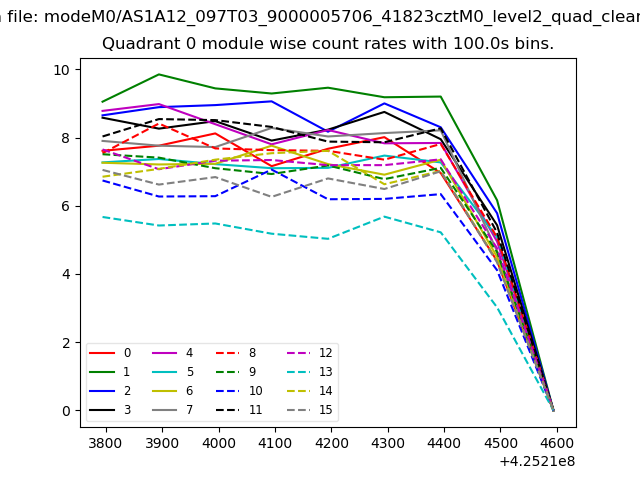 |
 |
| Module-wise count rates for Quadrant B Data is divided into 100 sec bins |
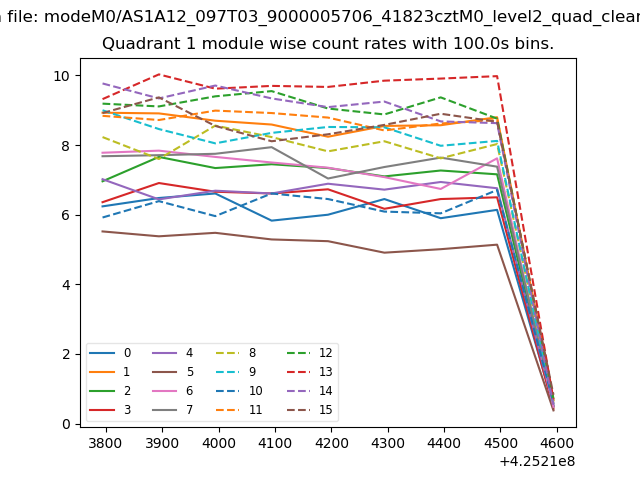 |
 |
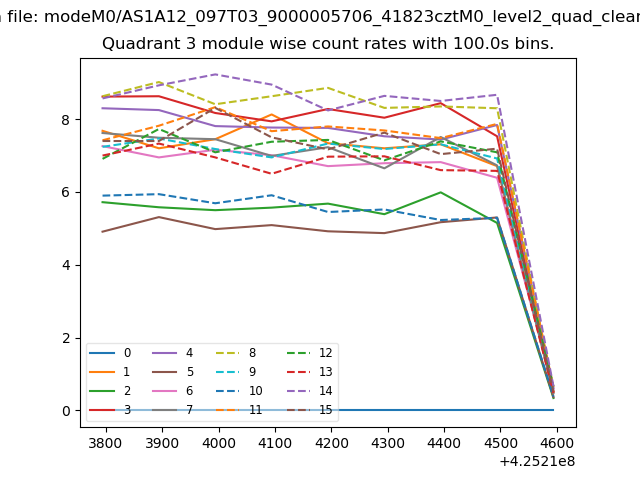
| Module-wise count rates for Quadrant C Data is divided into 100 sec bins |
 |
 |
| Module-wise count rates for Quadrant D Data is divided into 100 sec bins |
 |
 |
| Parameter | Plot |
|---|---|
| CZT HV Monitor | 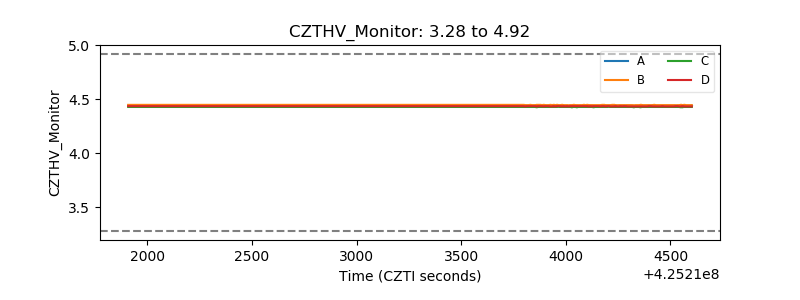 |
| D_VDD | 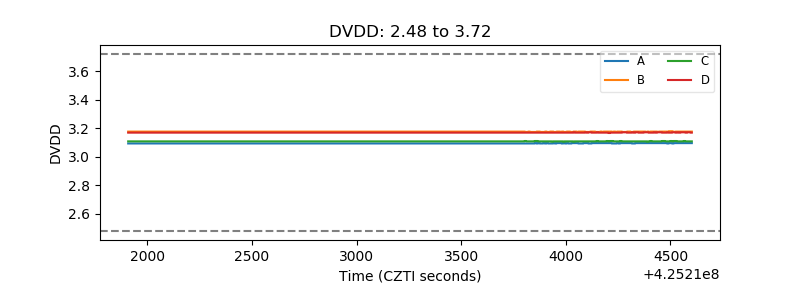 |
| Temperature 1 | 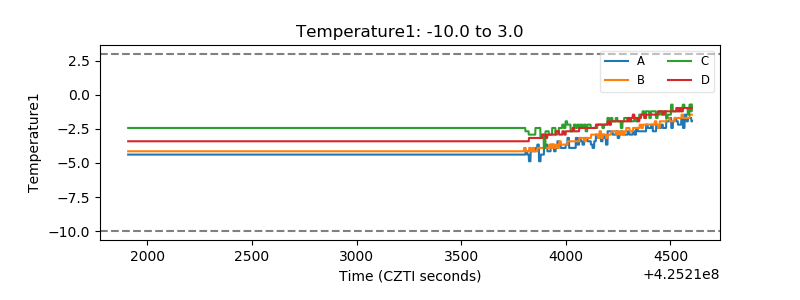 |
| Veto HV Monitor | 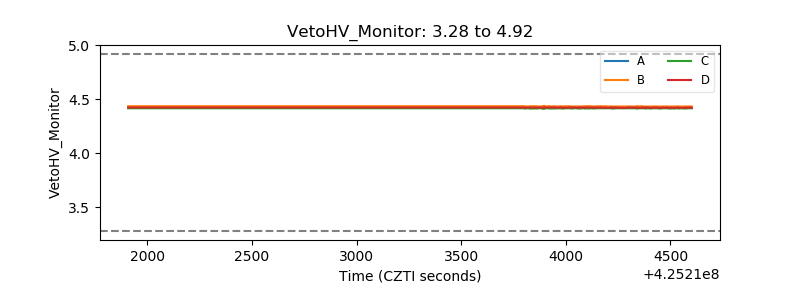 |
| Veto LLD | 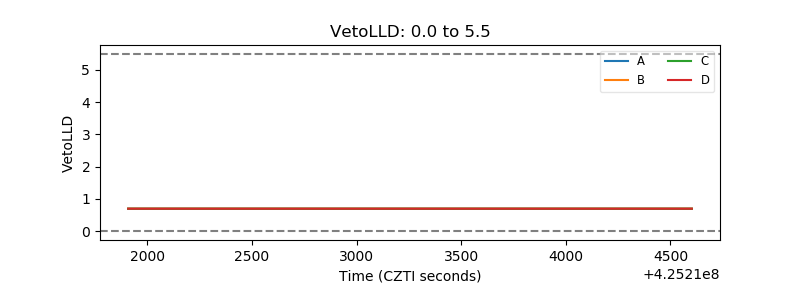 |
| Alpha Counter | 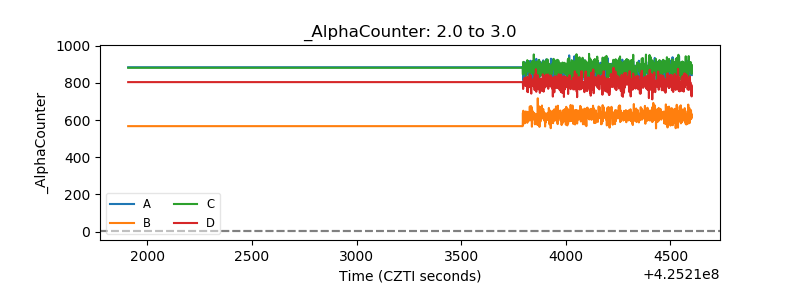 |
| _CPM_Rate | 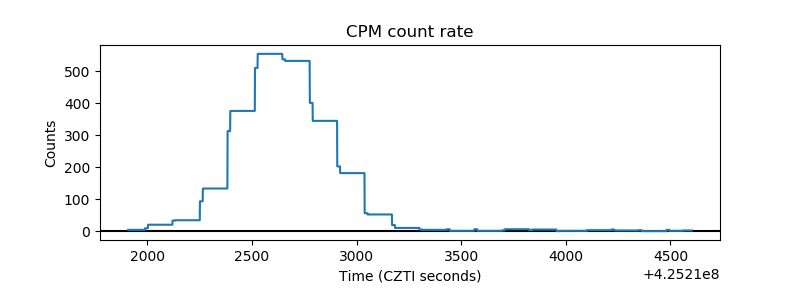 |
| CZT Counter | 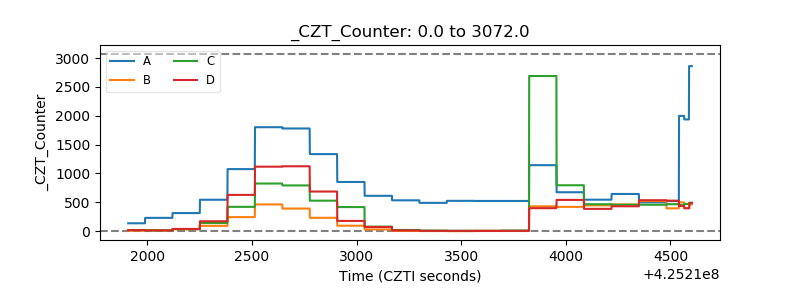 |
| +2.5 Volts monitor | 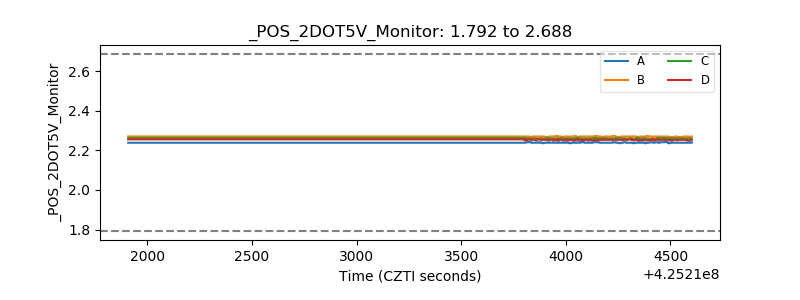 |
| +5 Volts monitor |  |
| _ROLL_ROT | 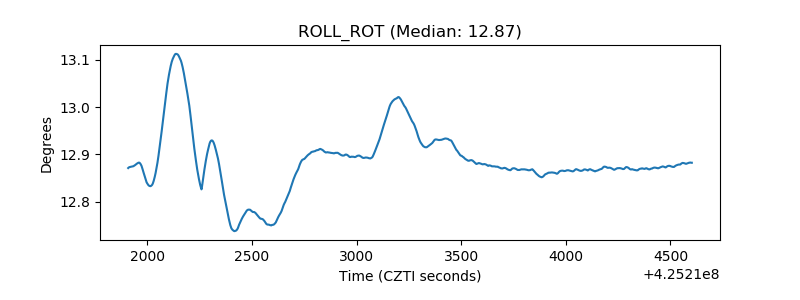 |
| _Roll_DEC | 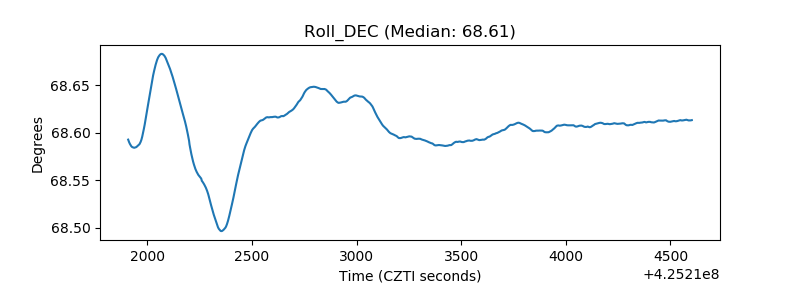 |
| _Roll_RA | 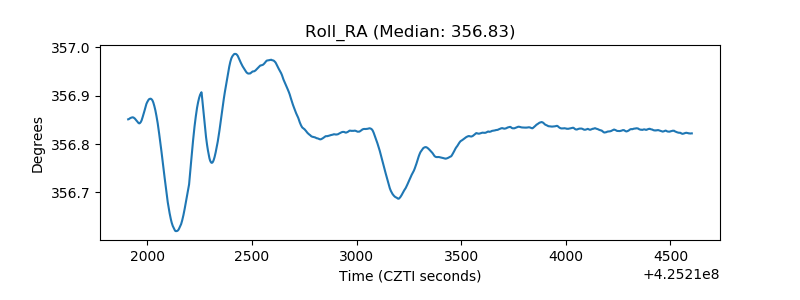 |
| Veto Counter | 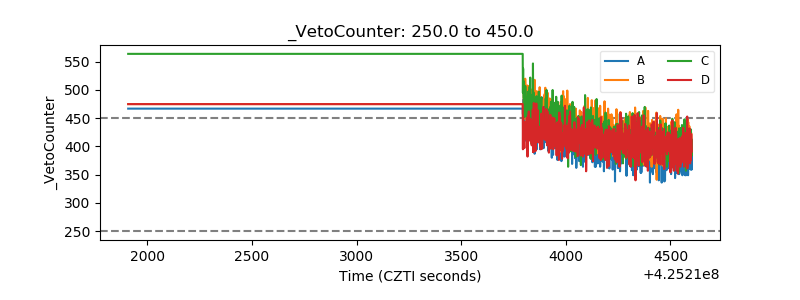 |