| Param | Original file | Final file |
|---|---|---|
| Filename | modeM0/AS1A12_097T03_9000005706_41824cztM0_level2.fits | modeM0/AS1A12_097T03_9000005706_41824cztM0_level2_quad_clean.evt |
| Size (bytes) | 314,737,920 | 84,015,360 |
| Size | 300.2 MB | 80.1 MB |
| Events in quadrant A | 3,106,048 | 569,958 |
| Events in quadrant B | 2,309,994 | 590,179 |
| Events in quadrant C | 3,095,706 | 523,025 |
| Events in quadrant D | 2,750,147 | 511,398 |
| Mode M0 | |||
|---|---|---|---|
| Quadrant | BADHDUFLAG | Total packets | Discarded packets |
| A | 0 | 12136 | 2 |
| B | 0 | 10324 | 2 |
| C | 0 | 12075 | 2 |
| D | 0 | 11436 | 2 |
| Mode SS | |||
|---|---|---|---|
| Quadrant | BADHDUFLAG | Total packets | Discarded packets |
| A | 0 | 102 | 0 |
| B | 0 | 102 | 0 |
| C | 0 | 102 | 0 |
| D | 0 | 102 | 0 |
| Mode M9 | |||
|---|---|---|---|
| Quadrant | BADHDUFLAG | Total packets | Discarded packets |
| A | 0 | 22 | 0 |
| B | 0 | 23 | 0 |
| C | 0 | 23 | 0 |
| D | 0 | 23 | 0 |
| Quadrant | Total seconds | Saturated seconds | Saturation percentage |
|---|---|---|---|
| A | 4984 | 144 | 2.889246% |
| B | 4984 | 24 | 0.481541% |
| C | 4984 | 255 | 5.116372% |
| D | 4984 | 59 | 1.183788% |
Noise dominated data is calculated using 1-second bins in cleaned event files. If a bin has >2000 counts, and if more than 50% of those come from <1% of pixels, then it is considered to be noise-dominated and hence unusable.
| Quadrant | # 1 sec bins | Bins with >0 counts | Bins with >2000 counts | High rate bins dominated by noise | Noise dominated (total time) | Noise dominated (detector-on time) | Marked lightcurve |
|---|---|---|---|---|---|---|---|
| A | 7078 | 4985 | 136 | 136 | 1.92% | 2.73% | 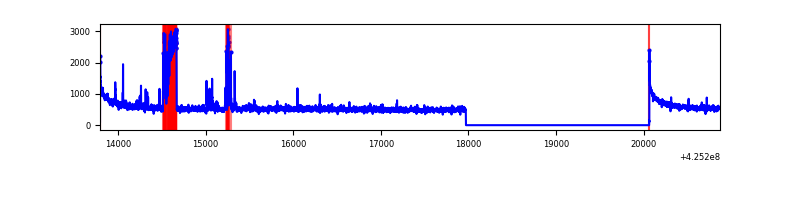 |
| B | 7078 | 4985 | 13 | 13 | 0.18% | 0.26% | 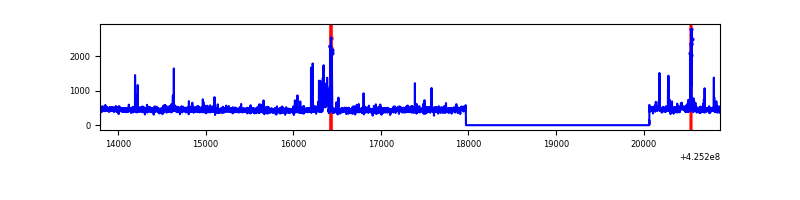 |
| C | 7078 | 4985 | 250 | 250 | 3.53% | 5.02% | 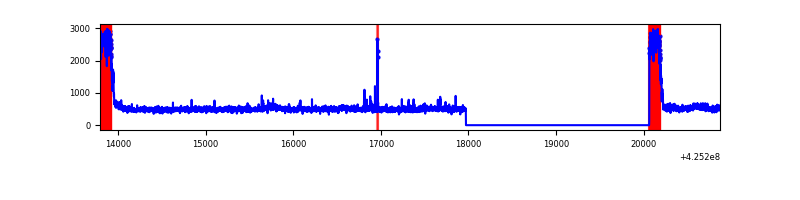 |
| D | 7078 | 4985 | 57 | 57 | 0.81% | 1.14% | 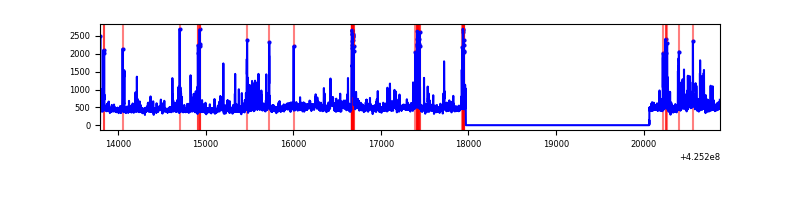 |
Top three noisy pixels from each quadrant. If the there are fewer than three noisy pixels in the level2.evt file, extra rows are filled as -1
| Pixel properties | Quadrant properties | ||||||
|---|---|---|---|---|---|---|---|
| Quadrant | DetID | PixID | Counts | Sigma | Mean | Median | Sigma |
| A | 10 | 83 | 548480 | 4987.26 | 547 | 538 | 109.9 |
| A | 14 | 24 | 392502 | 3567.58 | 547 | 538 | 109.9 |
| A | 7 | 3 | 23600 | 209.91 | 547 | 538 | 109.9 |
| B | 3 | 112 | 65197 | 617.79 | 548 | 534 | 104.7 |
| B | 0 | 245 | 32954 | 309.74 | 548 | 534 | 104.7 |
| B | 0 | 183 | 15145 | 139.59 | 548 | 534 | 104.7 |
| C | 0 | 10 | 858850 | 7272.91 | 514 | 517 | 118.0 |
| C | 15 | 214 | 200342 | 1693.18 | 514 | 517 | 118.0 |
| C | 15 | 159 | 16931 | 139.08 | 514 | 517 | 118.0 |
| D | 12 | 79 | 166495 | 1273.76 | 538 | 523 | 130.3 |
| D | 5 | 222 | 159903 | 1223.17 | 538 | 523 | 130.3 |
| D | 13 | 249 | 154496 | 1181.67 | 538 | 523 | 130.3 |
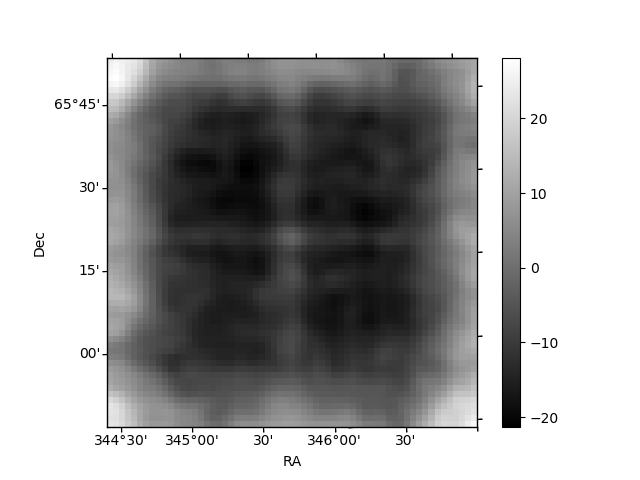
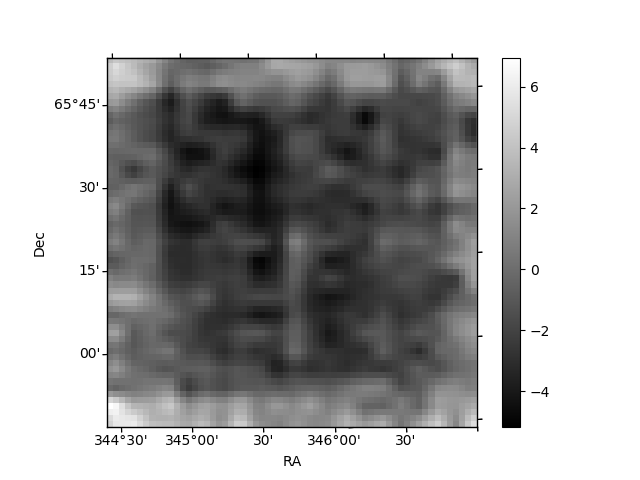
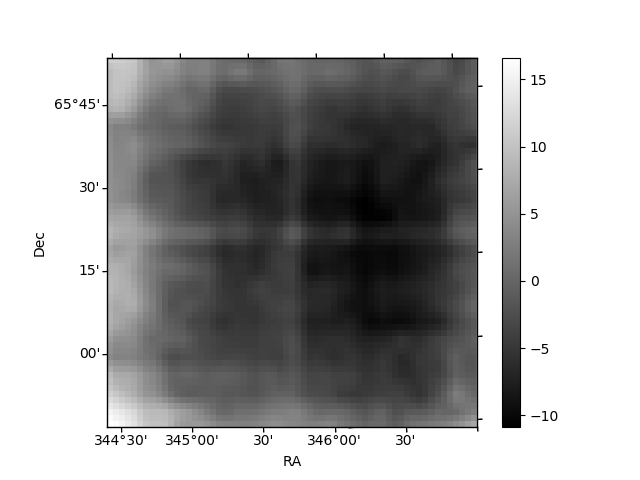
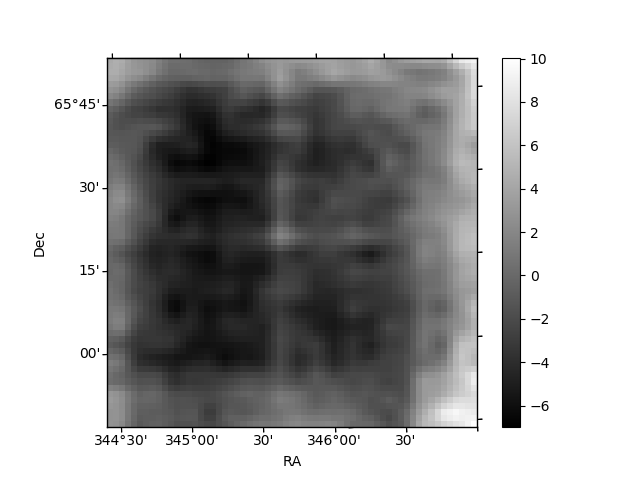
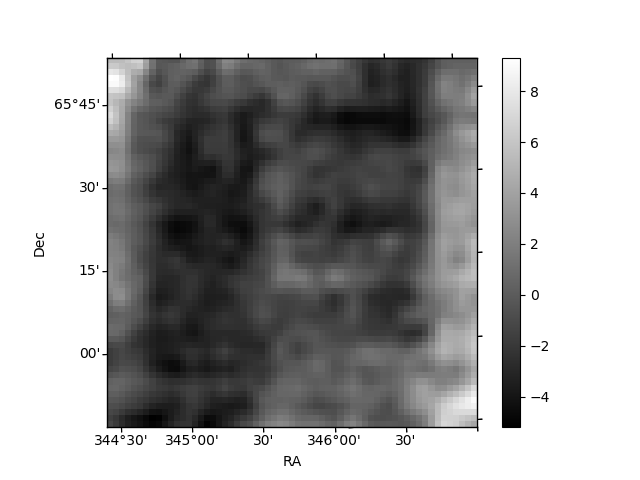
Histogram calculated using DETX and DETY for each event in the final _common_clean file
| Quadrant A | 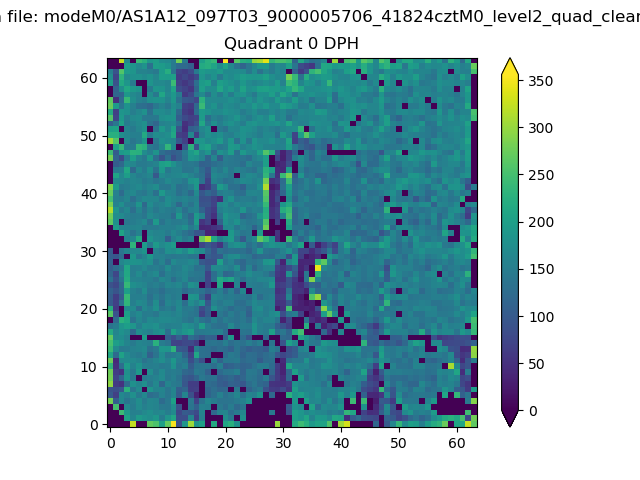 |
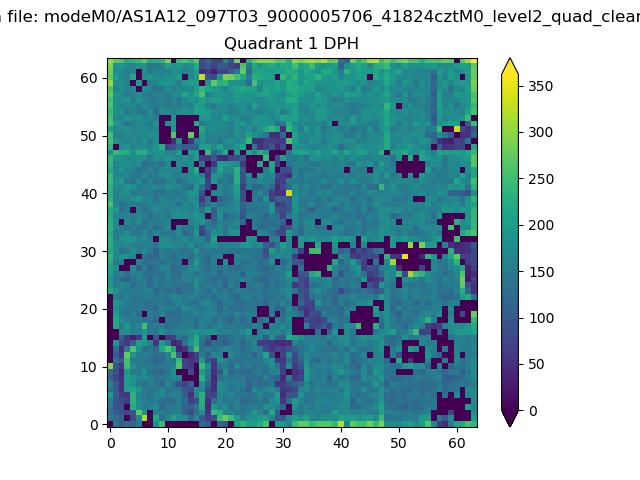 |
Quadrant B |
|---|---|---|---|
| Quadrant D | 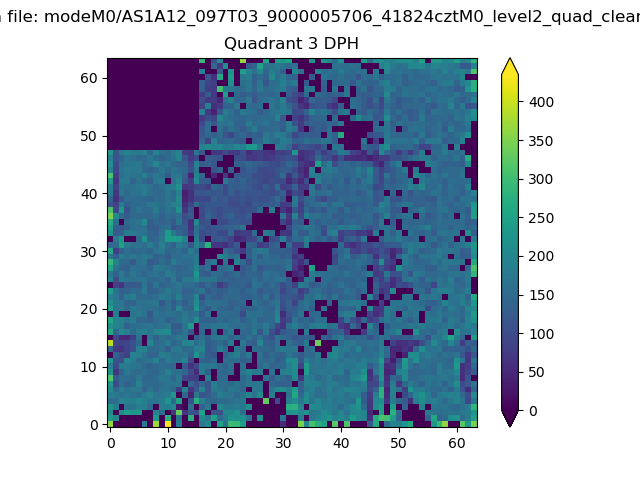 |
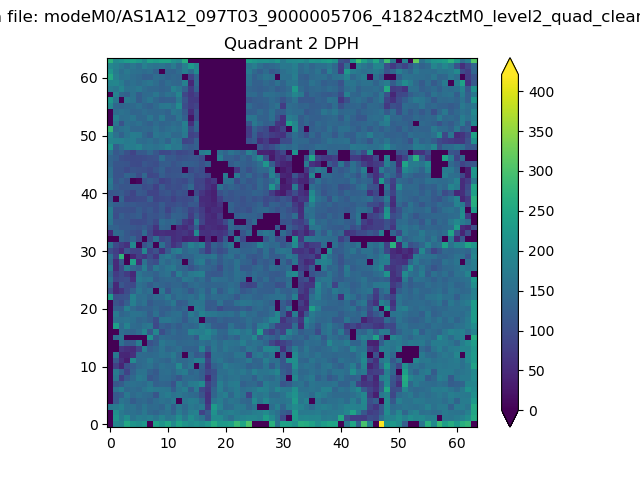 |
Quadrant C |
| Plot type | Count rate plots | Images |
|---|---|---|
| Comparison with Poisson distribution Blue bars denote a histogram of data divided into 1 sec bins. Red curve is a Poisson curve with rate = median count rate of data. |
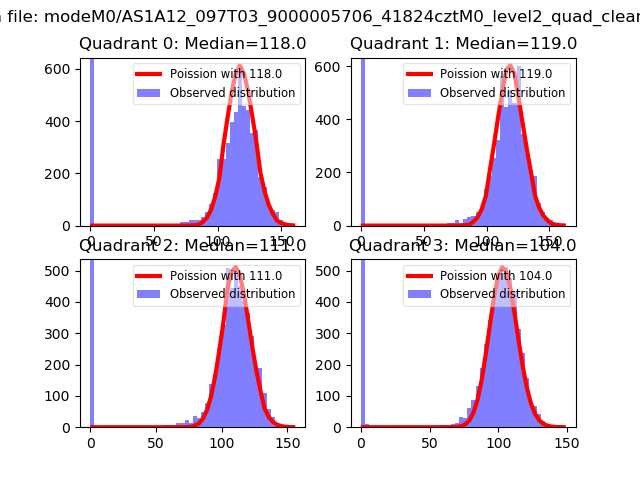 |
 |
| Quadrant-wise count rates Data is divided into 100 sec bins |
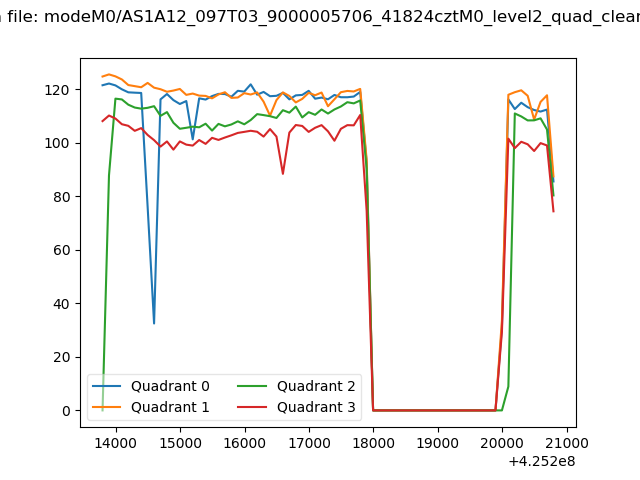 |
|
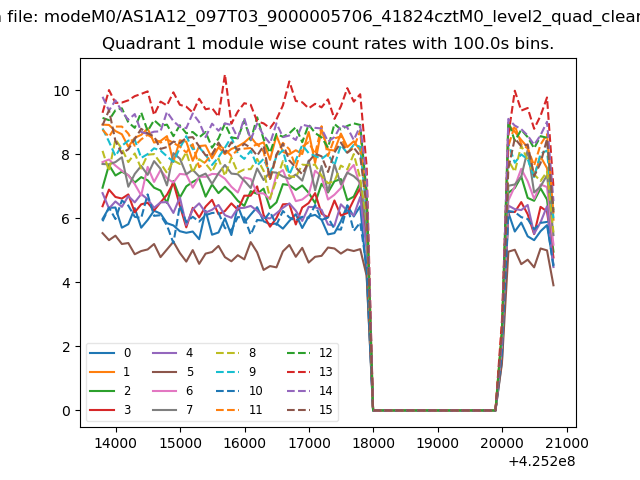
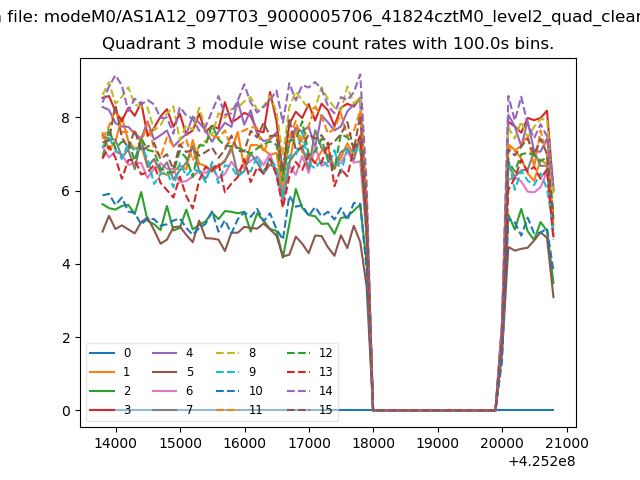
| Module-wise count rates for Quadrant A Data is divided into 100 sec bins |
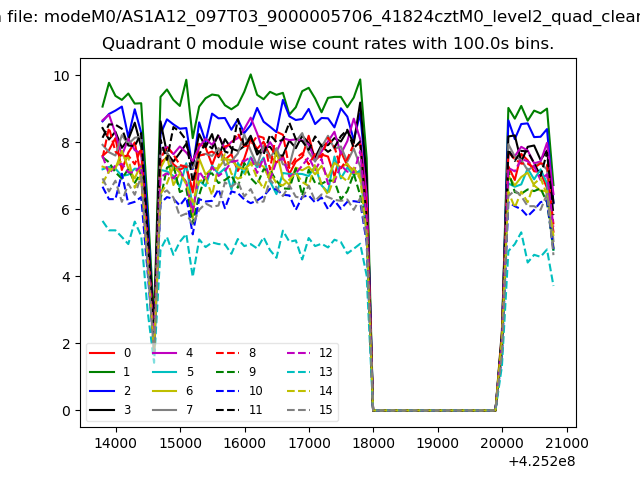 |
 |
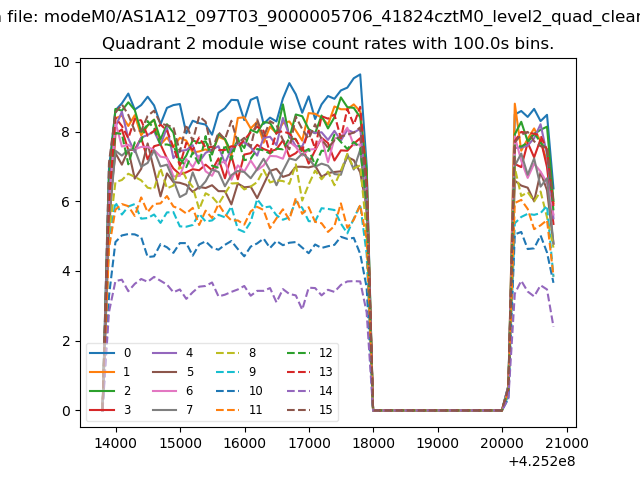
| Module-wise count rates for Quadrant B Data is divided into 100 sec bins |
 |
 |
| Module-wise count rates for Quadrant C Data is divided into 100 sec bins |
 |
 |
| Module-wise count rates for Quadrant D Data is divided into 100 sec bins |
 |
 |
| Parameter | Plot |
|---|---|
| CZT HV Monitor | 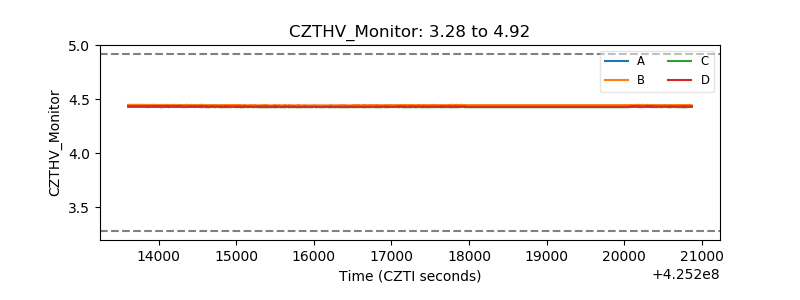 |
| D_VDD | 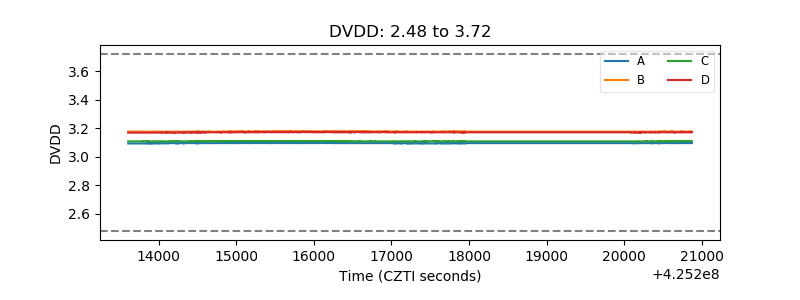 |
| Temperature 1 | 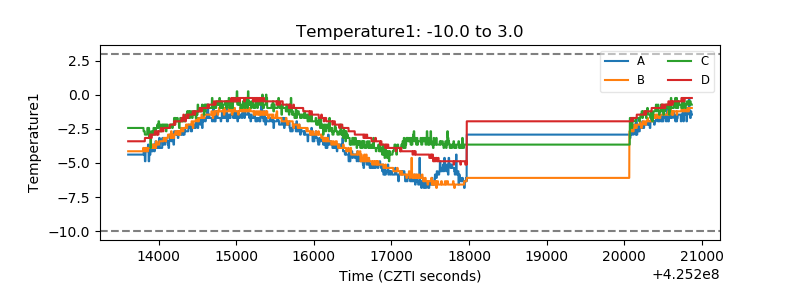 |
| Veto HV Monitor | 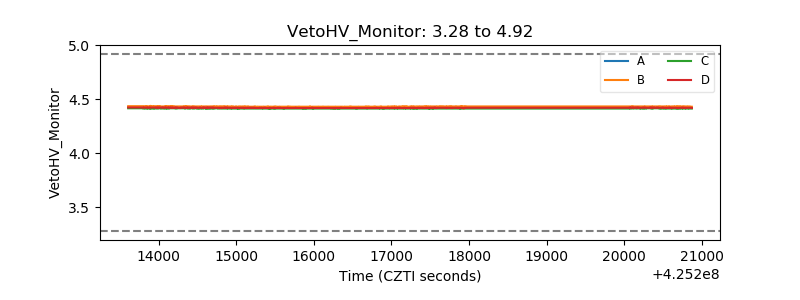 |
| Veto LLD |  |
| Alpha Counter | 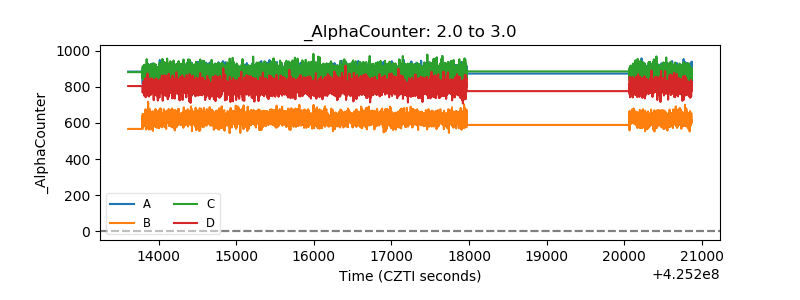 |
| _CPM_Rate | 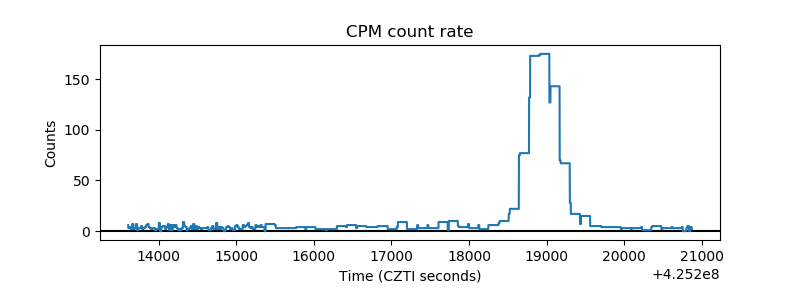 |
| CZT Counter | 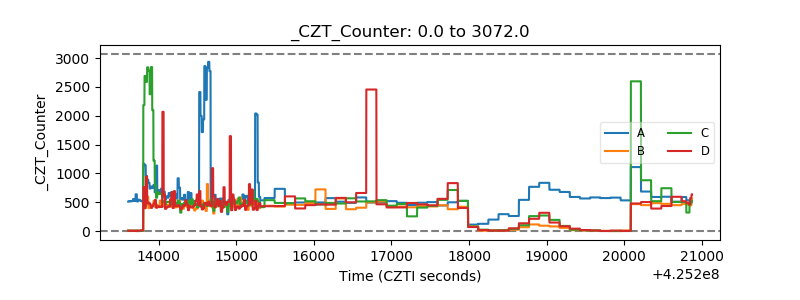 |
| +2.5 Volts monitor |  |
| +5 Volts monitor | 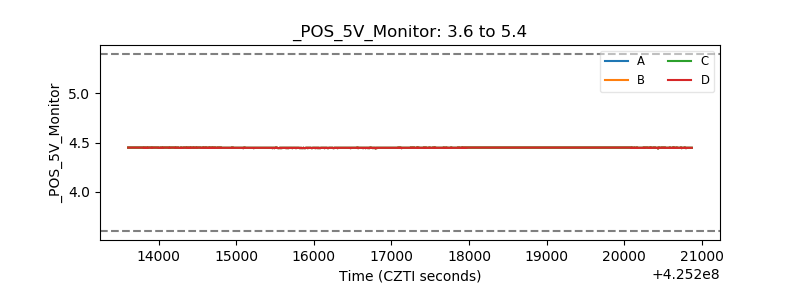 |
| _ROLL_ROT | 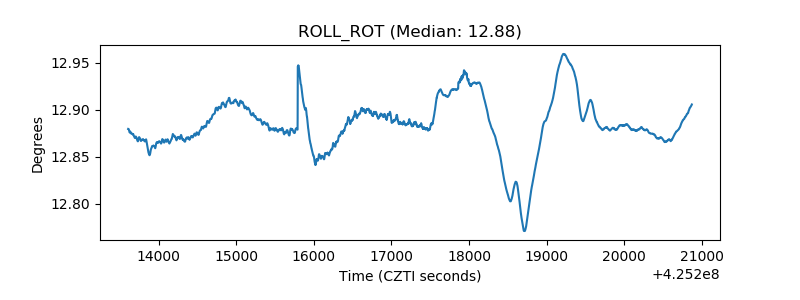 |
| _Roll_DEC | 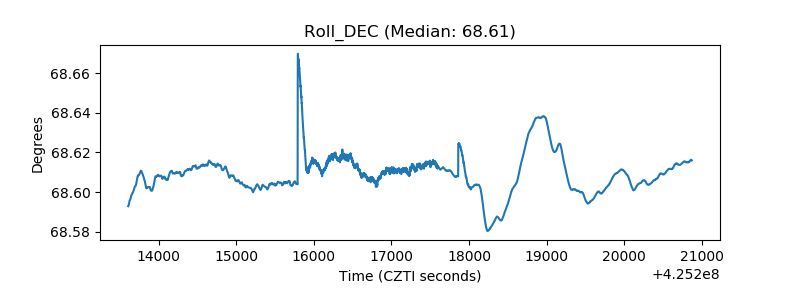 |
| _Roll_RA | 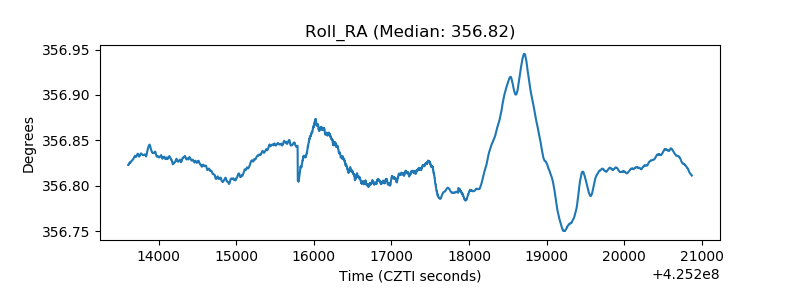 |
| Veto Counter | 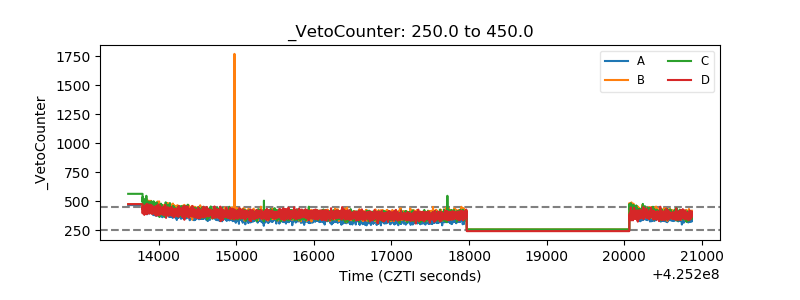 |