| Param | Original file | Final file |
|---|---|---|
| Filename | modeM0/AS1A12_097T03_9000005706_41825cztM0_level2.fits | modeM0/AS1A12_097T03_9000005706_41825cztM0_level2_quad_clean.evt |
| Size (bytes) | 329,892,480 | 89,055,360 |
| Size | 314.6 MB | 84.9 MB |
| Events in quadrant A | 3,092,306 | 611,321 |
| Events in quadrant B | 2,495,939 | 618,340 |
| Events in quadrant C | 3,289,640 | 549,364 |
| Events in quadrant D | 2,910,512 | 537,515 |
| Mode M0 | |||
|---|---|---|---|
| Quadrant | BADHDUFLAG | Total packets | Discarded packets |
| A | 0 | 12387 | 2 |
| B | 0 | 11269 | 2 |
| C | 0 | 12981 | 2 |
| D | 0 | 12192 | 2 |
| Mode SS | |||
|---|---|---|---|
| Quadrant | BADHDUFLAG | Total packets | Discarded packets |
| A | 0 | 110 | 0 |
| B | 0 | 110 | 0 |
| C | 0 | 110 | 0 |
| D | 0 | 110 | 0 |
| Mode M9 | |||
|---|---|---|---|
| Quadrant | BADHDUFLAG | Total packets | Discarded packets |
| A | 0 | 22 | 0 |
| B | 0 | 23 | 0 |
| C | 0 | 23 | 0 |
| D | 0 | 23 | 0 |
| Quadrant | Total seconds | Saturated seconds | Saturation percentage |
|---|---|---|---|
| A | 5428 | 47 | 0.865881% |
| B | 5428 | 31 | 0.571113% |
| C | 5428 | 254 | 4.679440% |
| D | 5428 | 38 | 0.700074% |
Noise dominated data is calculated using 1-second bins in cleaned event files. If a bin has >2000 counts, and if more than 50% of those come from <1% of pixels, then it is considered to be noise-dominated and hence unusable.
| Quadrant | # 1 sec bins | Bins with >0 counts | Bins with >2000 counts | High rate bins dominated by noise | Noise dominated (total time) | Noise dominated (detector-on time) | Marked lightcurve |
|---|---|---|---|---|---|---|---|
| A | 7341 | 5429 | 47 | 47 | 0.64% | 0.87% | 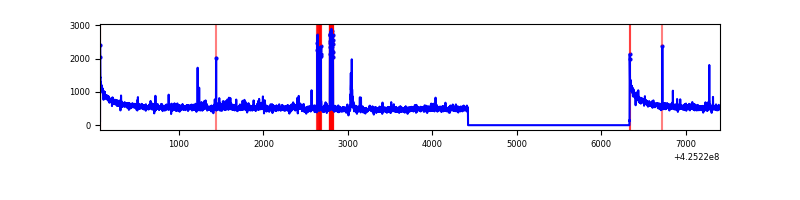 |
| B | 7341 | 5429 | 18 | 18 | 0.25% | 0.33% | 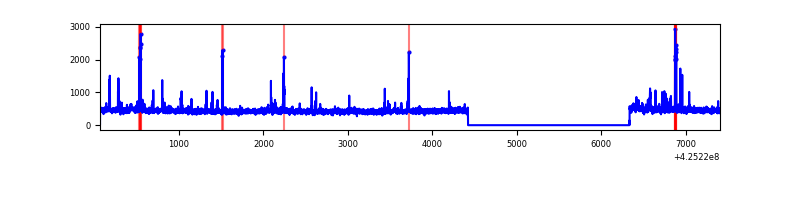 |
| C | 7341 | 5429 | 249 | 249 | 3.39% | 4.59% | 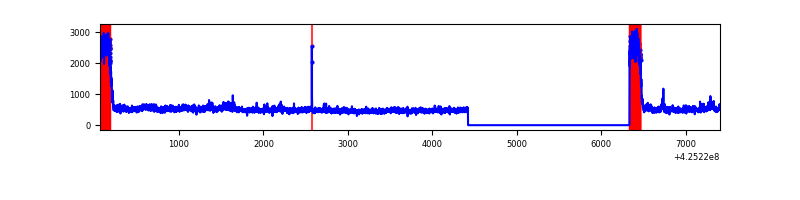 |
| D | 7341 | 5429 | 27 | 27 | 0.37% | 0.50% | 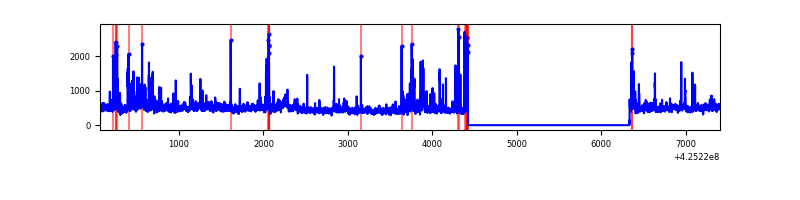 |
Top three noisy pixels from each quadrant. If the there are fewer than three noisy pixels in the level2.evt file, extra rows are filled as -1
| Pixel properties | Quadrant properties | ||||||
|---|---|---|---|---|---|---|---|
| Quadrant | DetID | PixID | Counts | Sigma | Mean | Median | Sigma |
| A | 10 | 83 | 599382 | 4967.17 | 590 | 579 | 120.6 |
| A | 6 | 10 | 103921 | 857.24 | 590 | 579 | 120.6 |
| A | 12 | 189 | 62900 | 516.96 | 590 | 579 | 120.6 |
| B | 3 | 112 | 87957 | 775.05 | 585 | 571 | 112.7 |
| B | 0 | 186 | 27373 | 237.71 | 585 | 571 | 112.7 |
| B | 0 | 183 | 24777 | 214.69 | 585 | 571 | 112.7 |
| C | 0 | 10 | 890850 | 6886.34 | 551 | 552 | 129.3 |
| C | 15 | 214 | 217411 | 1677.38 | 551 | 552 | 129.3 |
| C | 15 | 159 | 16984 | 127.1 | 551 | 552 | 129.3 |
| D | 12 | 79 | 237968 | 1696.45 | 576 | 561 | 139.9 |
| D | 13 | 249 | 181768 | 1294.86 | 576 | 561 | 139.9 |
| D | 5 | 222 | 112403 | 799.2 | 576 | 561 | 139.9 |
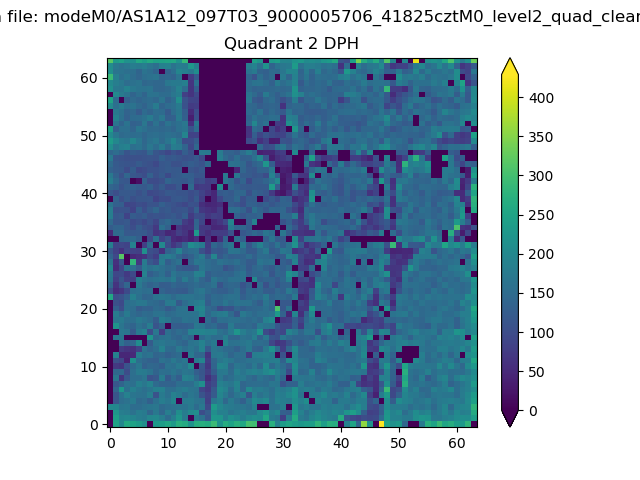
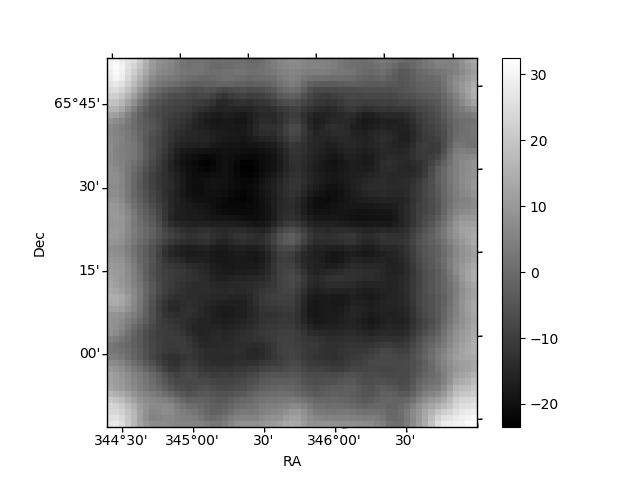
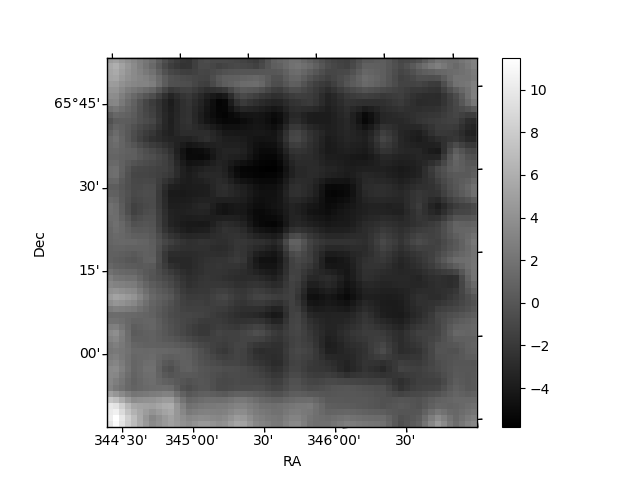
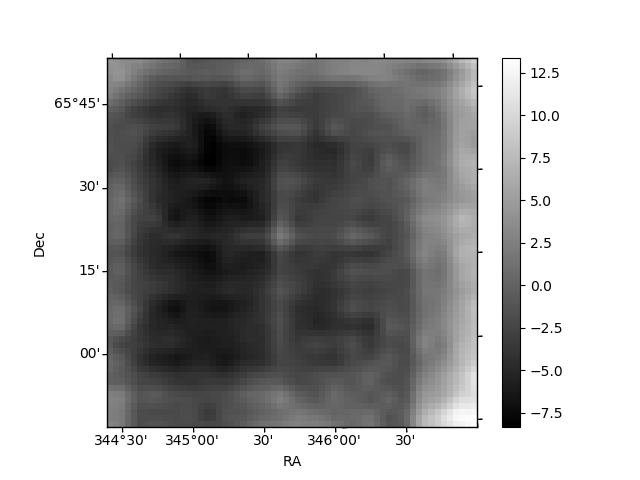
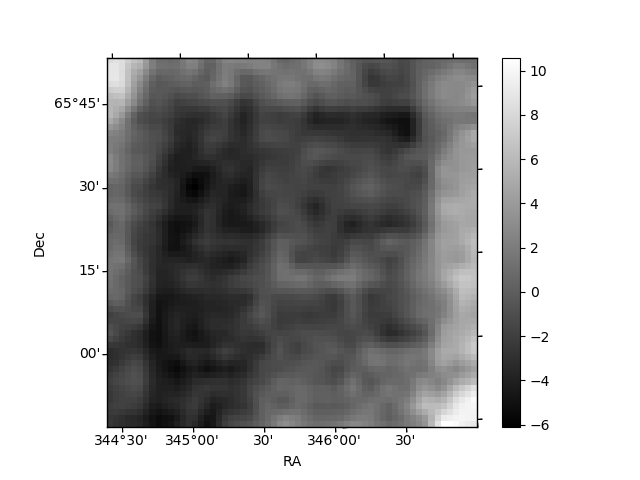
Histogram calculated using DETX and DETY for each event in the final _common_clean file
| Quadrant A | 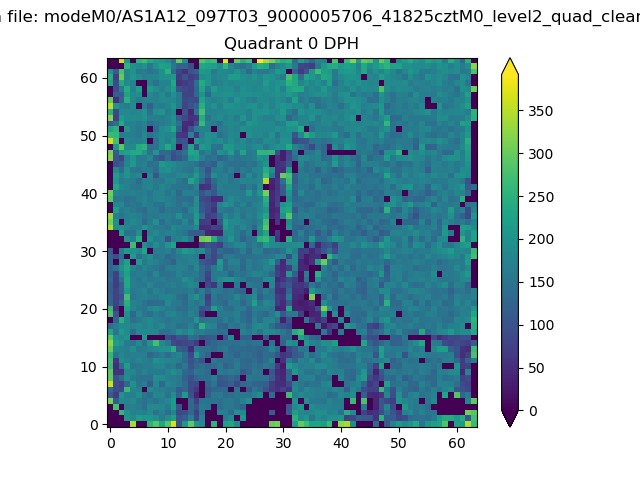 |
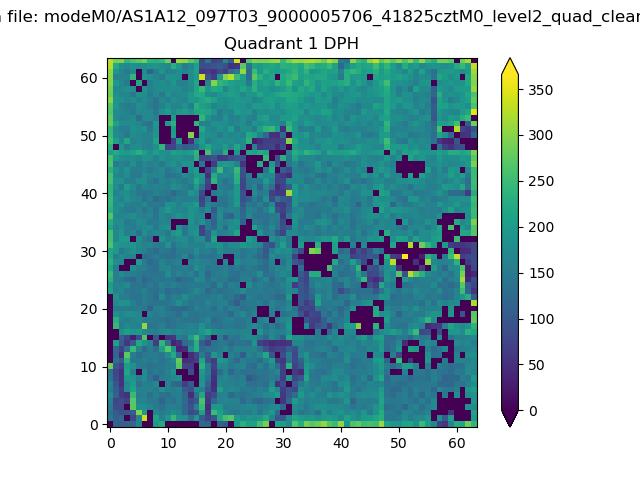 |
Quadrant B |
|---|---|---|---|
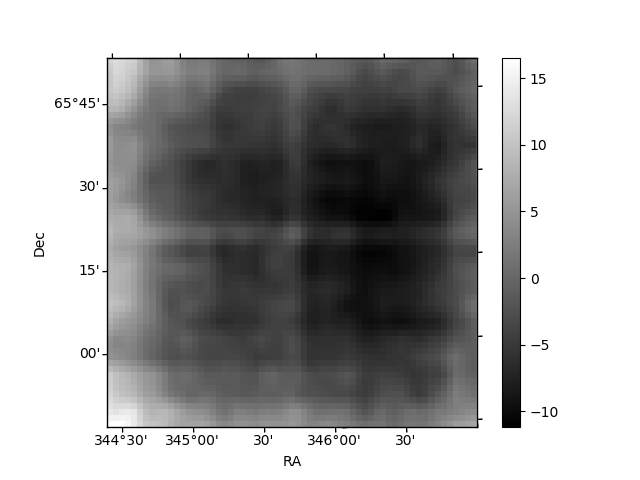
| Quadrant D | 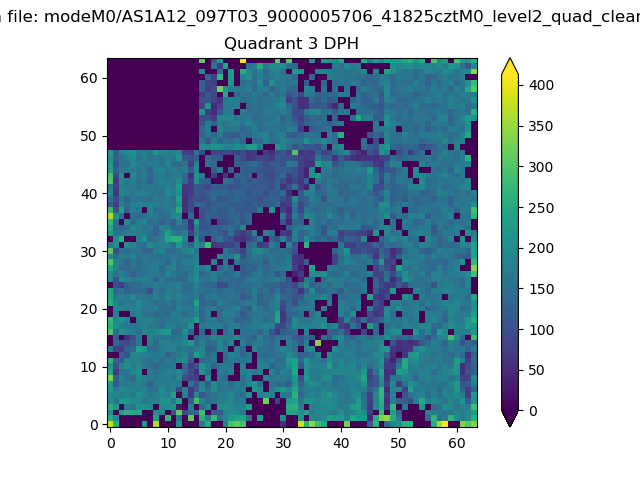 |
 |
Quadrant C |
| Plot type | Count rate plots | Images |
|---|---|---|
| Comparison with Poisson distribution Blue bars denote a histogram of data divided into 1 sec bins. Red curve is a Poisson curve with rate = median count rate of data. |
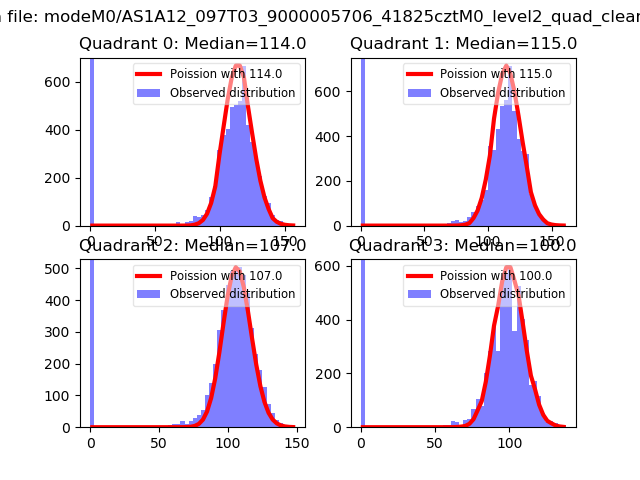 |
 |
| Quadrant-wise count rates Data is divided into 100 sec bins |
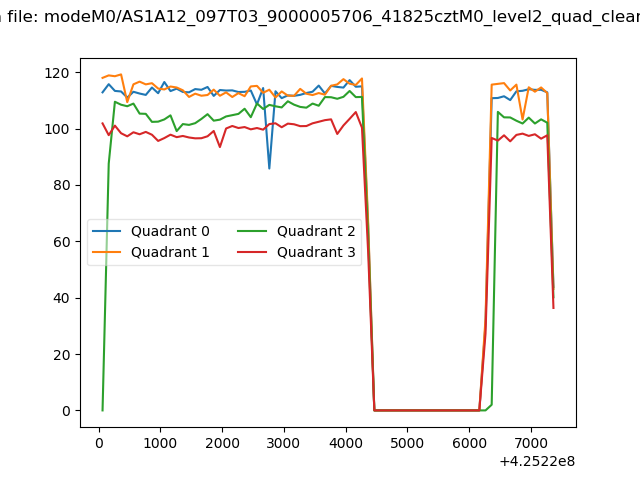 |
|
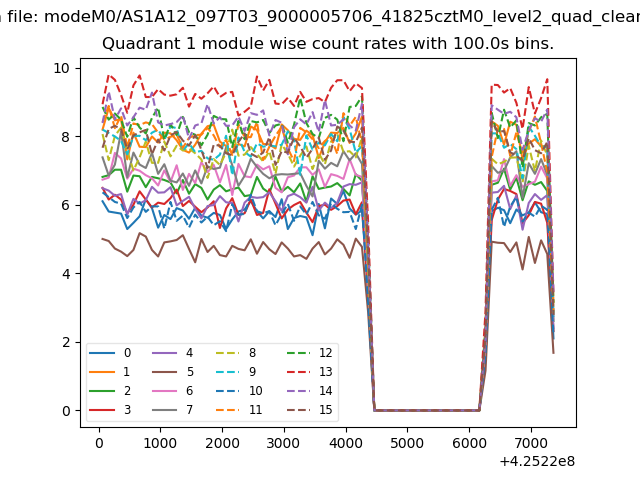
| Module-wise count rates for Quadrant A Data is divided into 100 sec bins |
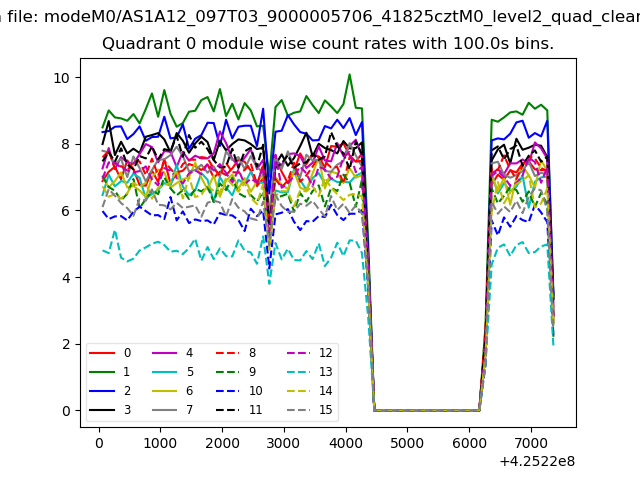 |
 |
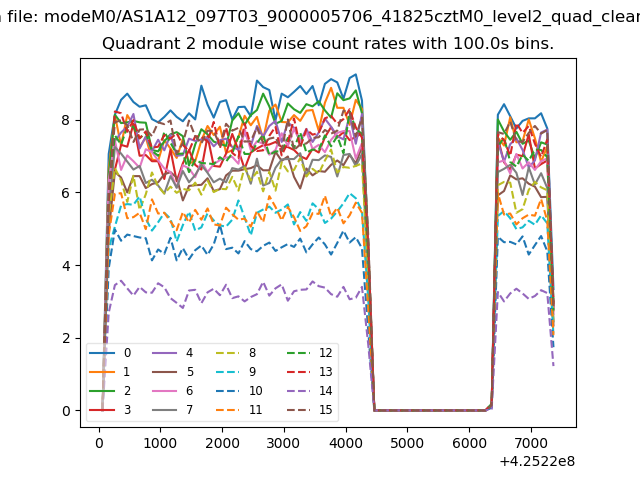
| Module-wise count rates for Quadrant B Data is divided into 100 sec bins |
 |
 |
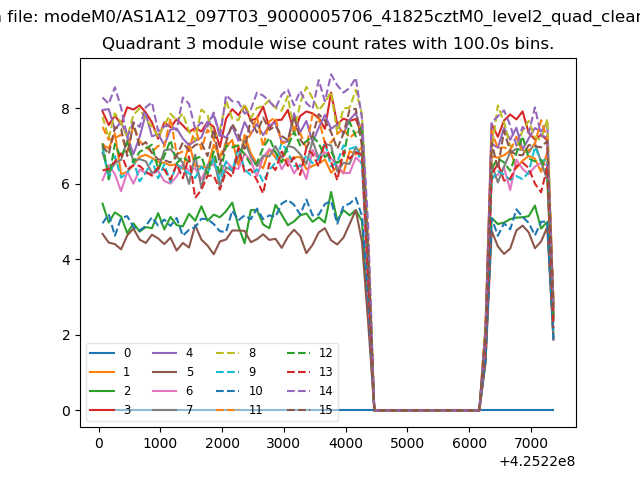
| Module-wise count rates for Quadrant C Data is divided into 100 sec bins |
 |
 |
| Module-wise count rates for Quadrant D Data is divided into 100 sec bins |
 |
 |
| Parameter | Plot |
|---|---|
| CZT HV Monitor | 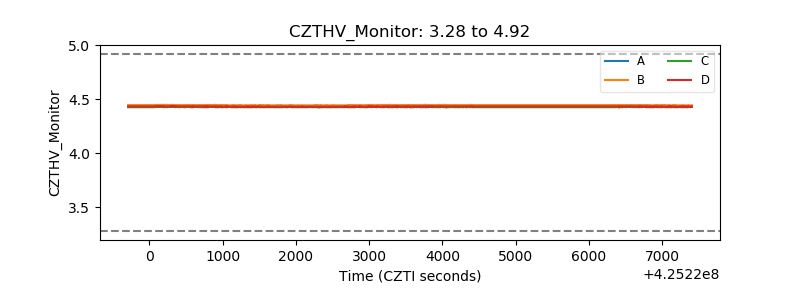 |
| D_VDD | 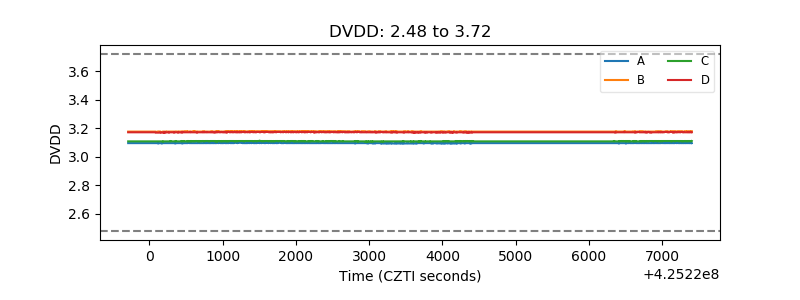 |
| Temperature 1 | 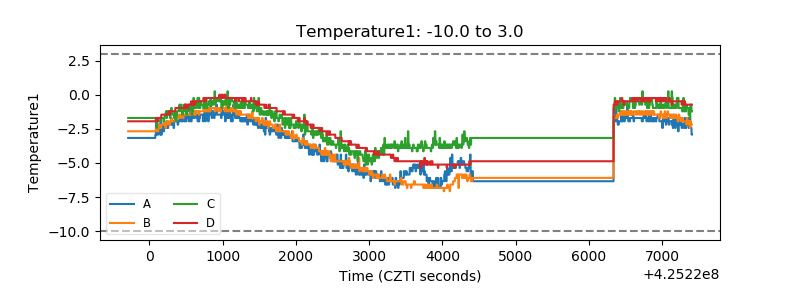 |
| Veto HV Monitor |  |
| Veto LLD | 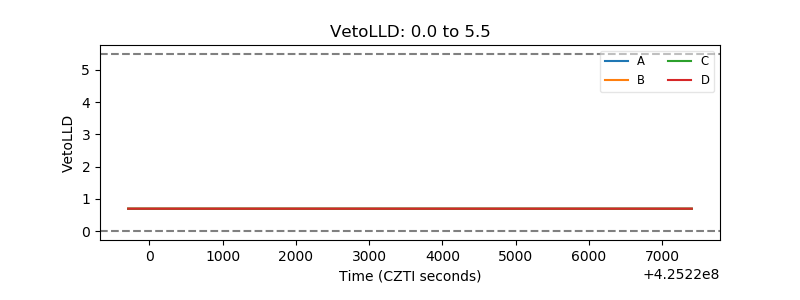 |
| Alpha Counter | 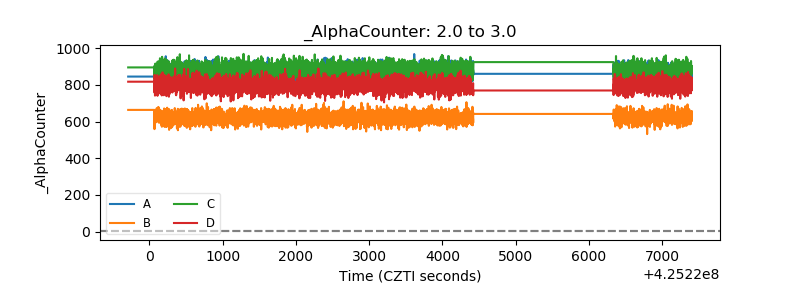 |
| _CPM_Rate | 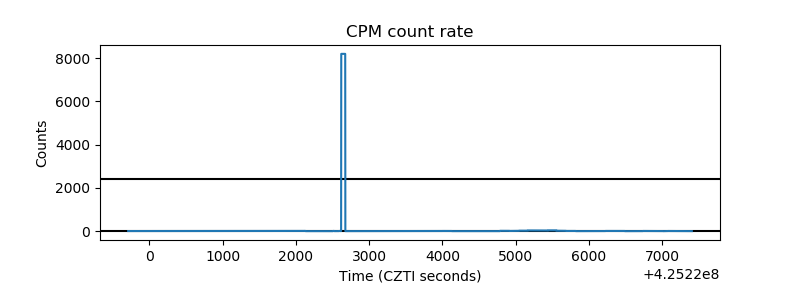 |
| CZT Counter | 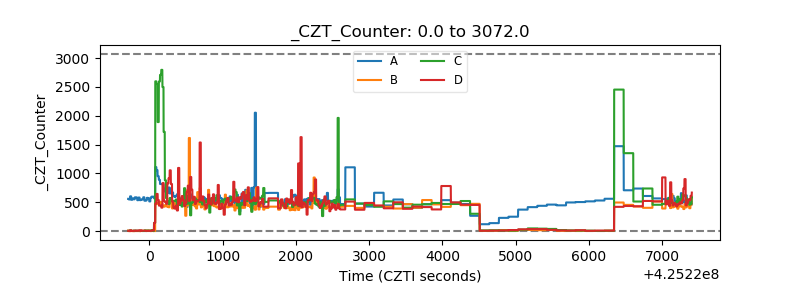 |
| +2.5 Volts monitor | 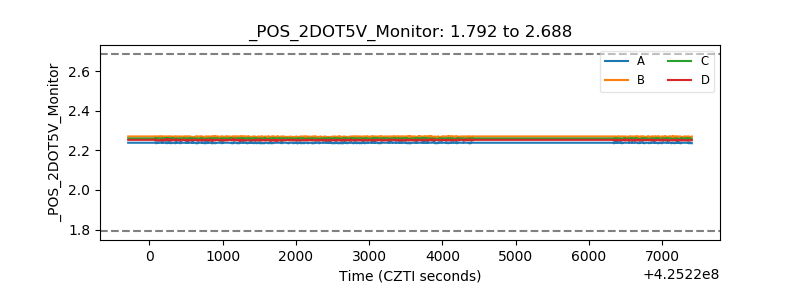 |
| +5 Volts monitor | 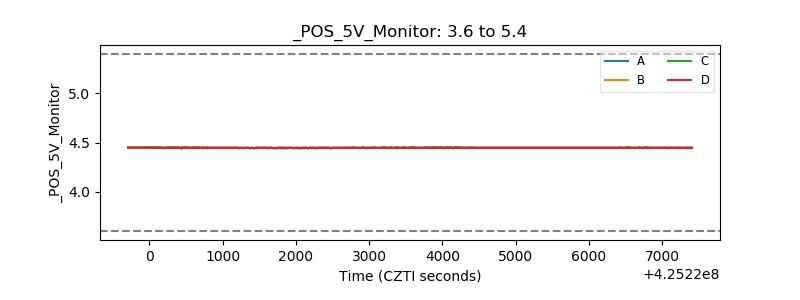 |
| _ROLL_ROT | 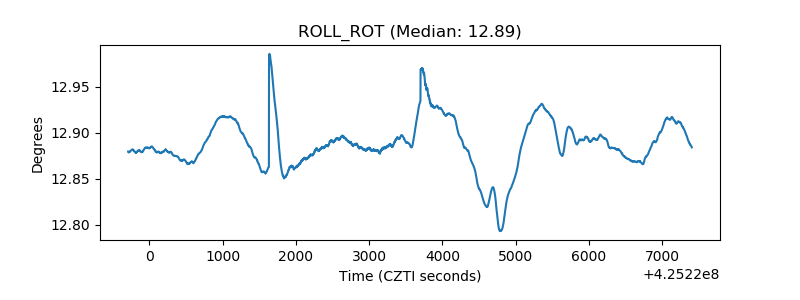 |
| _Roll_DEC | 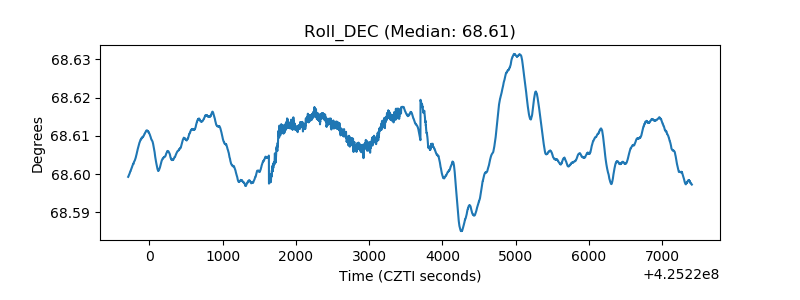 |
| _Roll_RA | 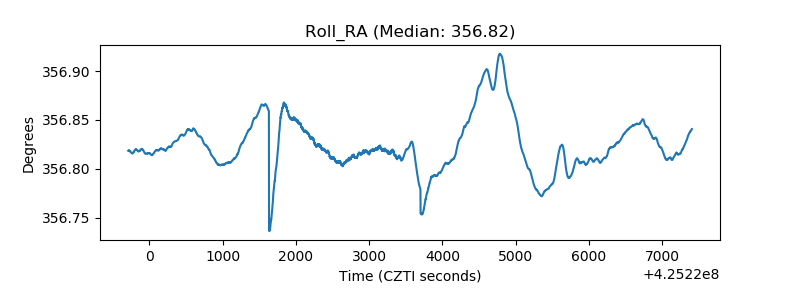 |
| Veto Counter | 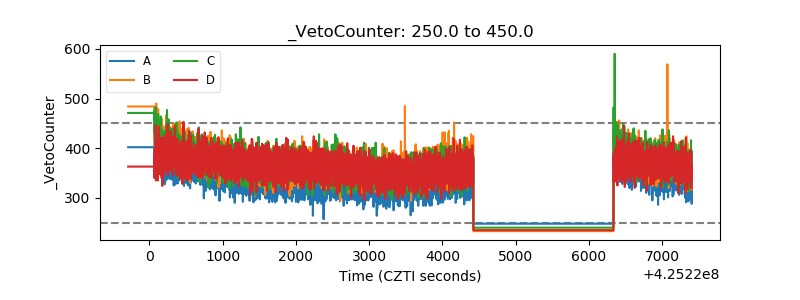 |