| Param | Original file | Final file |
|---|---|---|
| Filename | modeM0/AS1A12_097T03_9000005706_41826cztM0_level2.fits | modeM0/AS1A12_097T03_9000005706_41826cztM0_level2_quad_clean.evt |
| Size (bytes) | 303,857,280 | 85,213,440 |
| Size | 289.8 MB | 81.3 MB |
| Events in quadrant A | 2,732,734 | 582,033 |
| Events in quadrant B | 2,389,655 | 581,353 |
| Events in quadrant C | 2,906,813 | 536,100 |
| Events in quadrant D | 2,811,010 | 514,342 |
| Mode M0 | |||
|---|---|---|---|
| Quadrant | BADHDUFLAG | Total packets | Discarded packets |
| A | 0 | 11202 | 2 |
| B | 0 | 10857 | 1 |
| C | 0 | 11849 | 1 |
| D | 0 | 11727 | 1 |
| Mode SS | |||
|---|---|---|---|
| Quadrant | BADHDUFLAG | Total packets | Discarded packets |
| A | 0 | 108 | 0 |
| B | 0 | 108 | 0 |
| C | 0 | 108 | 0 |
| D | 0 | 108 | 0 |
| Mode M9 | |||
|---|---|---|---|
| Quadrant | BADHDUFLAG | Total packets | Discarded packets |
| A | 0 | 15 | 0 |
| B | 0 | 15 | 0 |
| C | 0 | 15 | 0 |
| D | 0 | 15 | 0 |
| Quadrant | Total seconds | Saturated seconds | Saturation percentage |
|---|---|---|---|
| A | 5224 | 10 | 0.191424% |
| B | 5224 | 31 | 0.593415% |
| C | 5225 | 132 | 2.526316% |
| D | 5225 | 22 | 0.421053% |
Noise dominated data is calculated using 1-second bins in cleaned event files. If a bin has >2000 counts, and if more than 50% of those come from <1% of pixels, then it is considered to be noise-dominated and hence unusable.
| Quadrant | # 1 sec bins | Bins with >0 counts | Bins with >2000 counts | High rate bins dominated by noise | Noise dominated (total time) | Noise dominated (detector-on time) | Marked lightcurve |
|---|---|---|---|---|---|---|---|
| A | 6806 | 5225 | 4 | 4 | 0.06% | 0.08% | 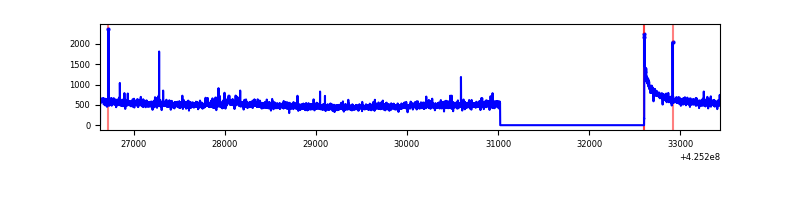 |
| B | 6806 | 5225 | 14 | 14 | 0.21% | 0.27% | 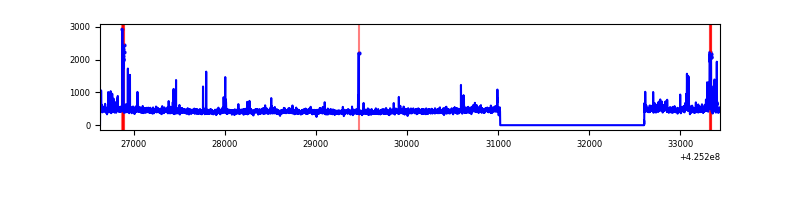 |
| C | 6807 | 5226 | 120 | 120 | 1.76% | 2.30% | 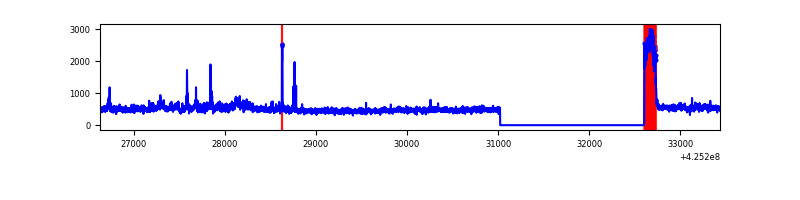 |
| D | 6807 | 5226 | 19 | 19 | 0.28% | 0.36% | 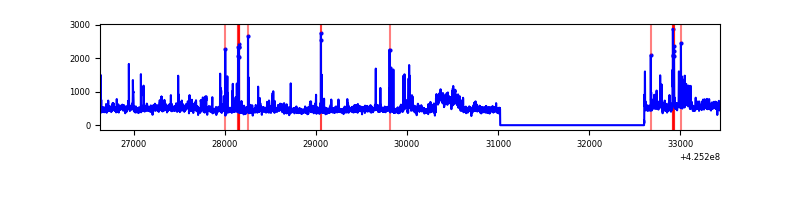 |
Top three noisy pixels from each quadrant. If the there are fewer than three noisy pixels in the level2.evt file, extra rows are filled as -1
| Pixel properties | Quadrant properties | ||||||
|---|---|---|---|---|---|---|---|
| Quadrant | DetID | PixID | Counts | Sigma | Mean | Median | Sigma |
| A | 10 | 83 | 497847 | 4287.9 | 564 | 553 | 116.0 |
| A | 14 | 24 | 21704 | 182.37 | 564 | 553 | 116.0 |
| A | 6 | 10 | 16337 | 136.1 | 564 | 553 | 116.0 |
| B | 4 | 141 | 52471 | 477.66 | 559 | 544 | 108.7 |
| B | 3 | 112 | 48861 | 444.45 | 559 | 544 | 108.7 |
| B | 0 | 183 | 29055 | 262.26 | 559 | 544 | 108.7 |
| C | 0 | 10 | 520128 | 4138.34 | 535 | 537 | 125.6 |
| C | 15 | 214 | 207761 | 1650.46 | 535 | 537 | 125.6 |
| C | 15 | 159 | 51985 | 409.76 | 535 | 537 | 125.6 |
| D | 12 | 79 | 392512 | 2940.78 | 547 | 532 | 133.3 |
| D | 1 | 52 | 75097 | 559.41 | 547 | 532 | 133.3 |
| D | 13 | 249 | 69434 | 516.93 | 547 | 532 | 133.3 |
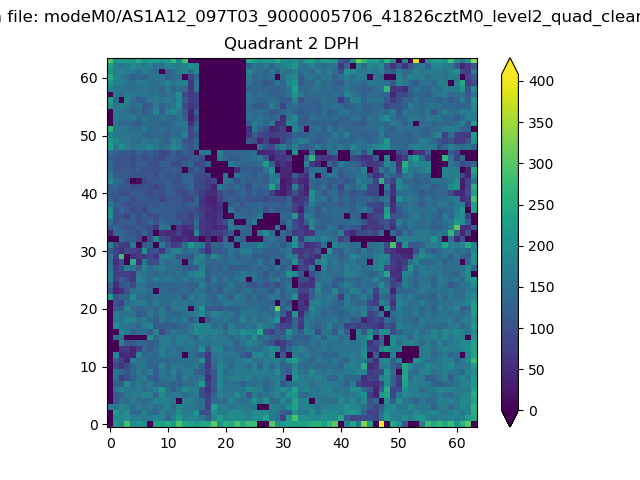
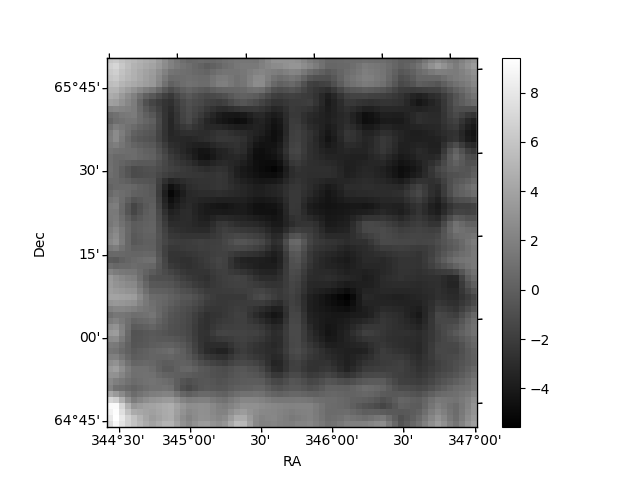
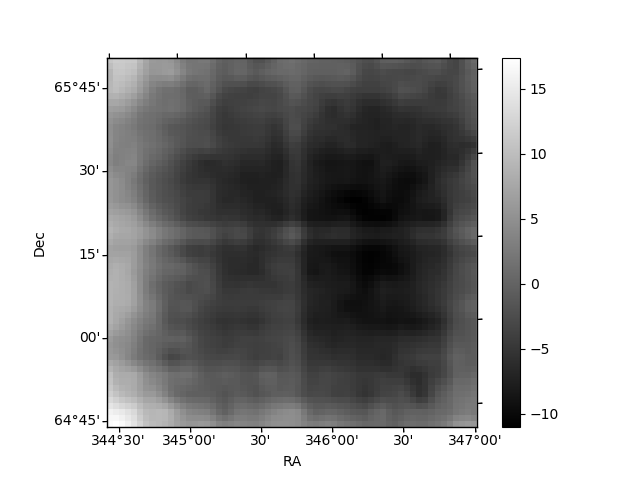
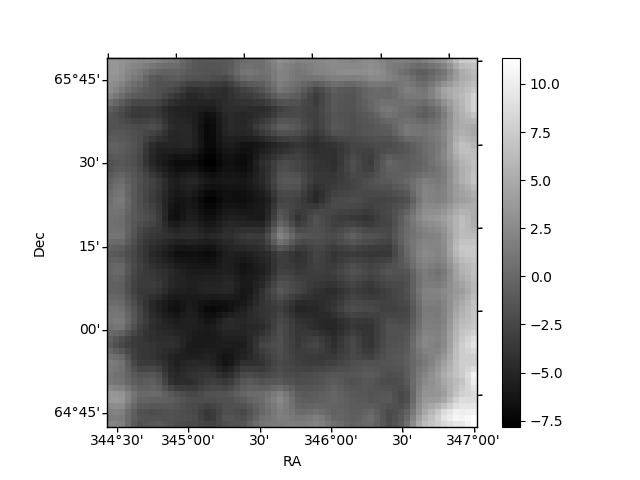
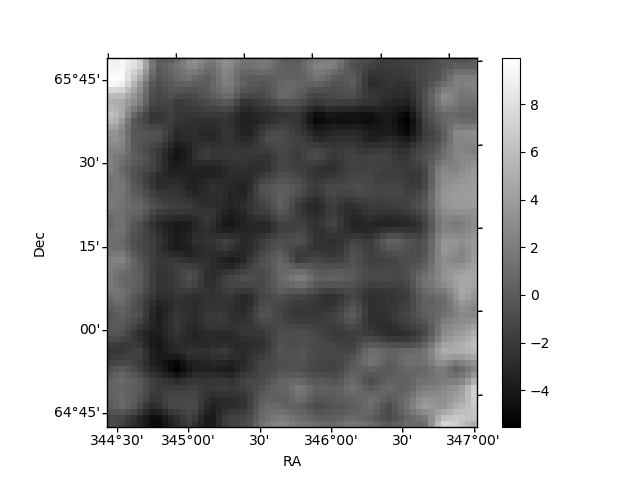
Histogram calculated using DETX and DETY for each event in the final _common_clean file
| Quadrant A | 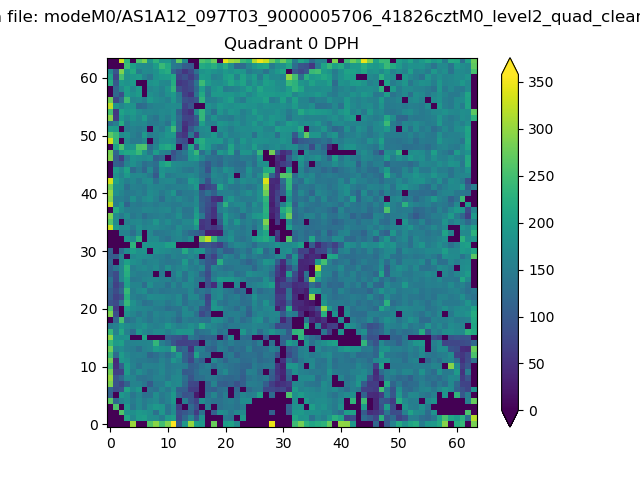 |
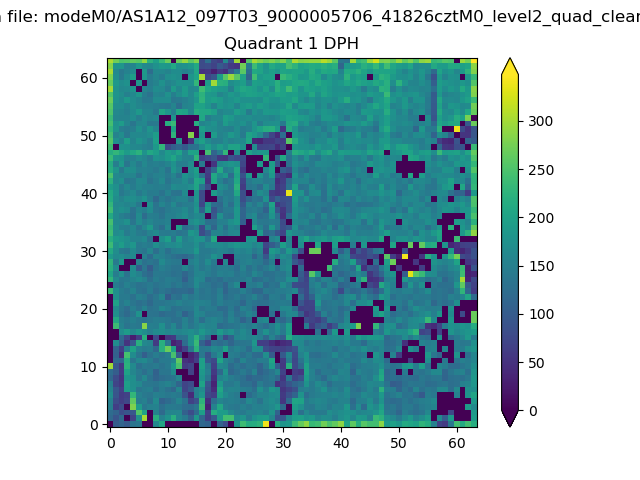 |
Quadrant B |
|---|---|---|---|
| Quadrant D | 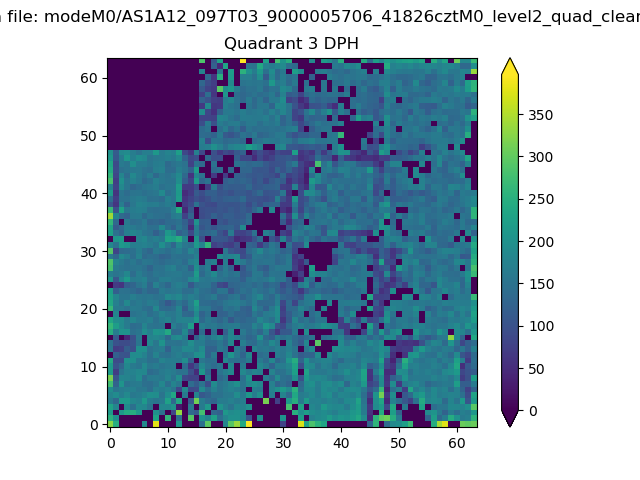 |
 |
Quadrant C |
| Plot type | Count rate plots | Images |
|---|---|---|
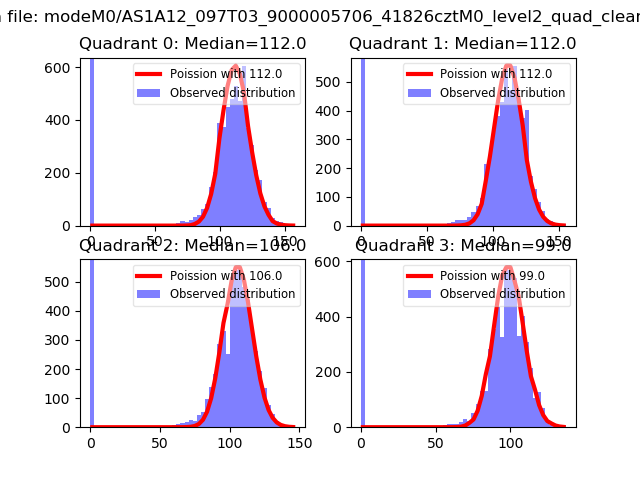
| Comparison with Poisson distribution Blue bars denote a histogram of data divided into 1 sec bins. Red curve is a Poisson curve with rate = median count rate of data. |
 |
 |
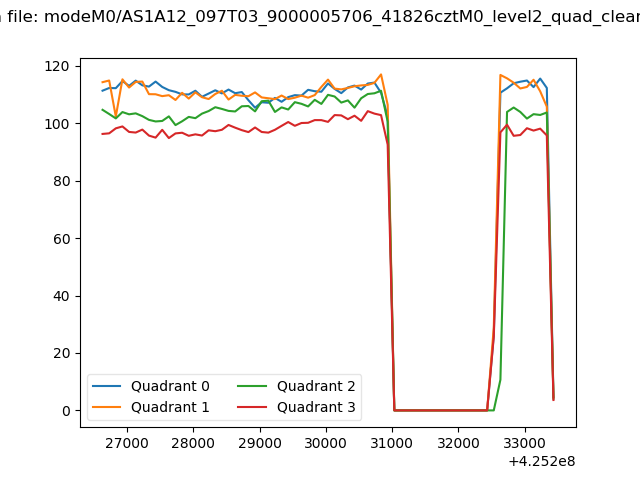
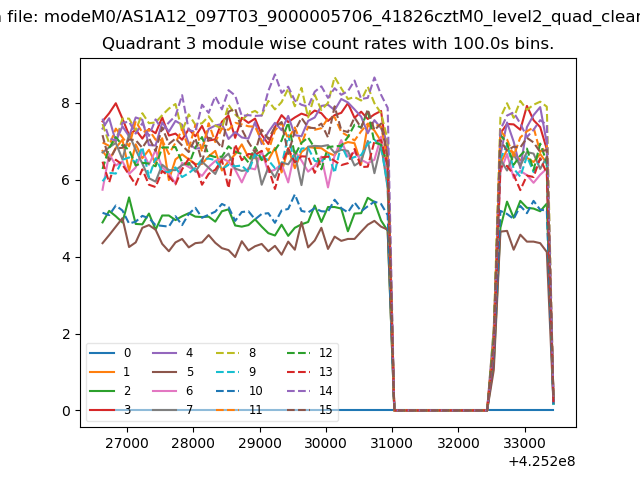
| Quadrant-wise count rates Data is divided into 100 sec bins |
 |
|
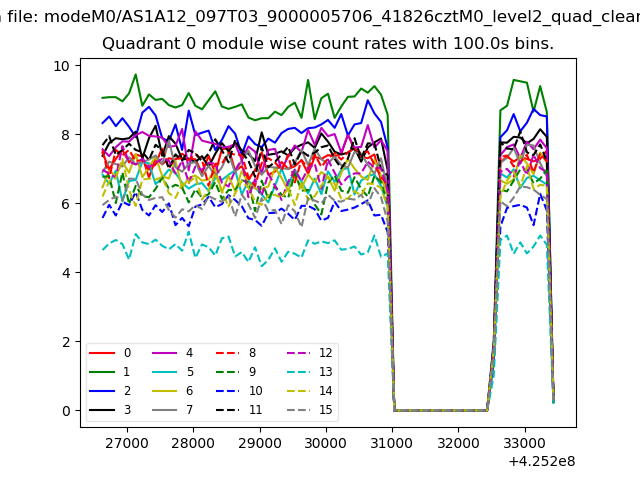
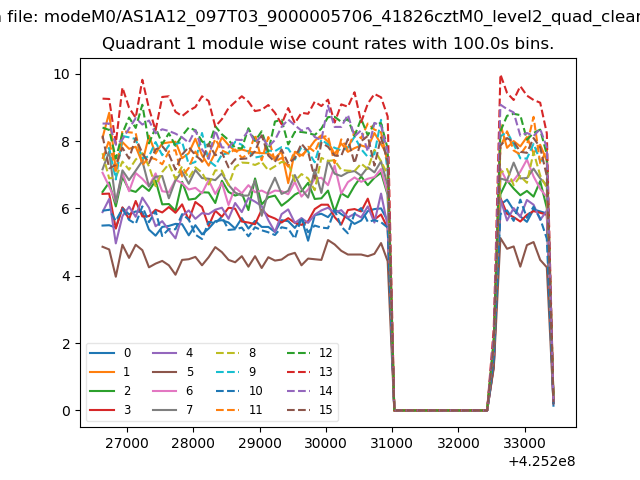
| Module-wise count rates for Quadrant A Data is divided into 100 sec bins |
 |
 |
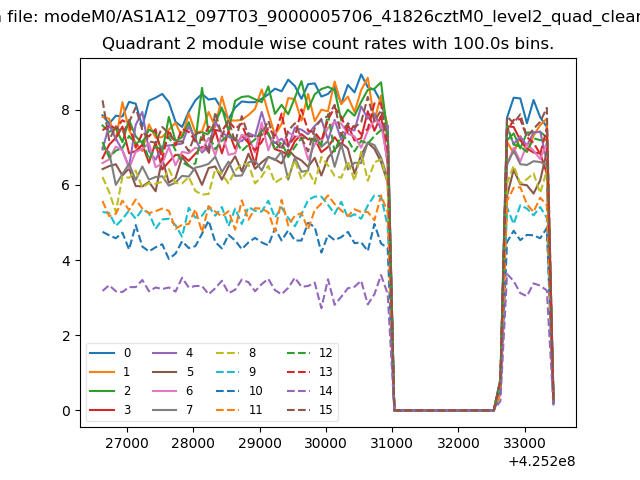
| Module-wise count rates for Quadrant B Data is divided into 100 sec bins |
 |
 |
| Module-wise count rates for Quadrant C Data is divided into 100 sec bins |
 |
 |
| Module-wise count rates for Quadrant D Data is divided into 100 sec bins |
 |
 |
| Parameter | Plot |
|---|---|
| CZT HV Monitor | 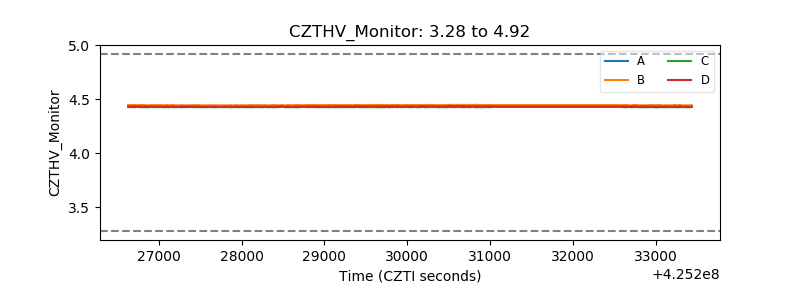 |
| D_VDD | 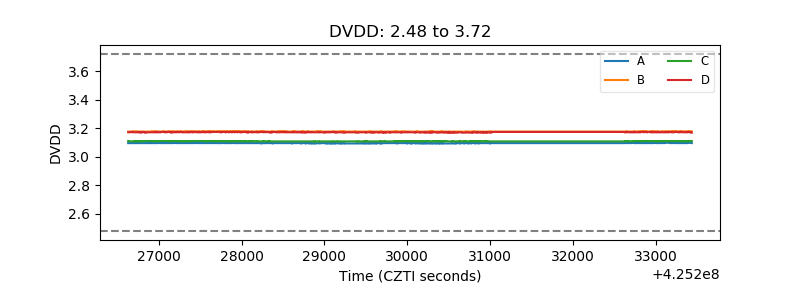 |
| Temperature 1 | 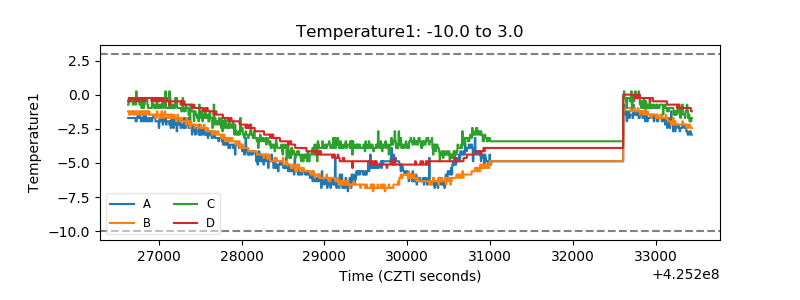 |
| Veto HV Monitor | 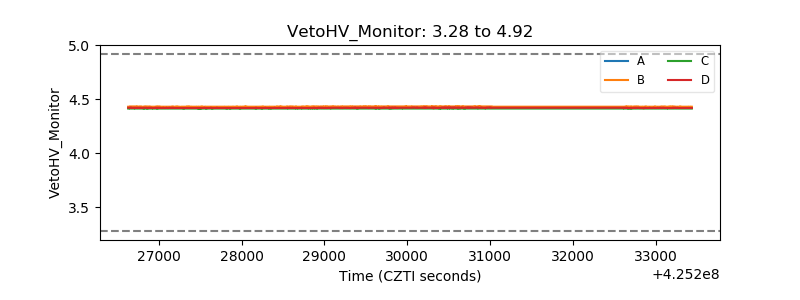 |
| Veto LLD |  |
| Alpha Counter | 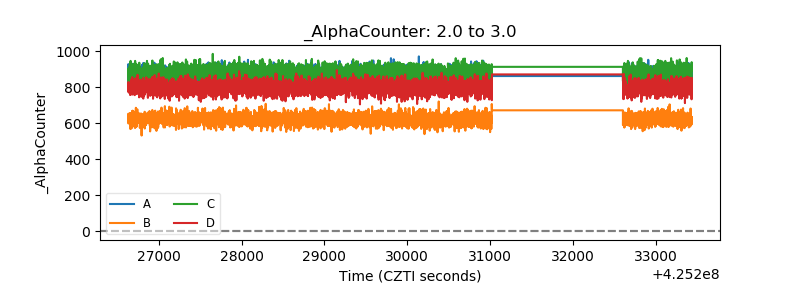 |
| _CPM_Rate | 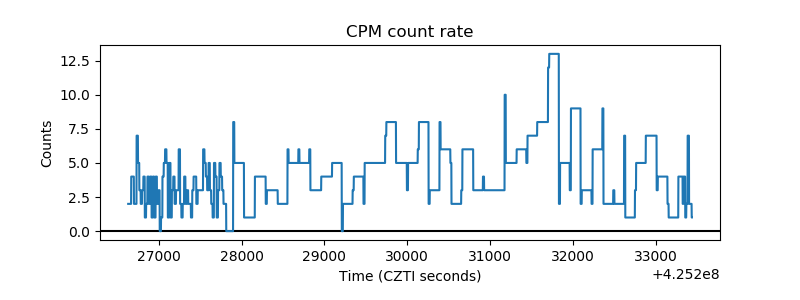 |
| CZT Counter | 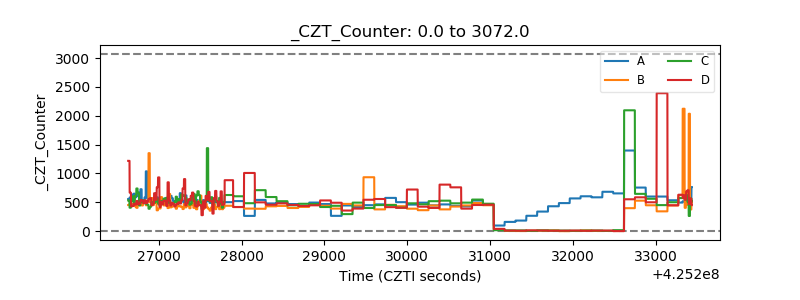 |
| +2.5 Volts monitor | 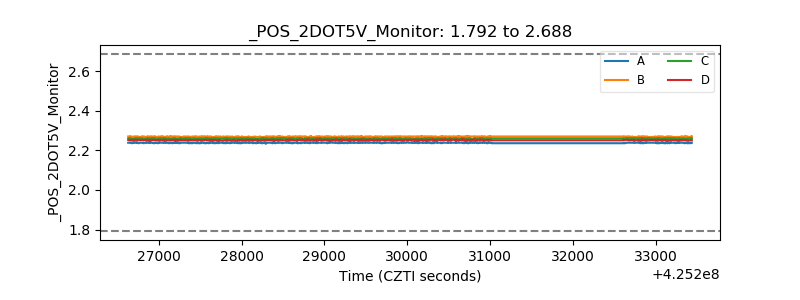 |
| +5 Volts monitor | 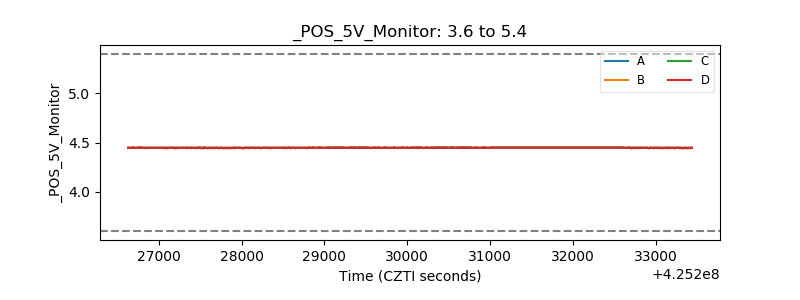 |
| _ROLL_ROT | 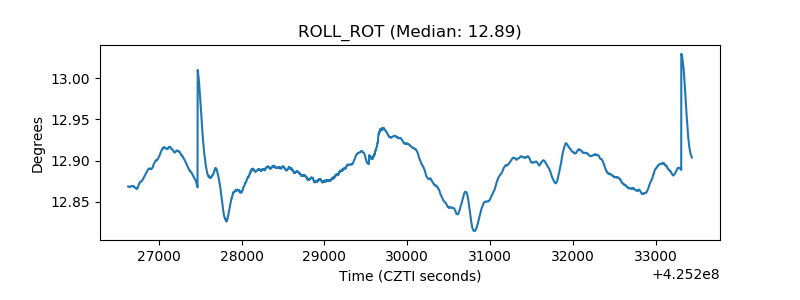 |
| _Roll_DEC | 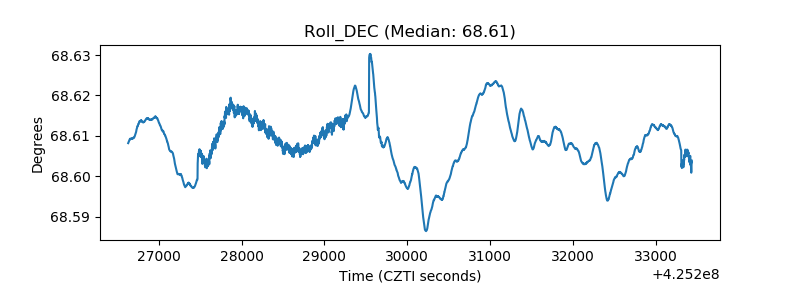 |
| _Roll_RA | 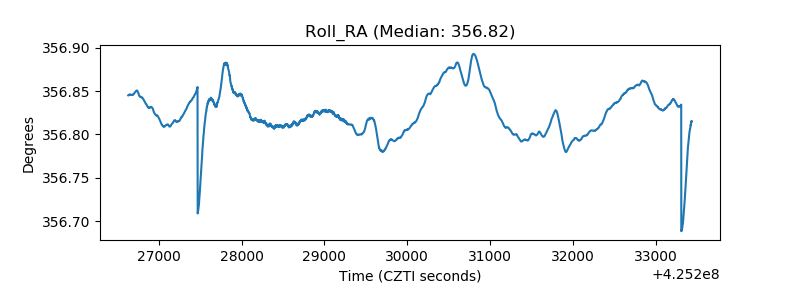 |
| Veto Counter | 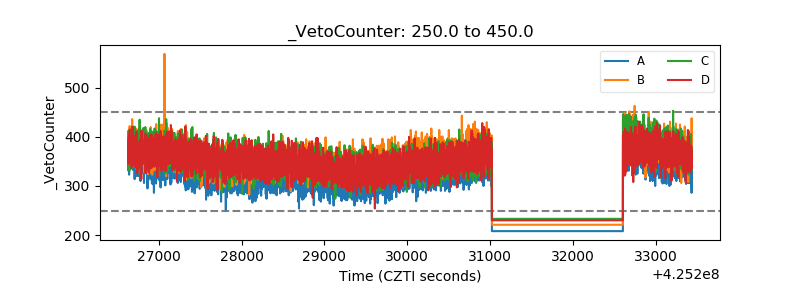 |