| Param | Original file | Final file |
|---|---|---|
| Filename | modeM0/AS1A12_097T03_9000005706_41827cztM0_level2.fits | modeM0/AS1A12_097T03_9000005706_41827cztM0_level2_quad_clean.evt |
| Size (bytes) | 356,402,880 | 92,908,800 |
| Size | 339.9 MB | 88.6 MB |
| Events in quadrant A | 3,324,031 | 631,658 |
| Events in quadrant B | 2,714,689 | 639,055 |
| Events in quadrant C | 3,239,081 | 582,072 |
| Events in quadrant D | 3,464,899 | 556,253 |
| Mode M0 | |||
|---|---|---|---|
| Quadrant | BADHDUFLAG | Total packets | Discarded packets |
| A | 0 | 13435 | 3 |
| B | 0 | 12116 | 2 |
| C | 0 | 13265 | 2 |
| D | 0 | 14256 | 2 |
| Mode SS | |||
|---|---|---|---|
| Quadrant | BADHDUFLAG | Total packets | Discarded packets |
| A | 0 | 118 | 0 |
| B | 0 | 118 | 0 |
| C | 0 | 118 | 0 |
| D | 0 | 118 | 0 |
| Mode M9 | |||
|---|---|---|---|
| Quadrant | BADHDUFLAG | Total packets | Discarded packets |
| A | 0 | 21 | 0 |
| B | 0 | 21 | 0 |
| C | 0 | 21 | 0 |
| D | 0 | 22 | 0 |
| Quadrant | Total seconds | Saturated seconds | Saturation percentage |
|---|---|---|---|
| A | 5778 | 82 | 1.419176% |
| B | 5778 | 45 | 0.778816% |
| C | 5778 | 234 | 4.049844% |
| D | 5778 | 184 | 3.184493% |
Noise dominated data is calculated using 1-second bins in cleaned event files. If a bin has >2000 counts, and if more than 50% of those come from <1% of pixels, then it is considered to be noise-dominated and hence unusable.
| Quadrant | # 1 sec bins | Bins with >0 counts | Bins with >2000 counts | High rate bins dominated by noise | Noise dominated (total time) | Noise dominated (detector-on time) | Marked lightcurve |
|---|---|---|---|---|---|---|---|
| A | 7151 | 5779 | 90 | 90 | 1.26% | 1.56% | 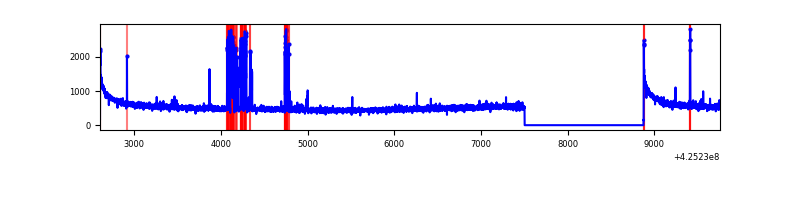 |
| B | 7151 | 5779 | 29 | 29 | 0.41% | 0.50% |  |
| C | 7151 | 5779 | 218 | 218 | 3.05% | 3.77% | 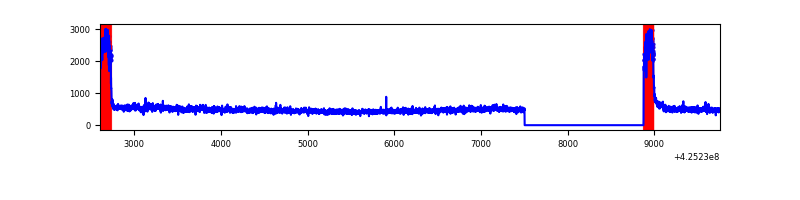 |
| D | 7151 | 5779 | 168 | 168 | 2.35% | 2.91% | 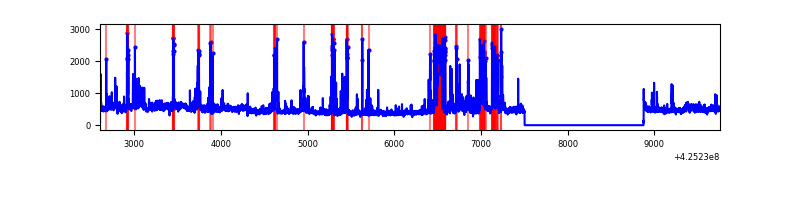 |
Top three noisy pixels from each quadrant. If the there are fewer than three noisy pixels in the level2.evt file, extra rows are filled as -1
| Pixel properties | Quadrant properties | ||||||
|---|---|---|---|---|---|---|---|
| Quadrant | DetID | PixID | Counts | Sigma | Mean | Median | Sigma |
| A | 10 | 83 | 620309 | 4809.62 | 625 | 613 | 128.8 |
| A | 6 | 10 | 256717 | 1987.69 | 625 | 613 | 128.8 |
| A | 15 | 254 | 11672 | 85.83 | 625 | 613 | 128.8 |
| B | 4 | 141 | 137159 | 1131.06 | 620 | 601 | 120.7 |
| B | 0 | 245 | 47271 | 386.55 | 620 | 601 | 120.7 |
| B | 3 | 112 | 32658 | 265.52 | 620 | 601 | 120.7 |
| C | 0 | 10 | 705866 | 5137.86 | 586 | 588 | 137.3 |
| C | 15 | 214 | 226257 | 1643.97 | 586 | 588 | 137.3 |
| C | 0 | 15 | 7963 | 53.73 | 586 | 588 | 137.3 |
| D | 13 | 249 | 596398 | 4039.04 | 602 | 583 | 147.5 |
| D | 12 | 79 | 164785 | 1113.13 | 602 | 583 | 147.5 |
| D | 1 | 52 | 113587 | 766.06 | 602 | 583 | 147.5 |
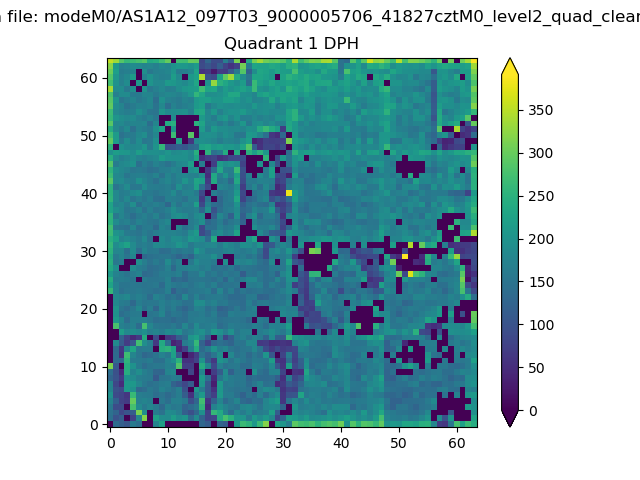
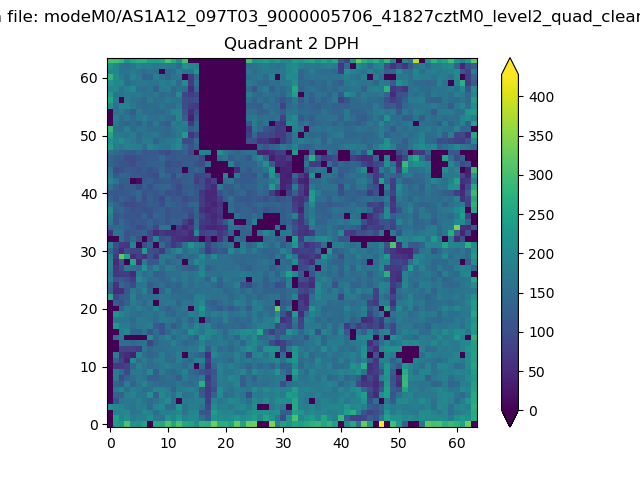
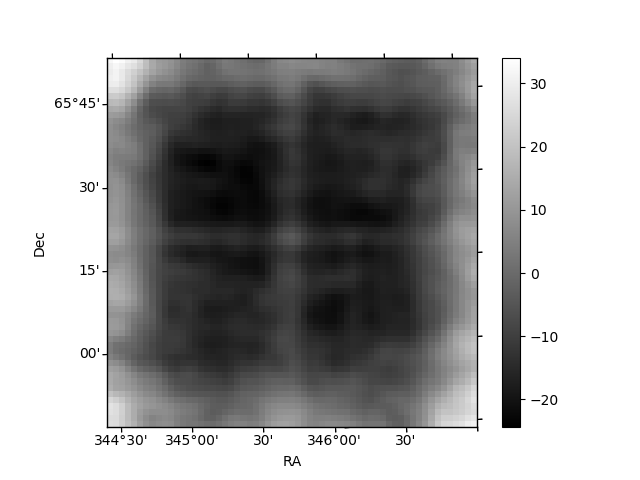
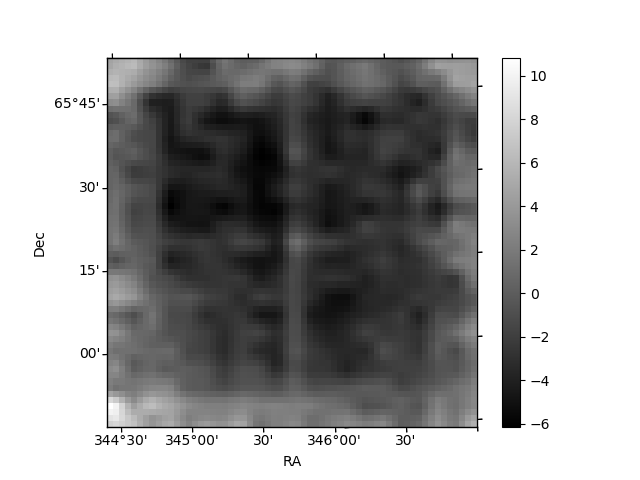
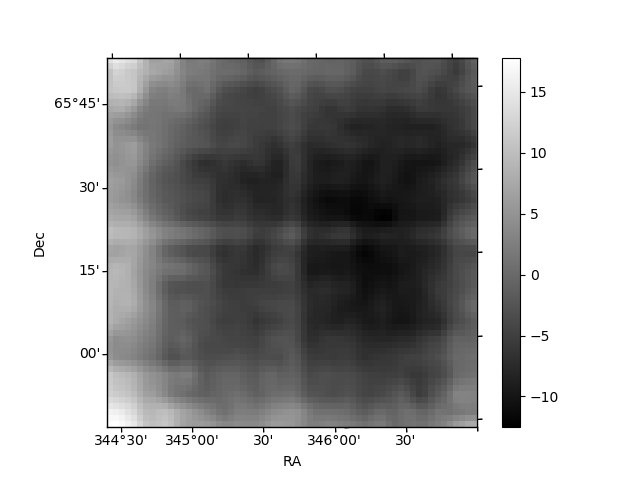
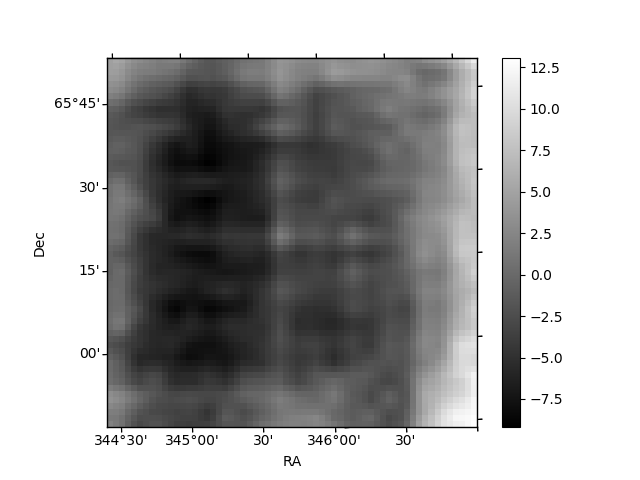
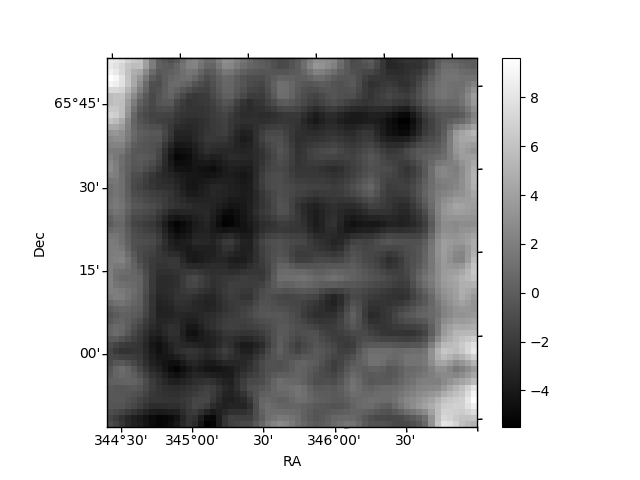
Histogram calculated using DETX and DETY for each event in the final _common_clean file
| Quadrant A | 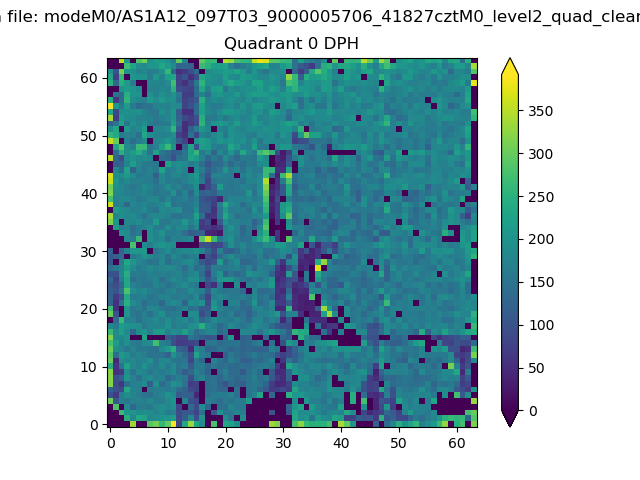 |
 |
Quadrant B |
|---|---|---|---|
| Quadrant D | 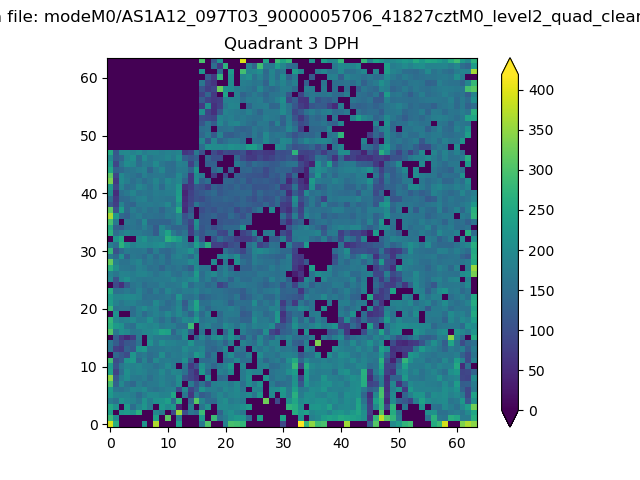 |
 |
Quadrant C |
| Plot type | Count rate plots | Images |
|---|---|---|
| Comparison with Poisson distribution Blue bars denote a histogram of data divided into 1 sec bins. Red curve is a Poisson curve with rate = median count rate of data. |
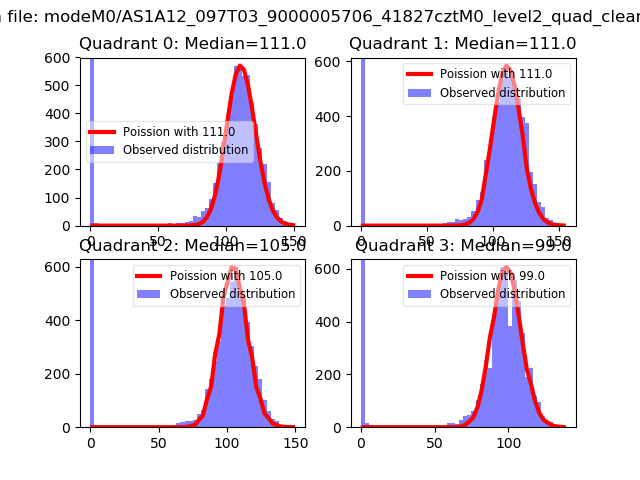 |
 |
| Quadrant-wise count rates Data is divided into 100 sec bins |
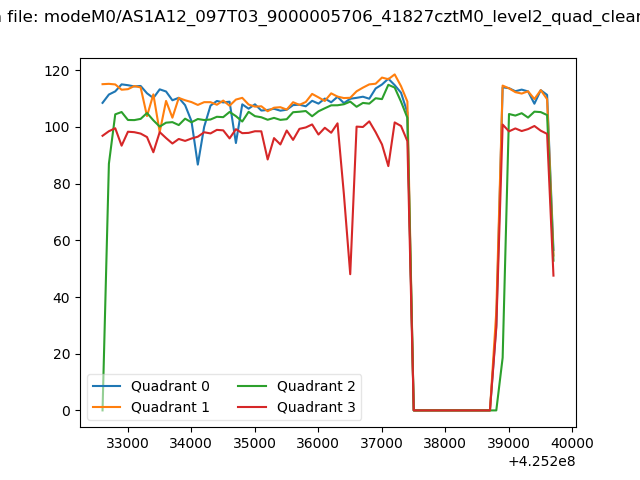 |
|
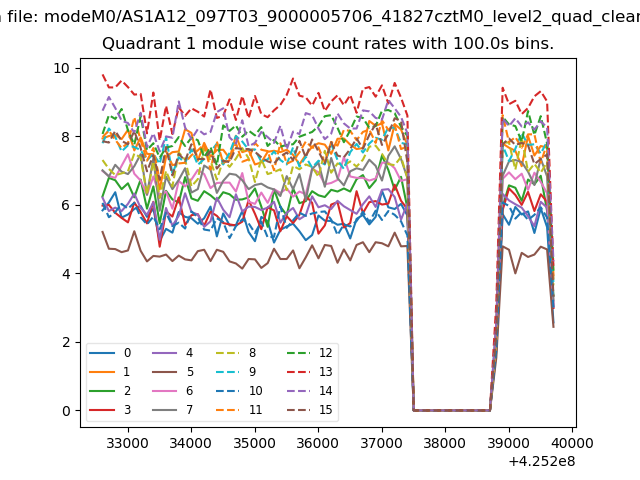
| Module-wise count rates for Quadrant A Data is divided into 100 sec bins |
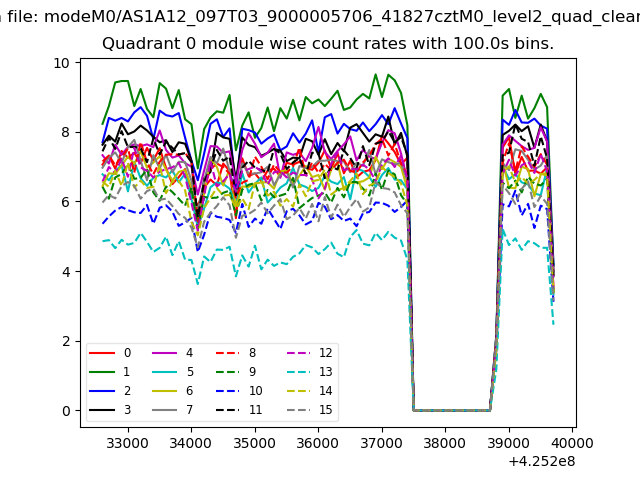 |
 |
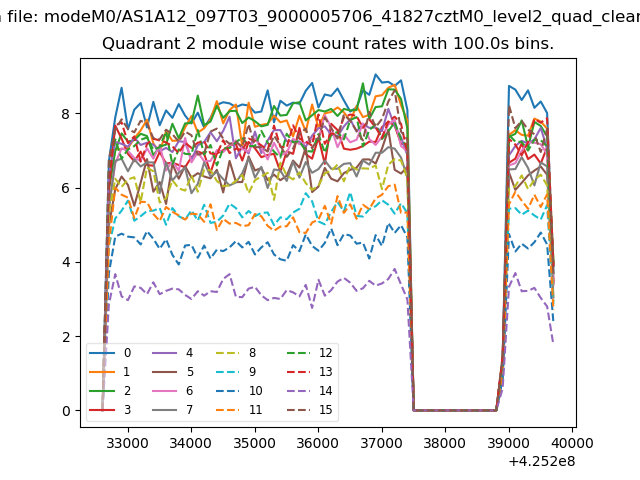
| Module-wise count rates for Quadrant B Data is divided into 100 sec bins |
 |
 |
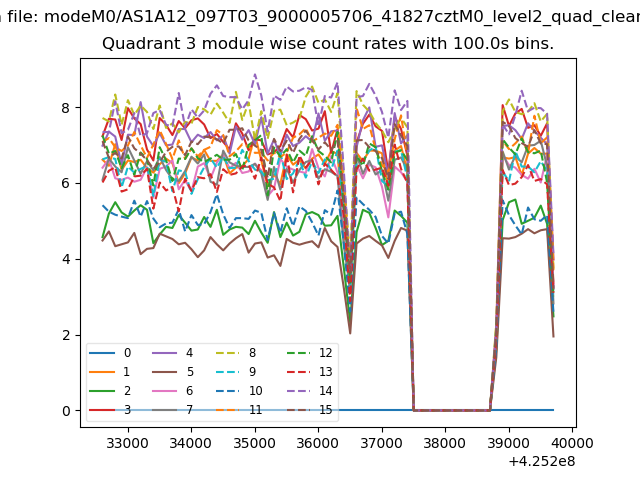
| Module-wise count rates for Quadrant C Data is divided into 100 sec bins |
 |
 |
| Module-wise count rates for Quadrant D Data is divided into 100 sec bins |
 |
 |
| Parameter | Plot |
|---|---|
| CZT HV Monitor | 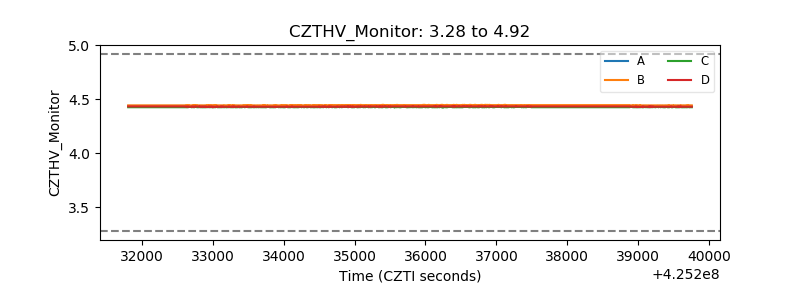 |
| D_VDD | 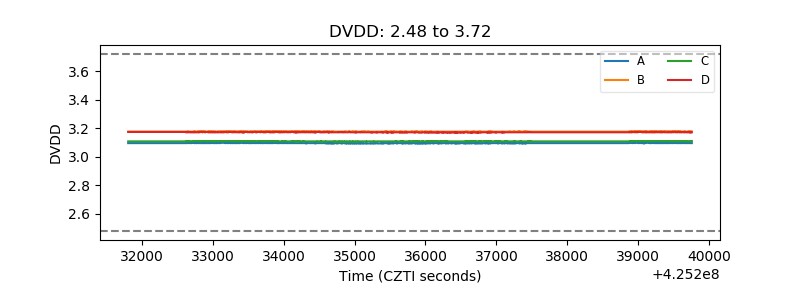 |
| Temperature 1 | 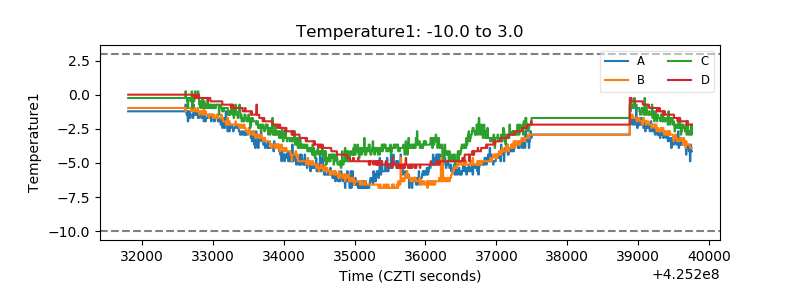 |
| Veto HV Monitor | 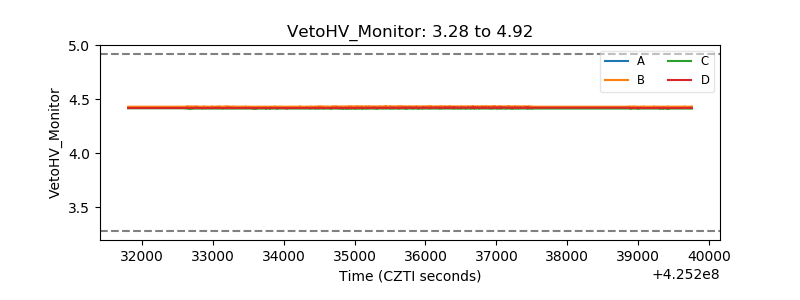 |
| Veto LLD | 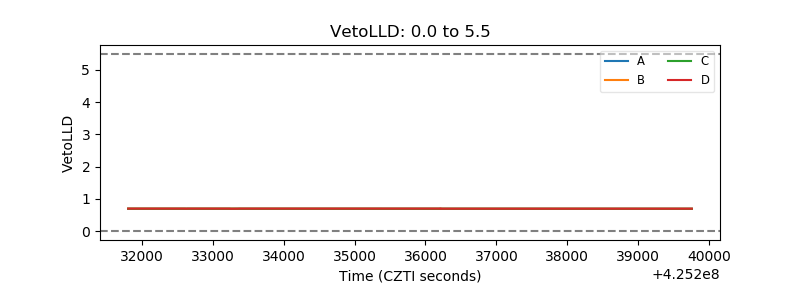 |
| Alpha Counter | 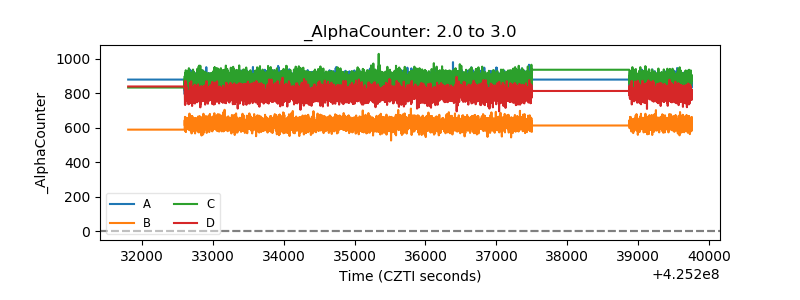 |
| _CPM_Rate | 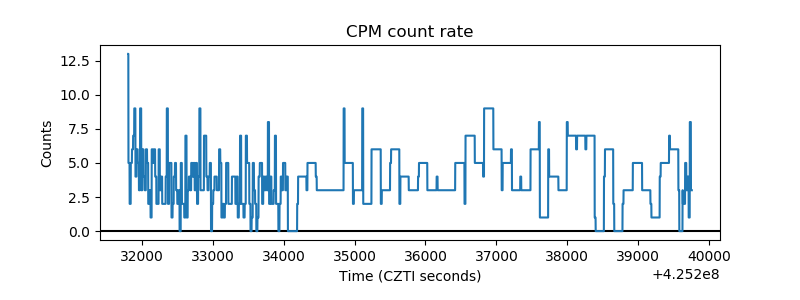 |
| CZT Counter | 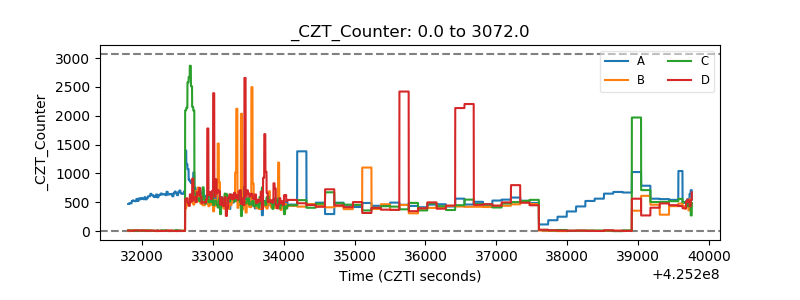 |
| +2.5 Volts monitor |  |
| +5 Volts monitor | 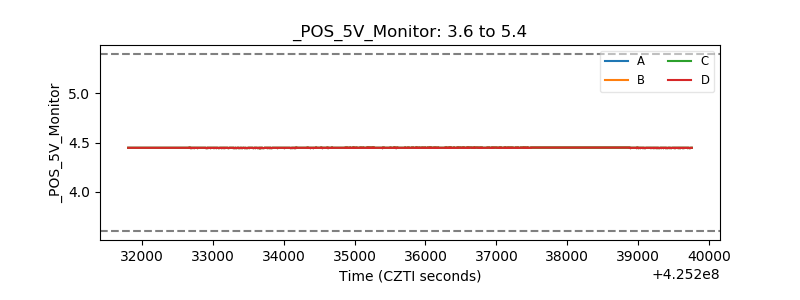 |
| _ROLL_ROT | 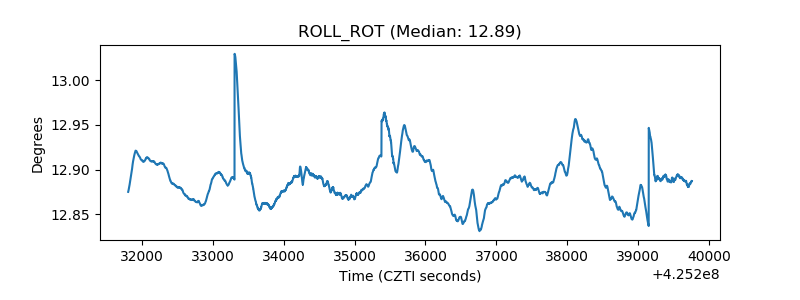 |
| _Roll_DEC | 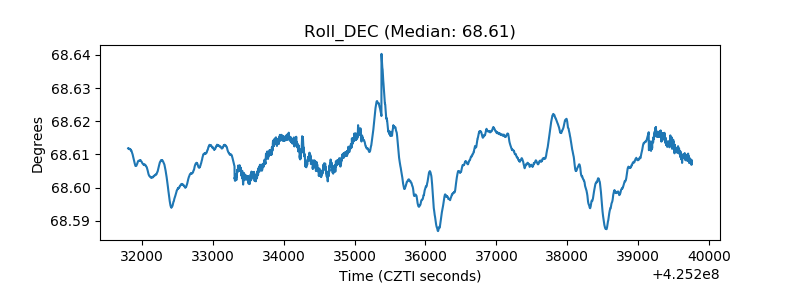 |
| _Roll_RA | 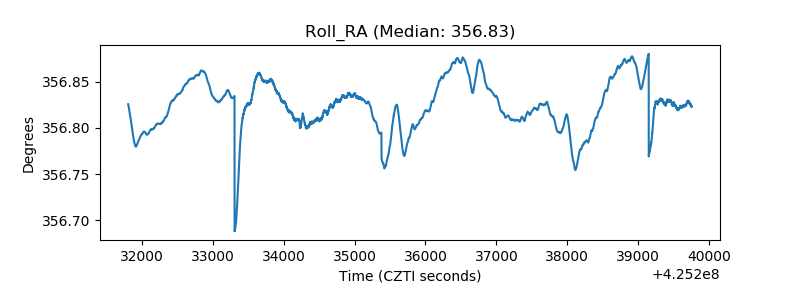 |
| Veto Counter | 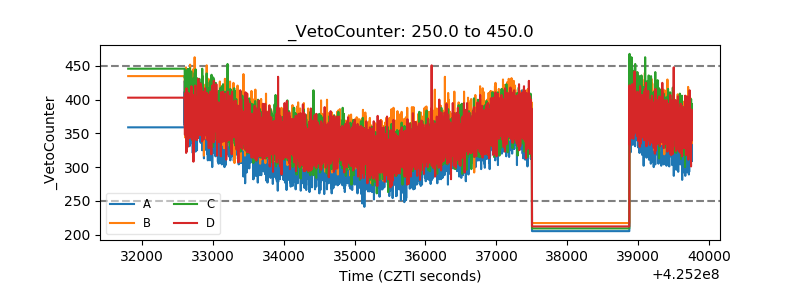 |