| Param | Original file | Final file |
|---|---|---|
| Filename | modeM0/AS1A12_097T03_9000005706_41828cztM0_level2.fits | modeM0/AS1A12_097T03_9000005706_41828cztM0_level2_quad_clean.evt |
| Size (bytes) | 385,845,120 | 93,672,000 |
| Size | 368.0 MB | 89.3 MB |
| Events in quadrant A | 3,136,166 | 645,266 |
| Events in quadrant B | 2,785,312 | 651,683 |
| Events in quadrant C | 3,249,003 | 598,044 |
| Events in quadrant D | 4,653,209 | 529,159 |
| Mode M0 | |||
|---|---|---|---|
| Quadrant | BADHDUFLAG | Total packets | Discarded packets |
| A | 0 | 12961 | 2 |
| B | 0 | 12399 | 2 |
| C | 0 | 13546 | 2 |
| D | 0 | 17983 | 2 |
| Mode SS | |||
|---|---|---|---|
| Quadrant | BADHDUFLAG | Total packets | Discarded packets |
| A | 0 | 120 | 0 |
| B | 0 | 120 | 0 |
| C | 0 | 120 | 0 |
| D | 0 | 120 | 0 |
| Mode M9 | |||
|---|---|---|---|
| Quadrant | BADHDUFLAG | Total packets | Discarded packets |
| A | 0 | 14 | 0 |
| B | 0 | 15 | 0 |
| C | 0 | 15 | 0 |
| D | 0 | 15 | 0 |
| Quadrant | Total seconds | Saturated seconds | Saturation percentage |
|---|---|---|---|
| A | 5895 | 20 | 0.339271% |
| B | 5895 | 19 | 0.322307% |
| C | 5895 | 229 | 3.884648% |
| D | 5895 | 630 | 10.687023% |
Noise dominated data is calculated using 1-second bins in cleaned event files. If a bin has >2000 counts, and if more than 50% of those come from <1% of pixels, then it is considered to be noise-dominated and hence unusable.
| Quadrant | # 1 sec bins | Bins with >0 counts | Bins with >2000 counts | High rate bins dominated by noise | Noise dominated (total time) | Noise dominated (detector-on time) | Marked lightcurve |
|---|---|---|---|---|---|---|---|
| A | 7178 | 5896 | 12 | 12 | 0.17% | 0.20% | 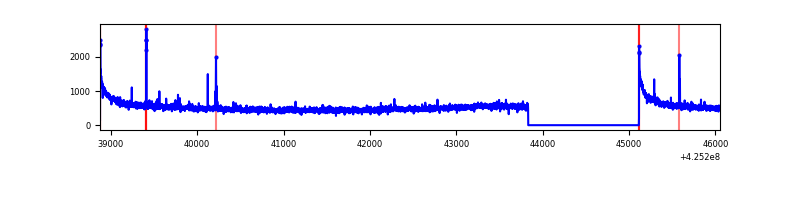 |
| B | 7178 | 5896 | 10 | 10 | 0.14% | 0.17% | 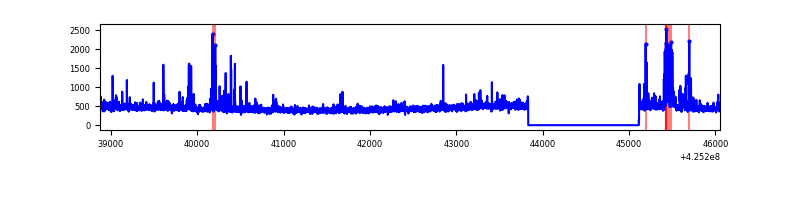 |
| C | 7178 | 5896 | 206 | 206 | 2.87% | 3.49% | 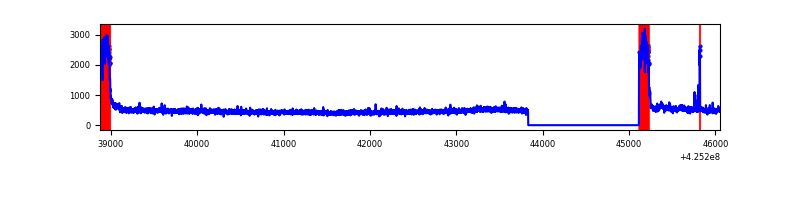 |
| D | 7178 | 5896 | 547 | 547 | 7.62% | 9.28% | 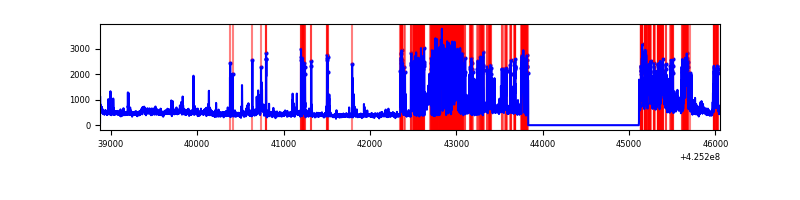 |
Top three noisy pixels from each quadrant. If the there are fewer than three noisy pixels in the level2.evt file, extra rows are filled as -1
| Pixel properties | Quadrant properties | ||||||
|---|---|---|---|---|---|---|---|
| Quadrant | DetID | PixID | Counts | Sigma | Mean | Median | Sigma |
| A | 10 | 83 | 615229 | 4641.23 | 638 | 627 | 132.4 |
| A | 13 | 248 | 13099 | 94.18 | 638 | 627 | 132.4 |
| A | 2 | 79 | 11821 | 84.53 | 638 | 627 | 132.4 |
| B | 4 | 141 | 78395 | 633.71 | 634 | 617 | 122.7 |
| B | 3 | 112 | 60786 | 490.24 | 634 | 617 | 122.7 |
| B | 0 | 245 | 46584 | 374.52 | 634 | 617 | 122.7 |
| C | 0 | 10 | 646879 | 4616.99 | 601 | 604 | 140.0 |
| C | 15 | 214 | 229028 | 1631.86 | 601 | 604 | 140.0 |
| C | 14 | 254 | 24564 | 171.17 | 601 | 604 | 140.0 |
| D | 5 | 222 | 1744202 | 11965.31 | 591 | 573 | 145.7 |
| D | 13 | 249 | 226045 | 1547.26 | 591 | 573 | 145.7 |
| D | 12 | 79 | 119609 | 816.86 | 591 | 573 | 145.7 |
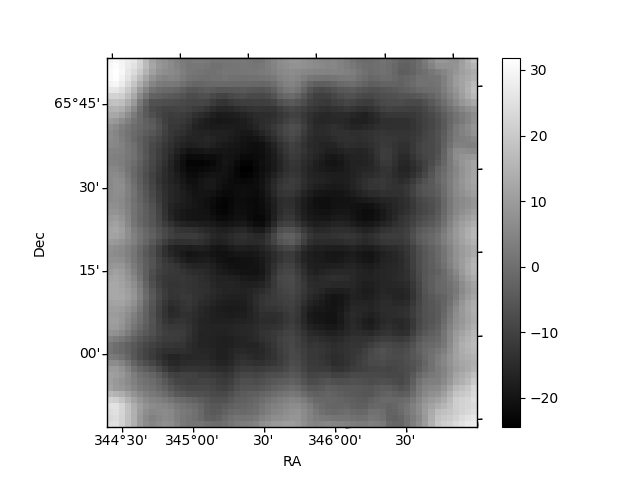
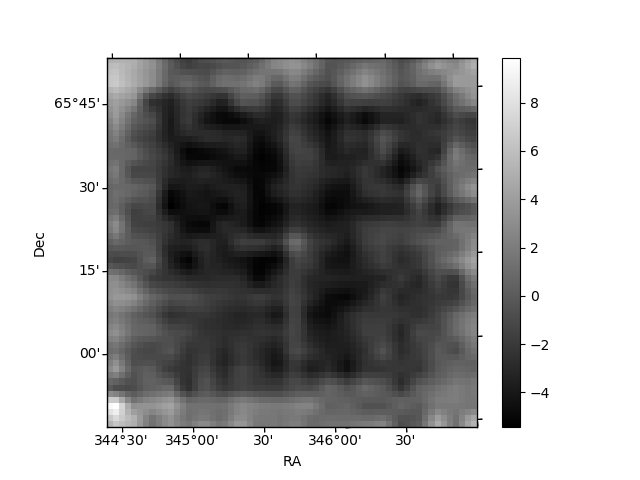
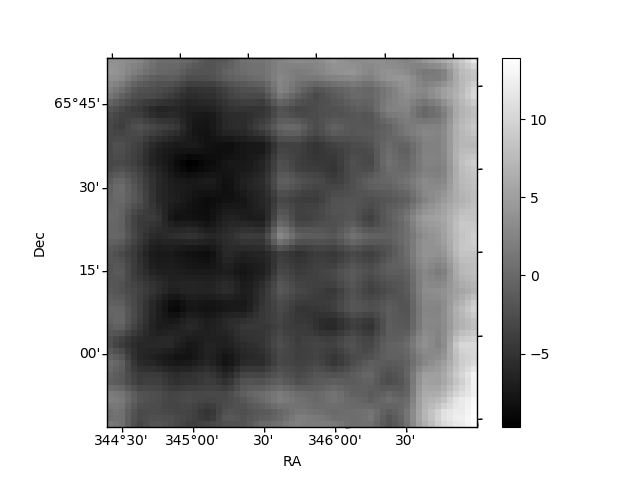
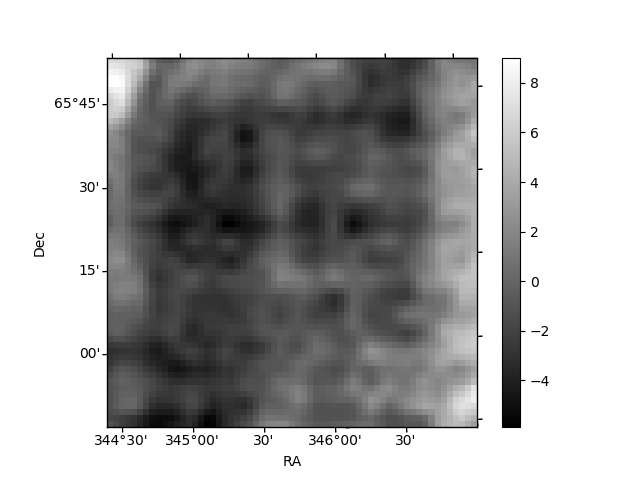
Histogram calculated using DETX and DETY for each event in the final _common_clean file
| Quadrant A | 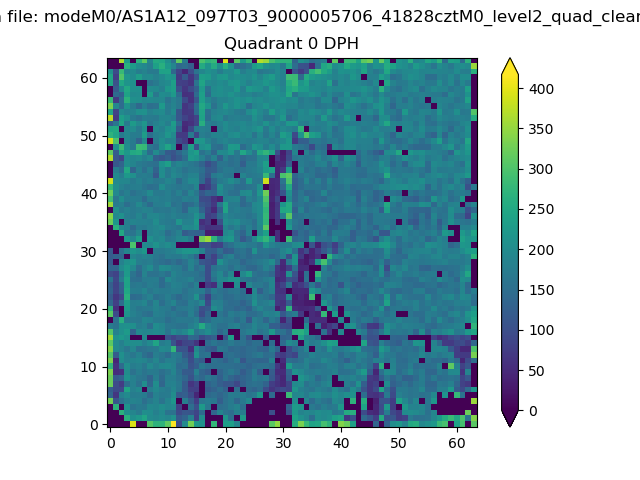 |
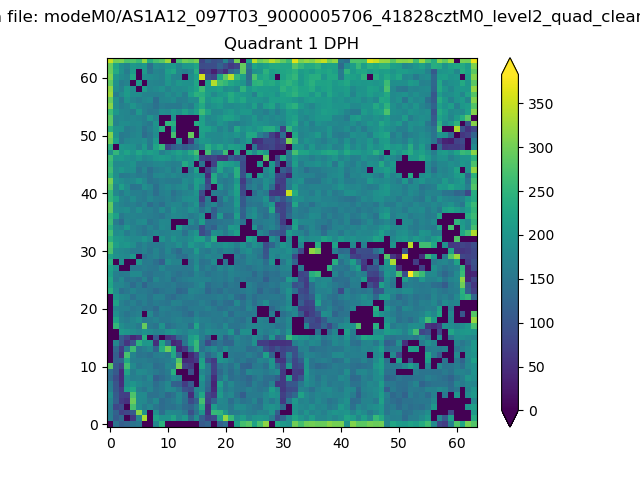 |
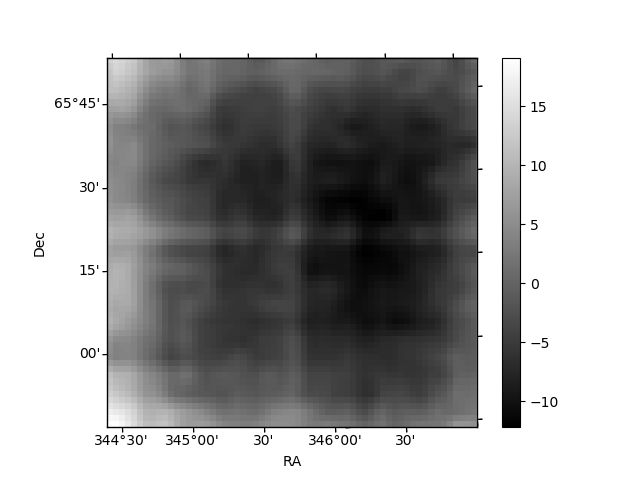
Quadrant B |
|---|---|---|---|
| Quadrant D | 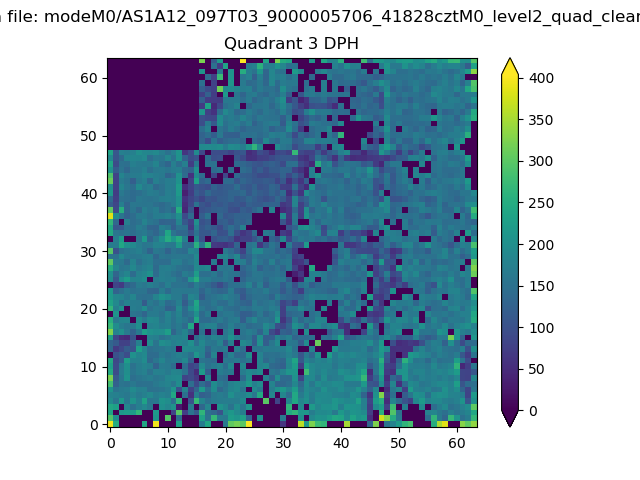 |
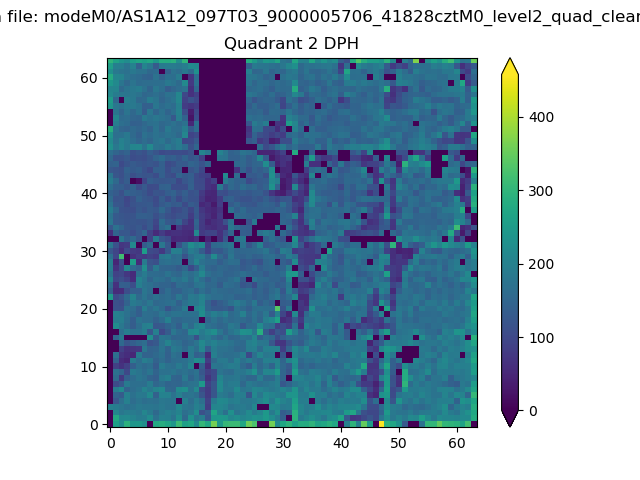 |
Quadrant C |
| Plot type | Count rate plots | Images |
|---|---|---|
| Comparison with Poisson distribution Blue bars denote a histogram of data divided into 1 sec bins. Red curve is a Poisson curve with rate = median count rate of data. |
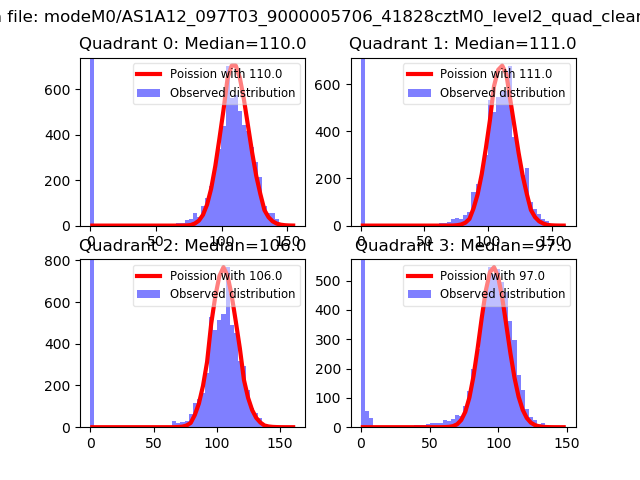 |
 |
| Quadrant-wise count rates Data is divided into 100 sec bins |
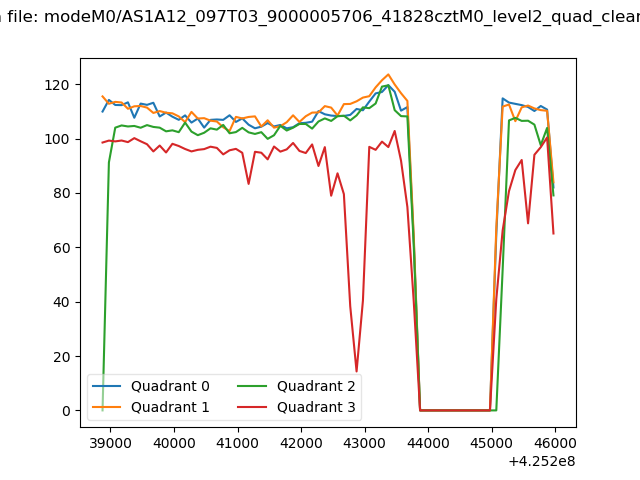 |
|
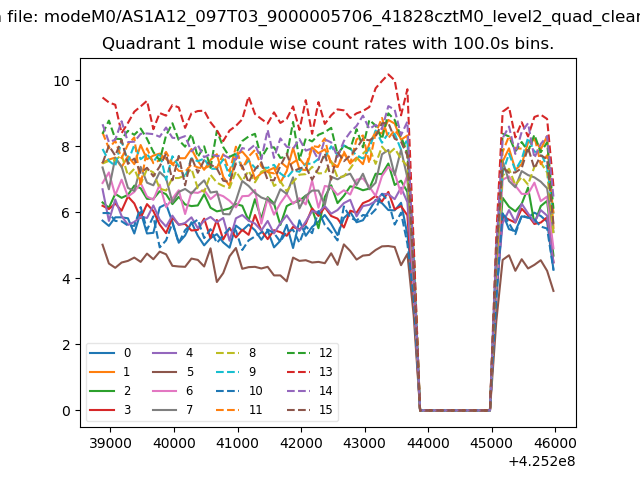
| Module-wise count rates for Quadrant A Data is divided into 100 sec bins |
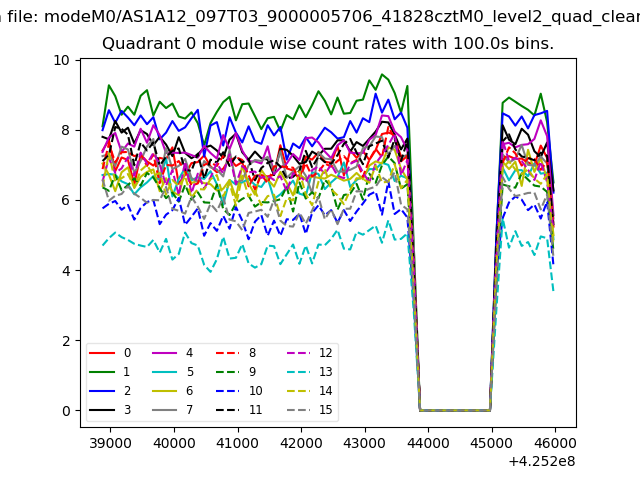 |
 |
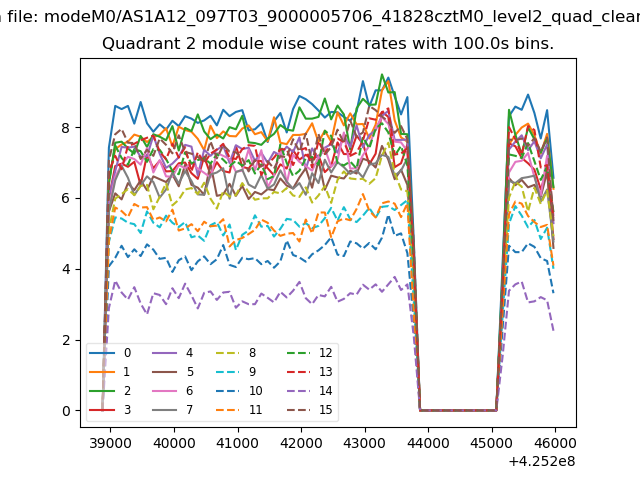
| Module-wise count rates for Quadrant B Data is divided into 100 sec bins |
 |
 |
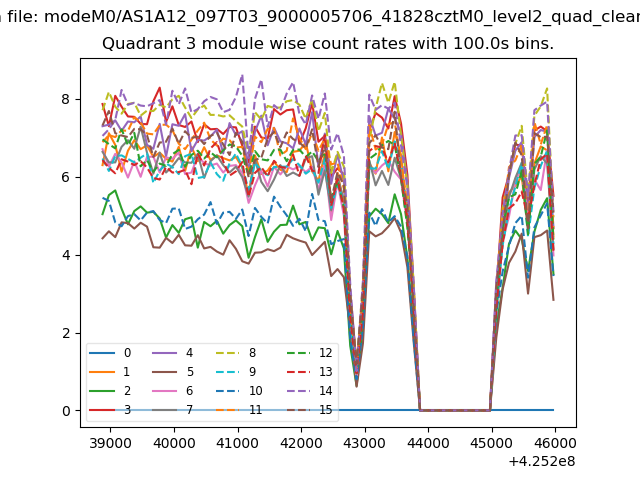
| Module-wise count rates for Quadrant C Data is divided into 100 sec bins |
 |
 |
| Module-wise count rates for Quadrant D Data is divided into 100 sec bins |
 |
 |
| Parameter | Plot |
|---|---|
| CZT HV Monitor | 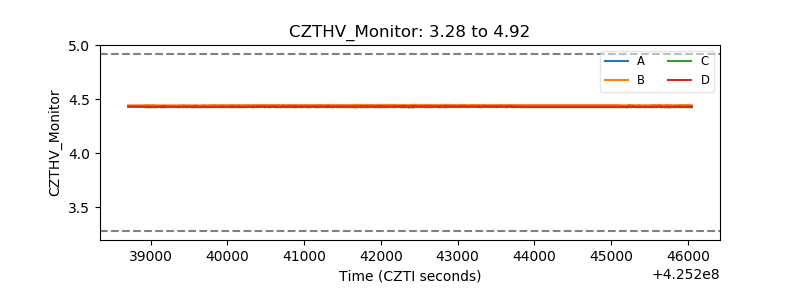 |
| D_VDD | 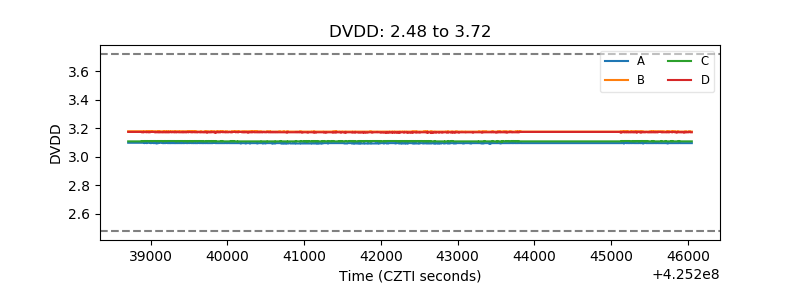 |
| Temperature 1 | 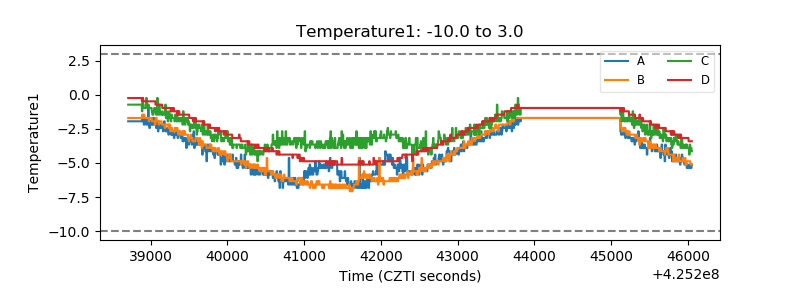 |
| Veto HV Monitor | 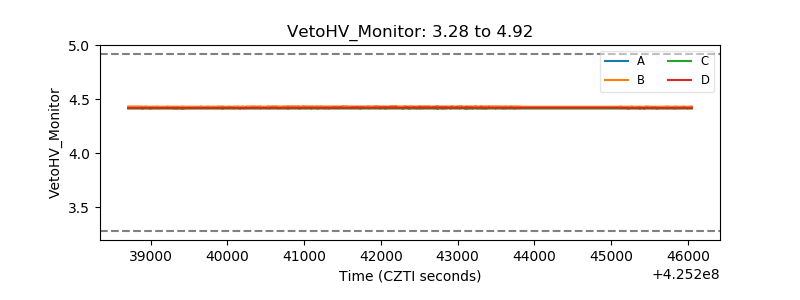 |
| Veto LLD | 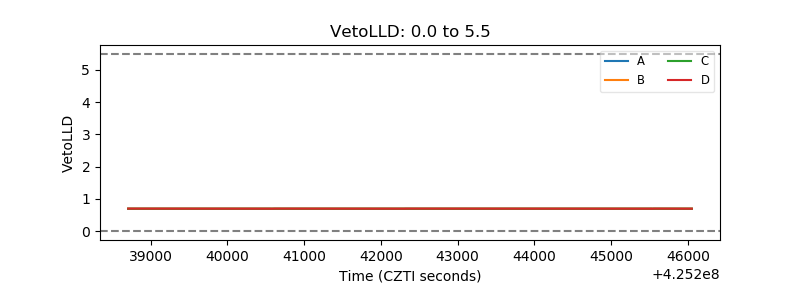 |
| Alpha Counter | 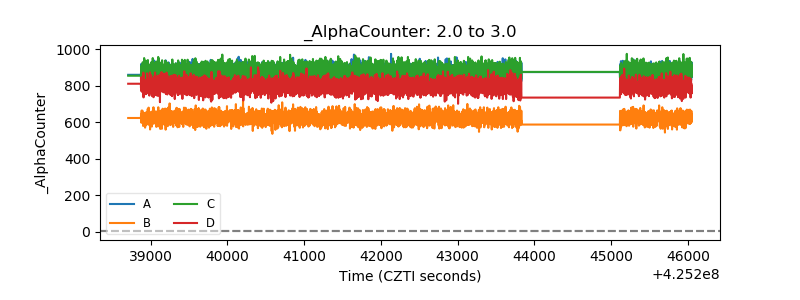 |
| _CPM_Rate | 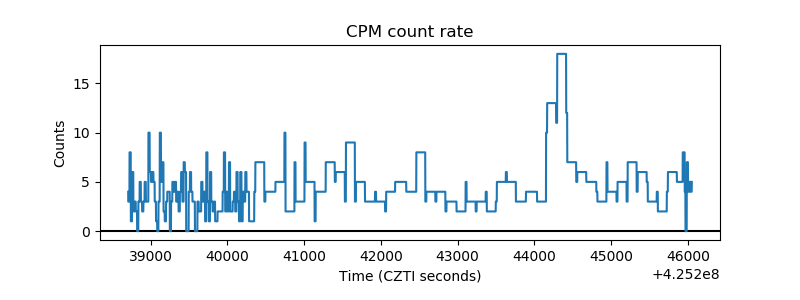 |
| CZT Counter | 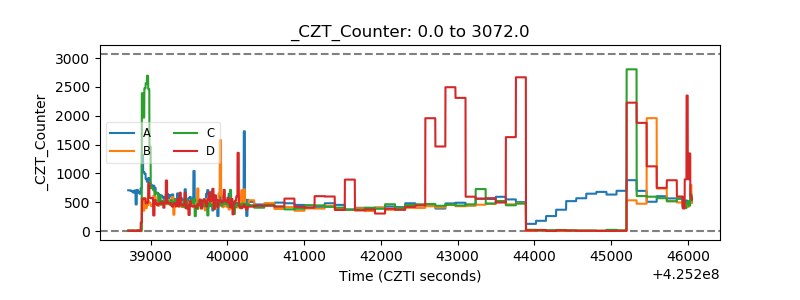 |
| +2.5 Volts monitor | 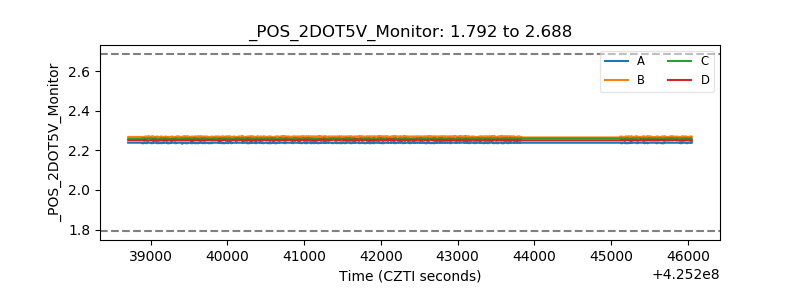 |
| +5 Volts monitor | 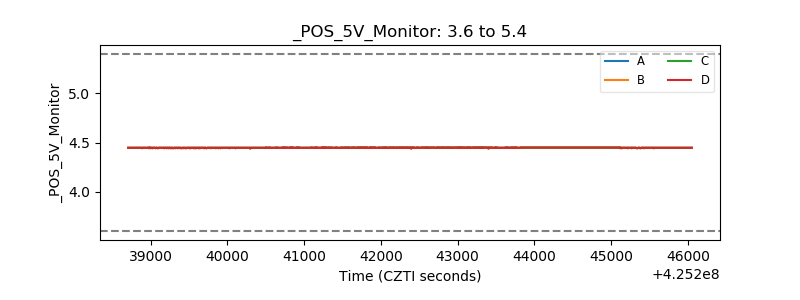 |
| _ROLL_ROT | 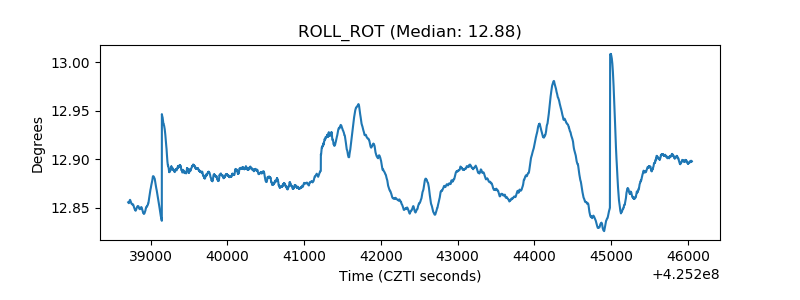 |
| _Roll_DEC | 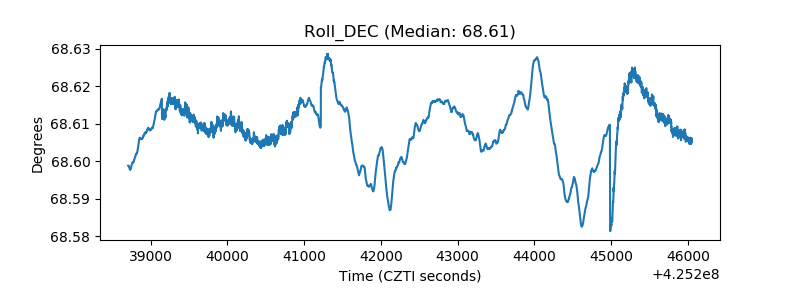 |
| _Roll_RA | 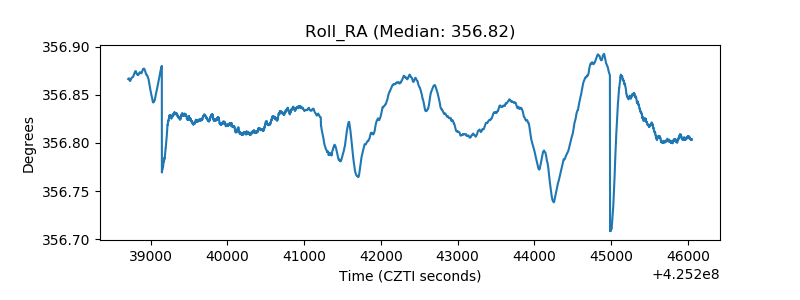 |
| Veto Counter | 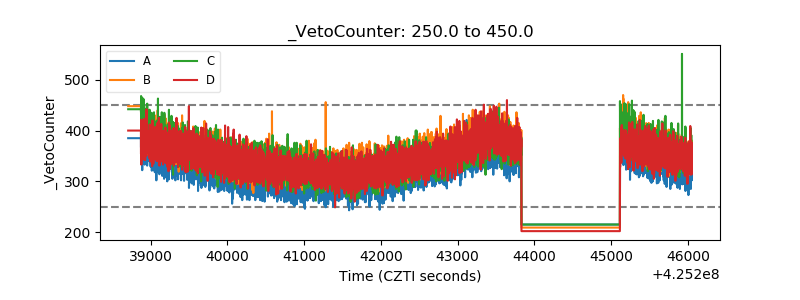 |