| Param | Original file | Final file |
|---|---|---|
| Filename | modeM0/AS1A12_097T03_9000005706_41830cztM0_level2.fits | modeM0/AS1A12_097T03_9000005706_41830cztM0_level2_quad_clean.evt |
| Size (bytes) | 135,457,920 | 27,904,320 |
| Size | 129.2 MB | 26.6 MB |
| Events in quadrant A | 971,743 | 194,168 |
| Events in quadrant B | 883,317 | 192,883 |
| Events in quadrant C | 1,127,031 | 172,597 |
| Events in quadrant D | 1,891,548 | 155,956 |
| Mode M0 | |||
|---|---|---|---|
| Quadrant | BADHDUFLAG | Total packets | Discarded packets |
| A | 0 | 4022 | 1 |
| B | 0 | 3894 | 1 |
| C | 0 | 4486 | 1 |
| D | 0 | 6836 | 1 |
| Mode SS | |||
|---|---|---|---|
| Quadrant | BADHDUFLAG | Total packets | Discarded packets |
| A | 0 | 34 | 0 |
| B | 0 | 34 | 0 |
| C | 0 | 34 | 0 |
| D | 0 | 34 | 0 |
| Mode M9 | |||
|---|---|---|---|
| Quadrant | BADHDUFLAG | Total packets | Discarded packets |
| A | 0 | 6 | 0 |
| B | 0 | 7 | 0 |
| C | 0 | 7 | 0 |
| D | 0 | 7 | 0 |
| Quadrant | Total seconds | Saturated seconds | Saturation percentage |
|---|---|---|---|
| A | 1774 | 7 | 0.394589% |
| B | 1774 | 13 | 0.732807% |
| C | 1774 | 117 | 6.595265% |
| D | 1774 | 240 | 13.528749% |
Noise dominated data is calculated using 1-second bins in cleaned event files. If a bin has >2000 counts, and if more than 50% of those come from <1% of pixels, then it is considered to be noise-dominated and hence unusable.
| Quadrant | # 1 sec bins | Bins with >0 counts | Bins with >2000 counts | High rate bins dominated by noise | Noise dominated (total time) | Noise dominated (detector-on time) | Marked lightcurve |
|---|---|---|---|---|---|---|---|
| A | 1774 | 1774 | 4 | 4 | 0.23% | 0.23% | 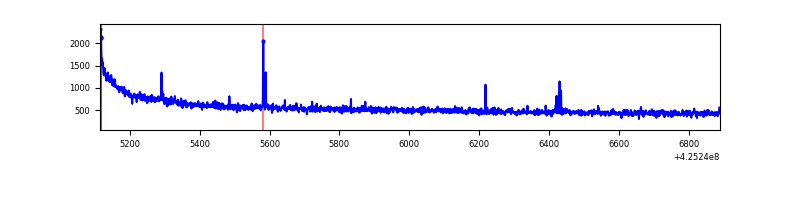 |
| B | 1774 | 1774 | 8 | 8 | 0.45% | 0.45% | 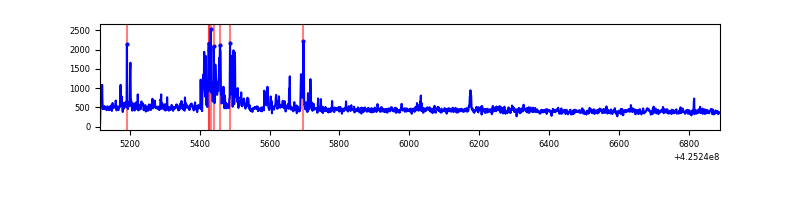 |
| C | 1774 | 1774 | 104 | 104 | 5.86% | 5.86% | 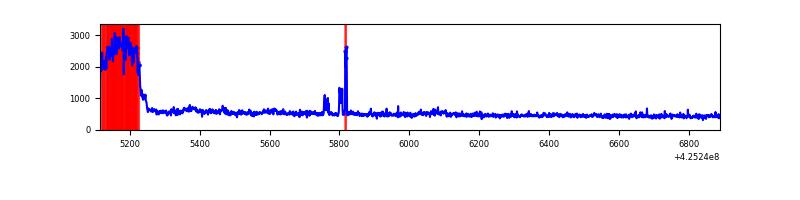 |
| D | 1774 | 1774 | 239 | 239 | 13.47% | 13.47% | 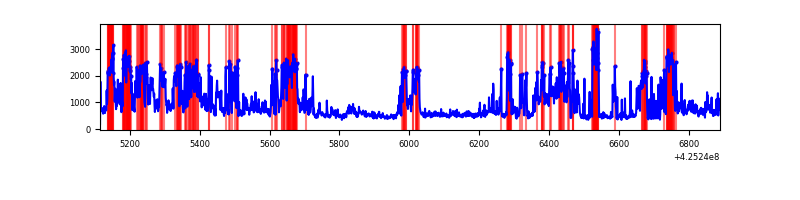 |
Top three noisy pixels from each quadrant. If the there are fewer than three noisy pixels in the level2.evt file, extra rows are filled as -1
| Pixel properties | Quadrant properties | ||||||
|---|---|---|---|---|---|---|---|
| Quadrant | DetID | PixID | Counts | Sigma | Mean | Median | Sigma |
| A | 10 | 83 | 229718 | 5666.61 | 187 | 182 | 40.5 |
| A | 2 | 79 | 2892 | 66.89 | 187 | 182 | 40.5 |
| A | 13 | 254 | 2819 | 65.09 | 187 | 182 | 40.5 |
| B | 4 | 141 | 71055 | 1867.75 | 187 | 182 | 37.9 |
| B | 0 | 183 | 14407 | 374.88 | 187 | 182 | 37.9 |
| B | 0 | 186 | 14332 | 372.9 | 187 | 182 | 37.9 |
| C | 0 | 10 | 340285 | 7797.73 | 178 | 178 | 43.6 |
| C | 15 | 214 | 69164 | 1581.66 | 178 | 178 | 43.6 |
| C | 14 | 254 | 22223 | 505.43 | 178 | 178 | 43.6 |
| D | 5 | 222 | 739889 | 16301.81 | 178 | 172 | 45.4 |
| D | 13 | 249 | 238171 | 5245.0 | 178 | 172 | 45.4 |
| D | 12 | 79 | 68577 | 1507.5 | 178 | 172 | 45.4 |
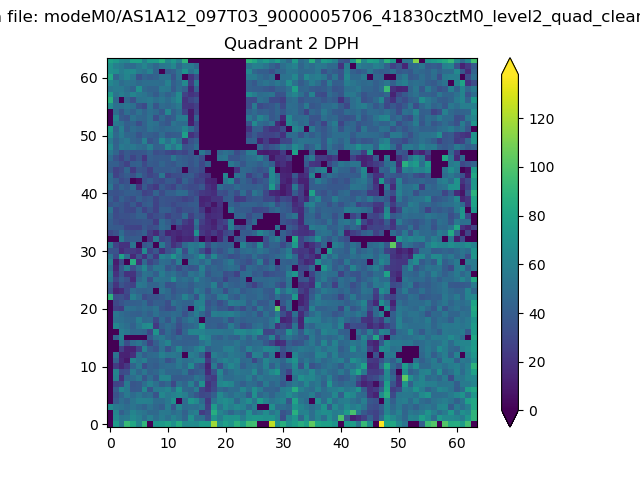
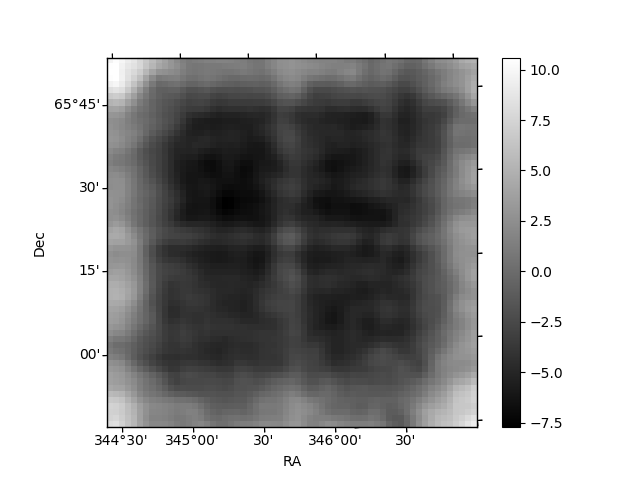
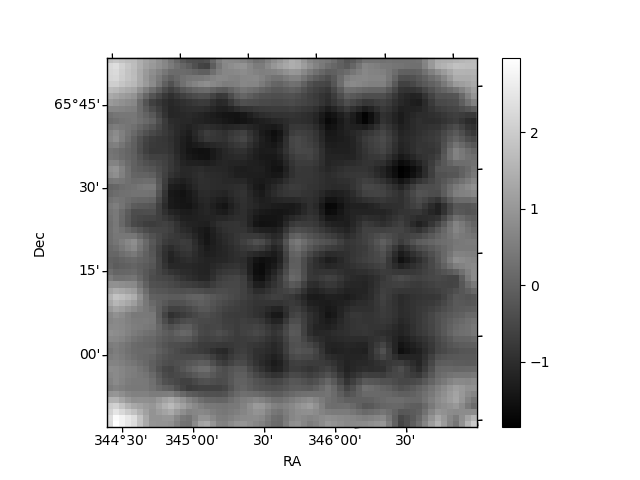
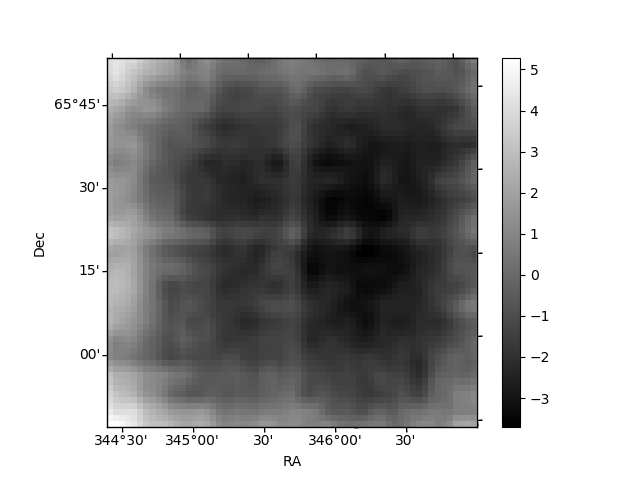
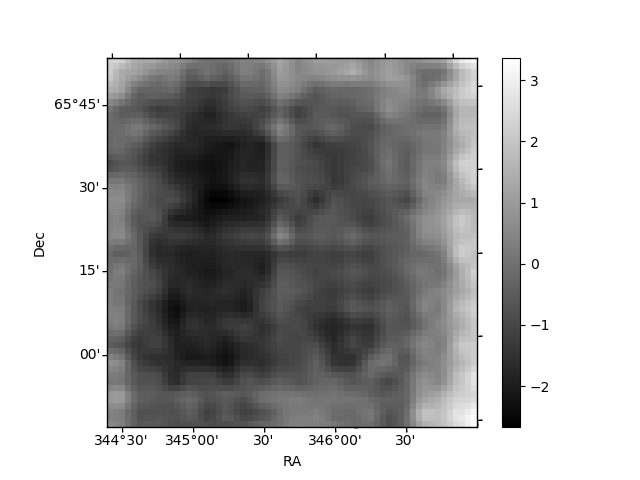
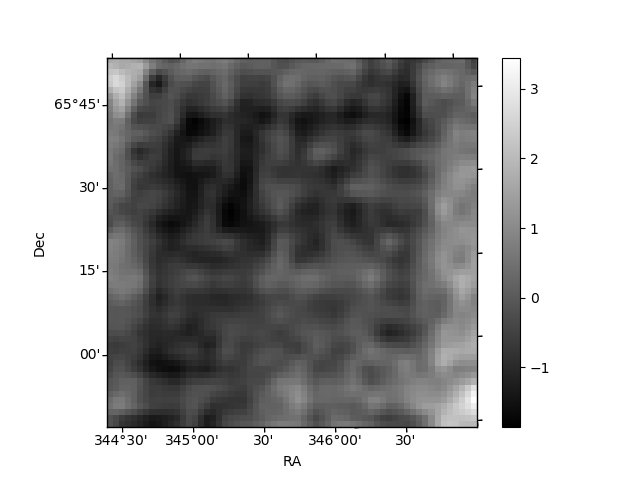
Histogram calculated using DETX and DETY for each event in the final _common_clean file
| Quadrant A | 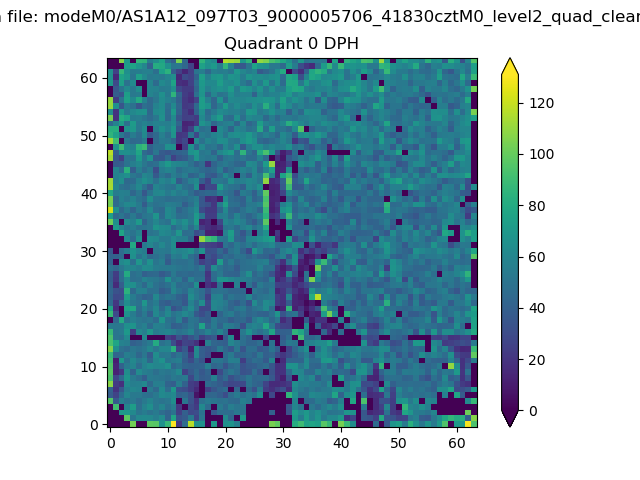 |
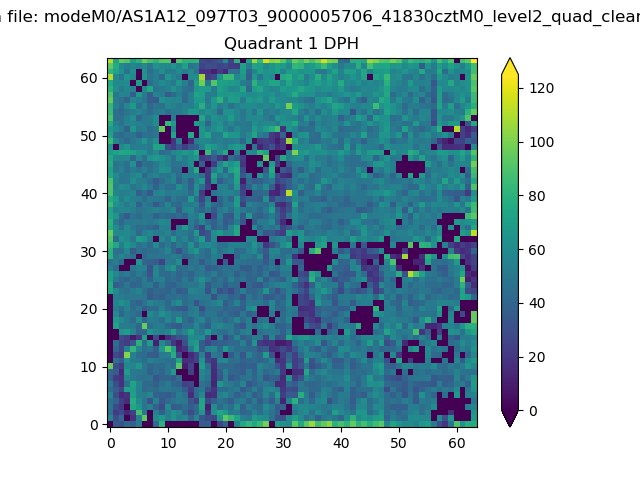 |
Quadrant B |
|---|---|---|---|
| Quadrant D | 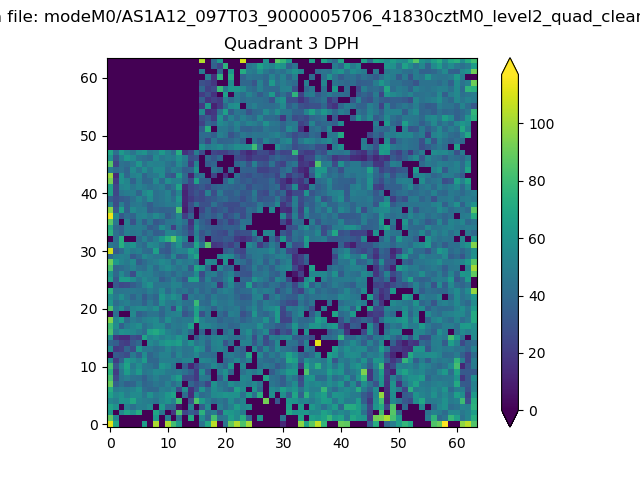 |
 |
Quadrant C |
| Plot type | Count rate plots | Images |
|---|---|---|
| Comparison with Poisson distribution Blue bars denote a histogram of data divided into 1 sec bins. Red curve is a Poisson curve with rate = median count rate of data. |
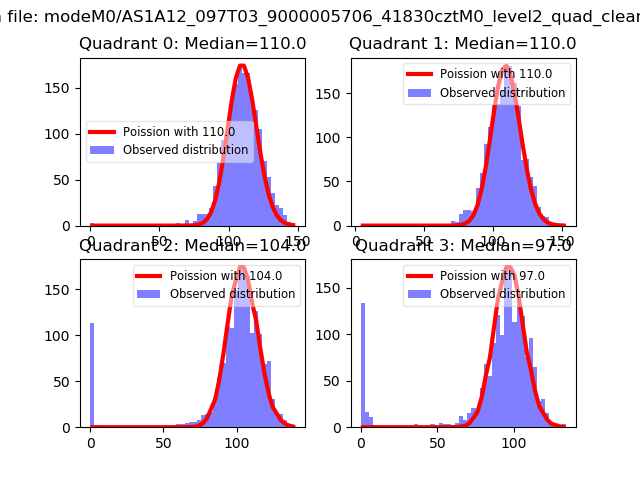 |
 |
| Quadrant-wise count rates Data is divided into 100 sec bins |
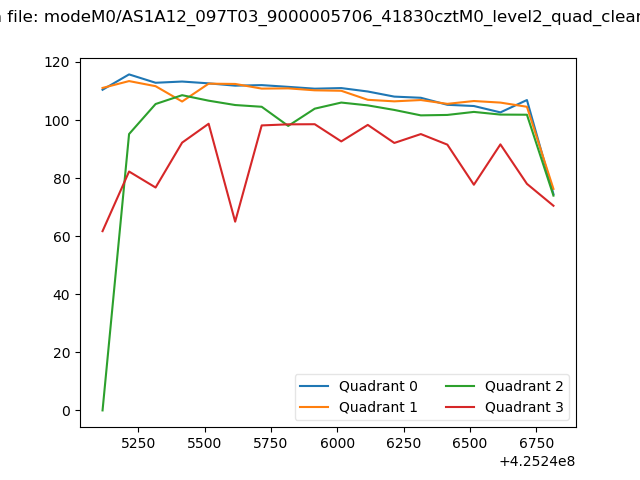 |
|
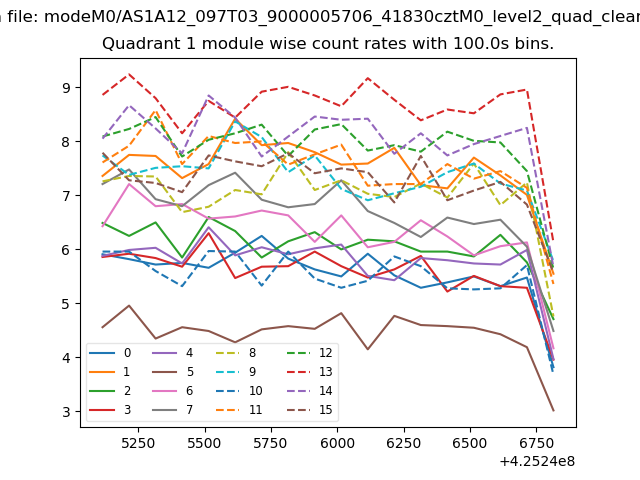
| Module-wise count rates for Quadrant A Data is divided into 100 sec bins |
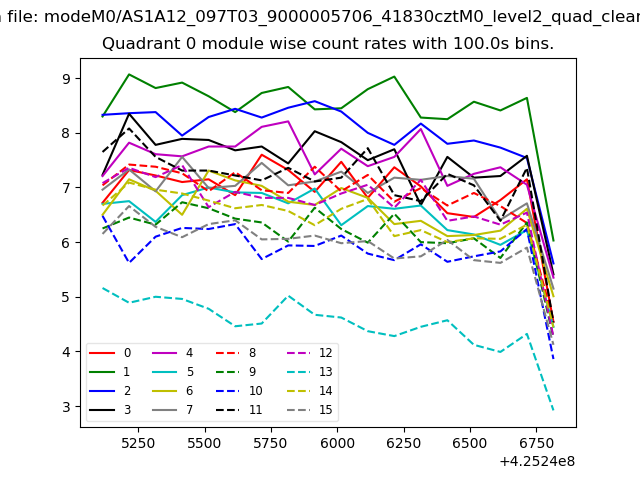 |
 |
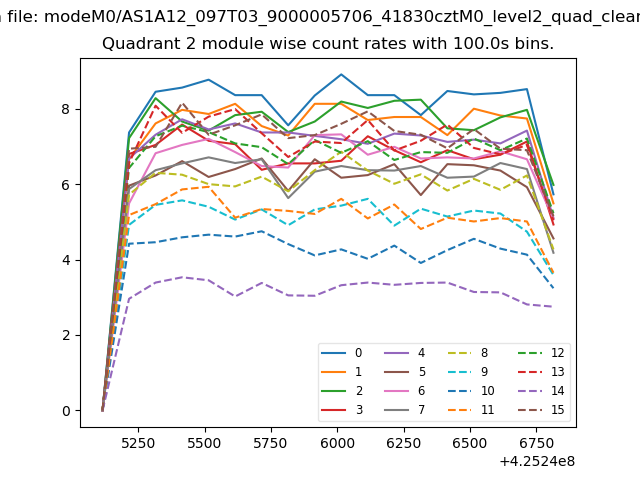
| Module-wise count rates for Quadrant B Data is divided into 100 sec bins |
 |
 |
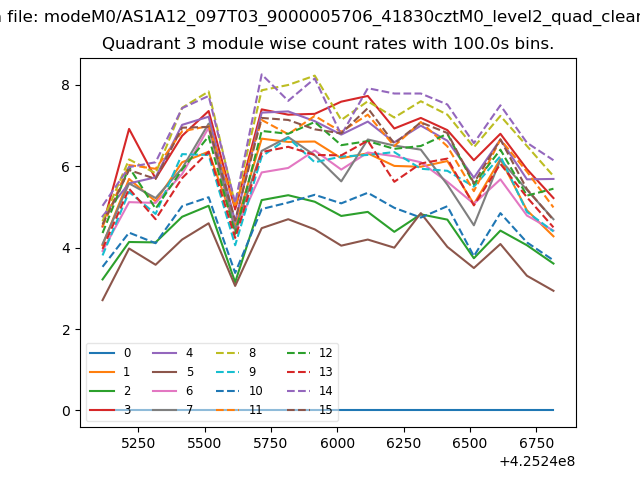
| Module-wise count rates for Quadrant C Data is divided into 100 sec bins |
 |
 |
| Module-wise count rates for Quadrant D Data is divided into 100 sec bins |
 |
 |
| Parameter | Plot |
|---|---|
| CZT HV Monitor | 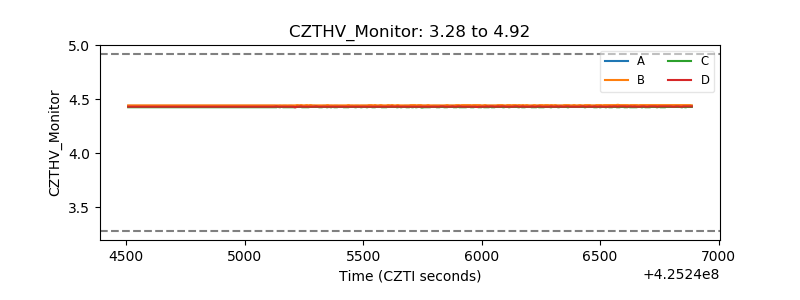 |
| D_VDD | 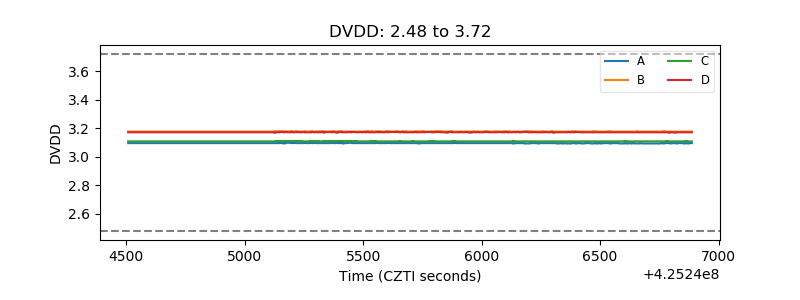 |
| Temperature 1 | 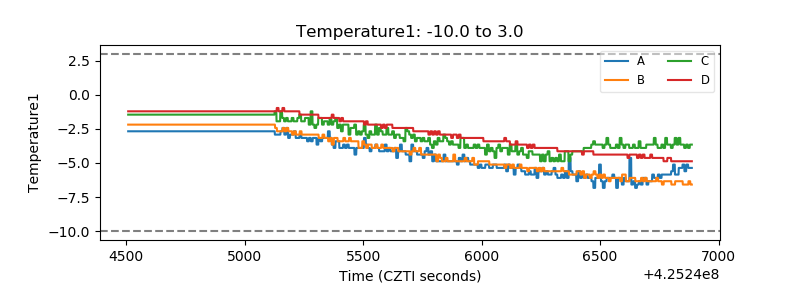 |
| Veto HV Monitor | 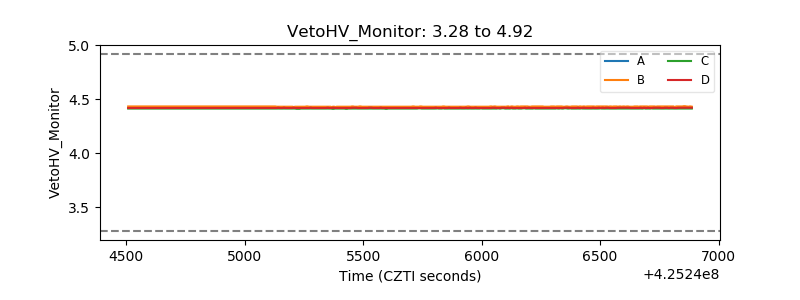 |
| Veto LLD | 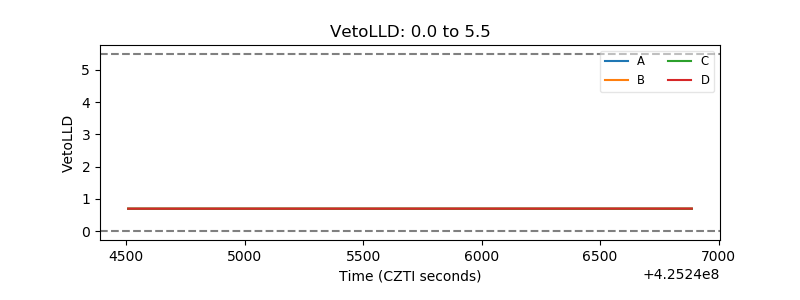 |
| Alpha Counter | 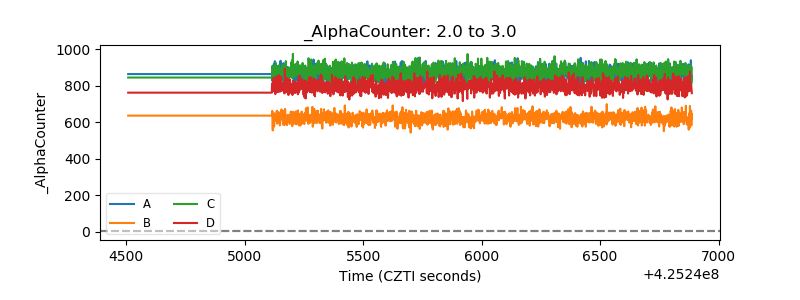 |
| _CPM_Rate | 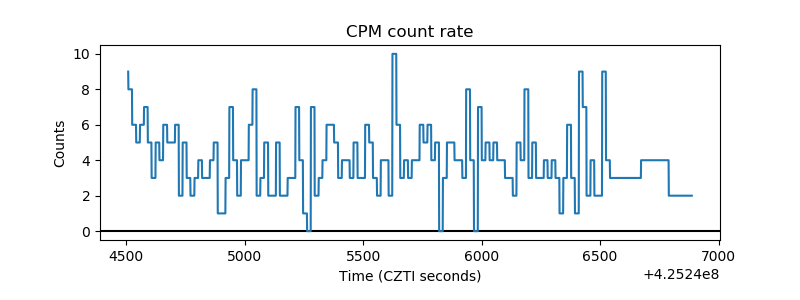 |
| CZT Counter | 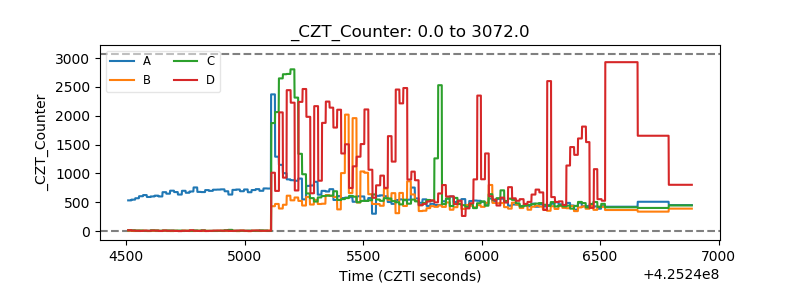 |
| +2.5 Volts monitor | 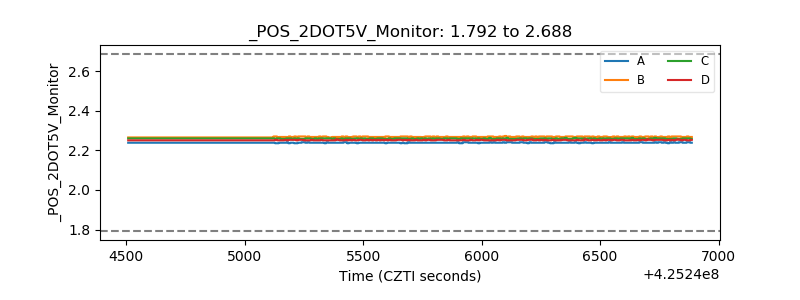 |
| +5 Volts monitor | 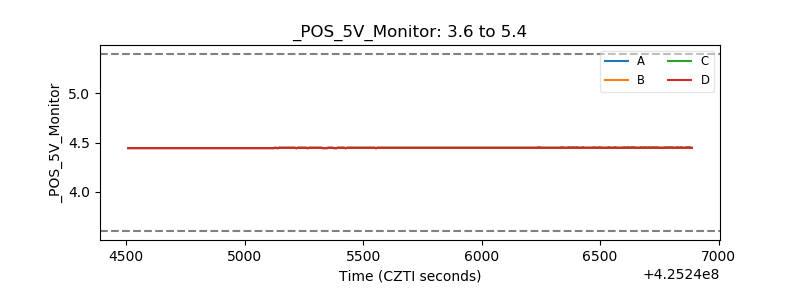 |
| _ROLL_ROT | 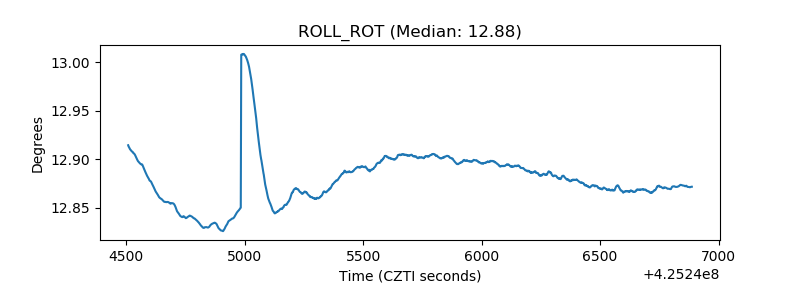 |
| _Roll_DEC | 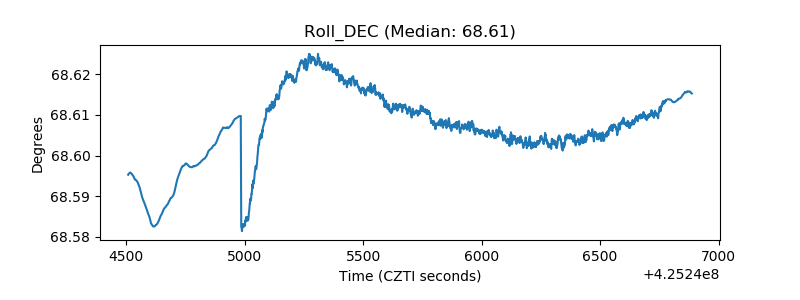 |
| _Roll_RA | 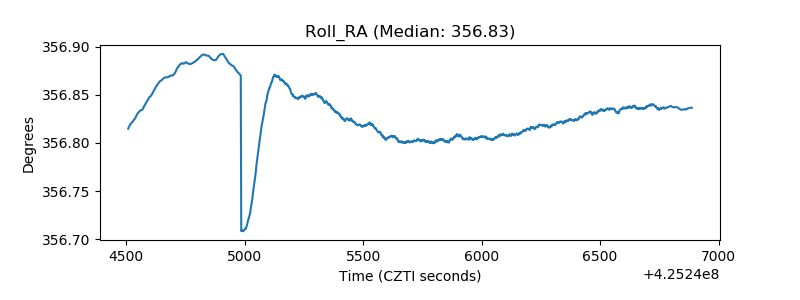 |
| Veto Counter | 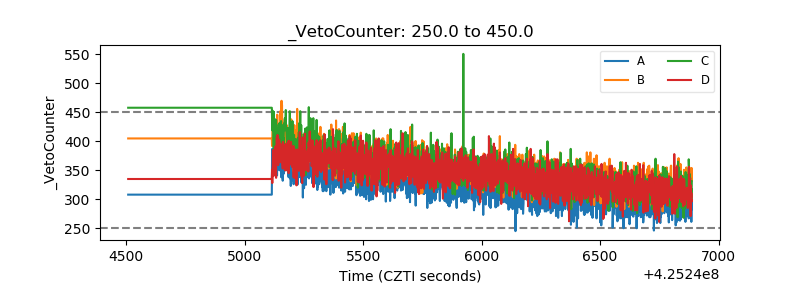 |