| Param | Original file | Final file |
|---|---|---|
| Filename | modeM0/AS1A12_097T03_9000005706_41832cztM0_level2.fits | modeM0/AS1A12_097T03_9000005706_41832cztM0_level2_quad_clean.evt |
| Size (bytes) | 77,647,680 | 19,379,520 |
| Size | 74.1 MB | 18.5 MB |
| Events in quadrant A | 569,774 | 130,112 |
| Events in quadrant B | 523,620 | 129,987 |
| Events in quadrant C | 582,910 | 123,910 |
| Events in quadrant D | 1,100,749 | 111,844 |
| Mode M0 | |||
|---|---|---|---|
| Quadrant | BADHDUFLAG | Total packets | Discarded packets |
| A | 0 | 2437 | 0 |
| B | 0 | 2473 | 0 |
| C | 0 | 2510 | 0 |
| D | 0 | 4080 | 0 |
| Mode SS | |||
|---|---|---|---|
| Quadrant | BADHDUFLAG | Total packets | Discarded packets |
| A | 0 | 24 | 0 |
| B | 0 | 24 | 0 |
| C | 0 | 24 | 0 |
| D | 0 | 24 | 0 |
| Quadrant | Total seconds | Saturated seconds | Saturation percentage |
|---|---|---|---|
| A | 1210 | 0 | 0.000000% |
| B | 1210 | 1 | 0.082645% |
| C | 1210 | 5 | 0.413223% |
| D | 1210 | 86 | 7.107438% |
Noise dominated data is calculated using 1-second bins in cleaned event files. If a bin has >2000 counts, and if more than 50% of those come from <1% of pixels, then it is considered to be noise-dominated and hence unusable.
| Quadrant | # 1 sec bins | Bins with >0 counts | Bins with >2000 counts | High rate bins dominated by noise | Noise dominated (total time) | Noise dominated (detector-on time) | Marked lightcurve |
|---|---|---|---|---|---|---|---|
| A | 1210 | 1210 | 0 | 0 | 0.00% | 0.00% | 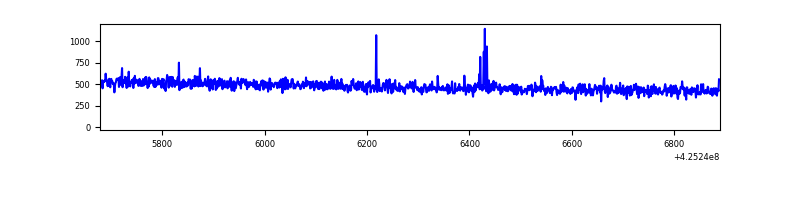 |
| B | 1210 | 1210 | 1 | 1 | 0.08% | 0.08% | 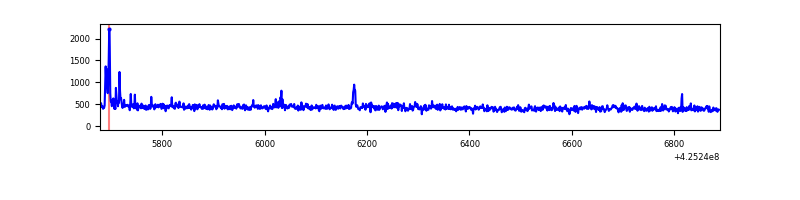 |
| C | 1210 | 1210 | 3 | 3 | 0.25% | 0.25% | 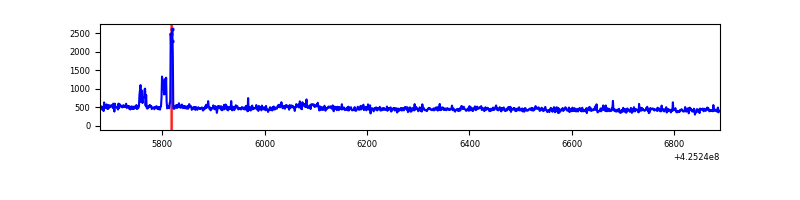 |
| D | 1210 | 1210 | 106 | 106 | 8.76% | 8.76% | 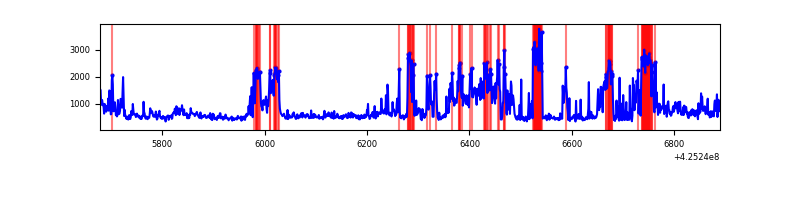 |
Top three noisy pixels from each quadrant. If the there are fewer than three noisy pixels in the level2.evt file, extra rows are filled as -1
| Pixel properties | Quadrant properties | ||||||
|---|---|---|---|---|---|---|---|
| Quadrant | DetID | PixID | Counts | Sigma | Mean | Median | Sigma |
| A | 10 | 83 | 88020 | 3192.25 | 123 | 120 | 27.5 |
| A | 7 | 3 | 2740 | 95.15 | 123 | 120 | 27.5 |
| A | 13 | 254 | 1957 | 66.71 | 123 | 120 | 27.5 |
| B | 4 | 141 | 13116 | 497.89 | 123 | 119 | 26.1 |
| B | 0 | 183 | 9956 | 376.83 | 123 | 119 | 26.1 |
| B | 0 | 245 | 7055 | 265.7 | 123 | 119 | 26.1 |
| C | 15 | 214 | 46597 | 1483.87 | 124 | 124 | 31.3 |
| C | 0 | 10 | 29626 | 941.99 | 124 | 124 | 31.3 |
| C | 14 | 254 | 22051 | 700.12 | 124 | 124 | 31.3 |
| D | 5 | 222 | 314039 | 10068.27 | 119 | 115 | 31.2 |
| D | 13 | 249 | 182125 | 5837.48 | 119 | 115 | 31.2 |
| D | 7 | 112 | 52534 | 1681.2 | 119 | 115 | 31.2 |
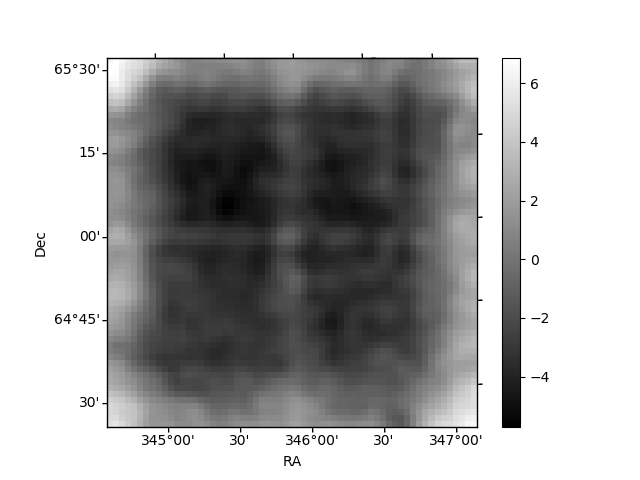
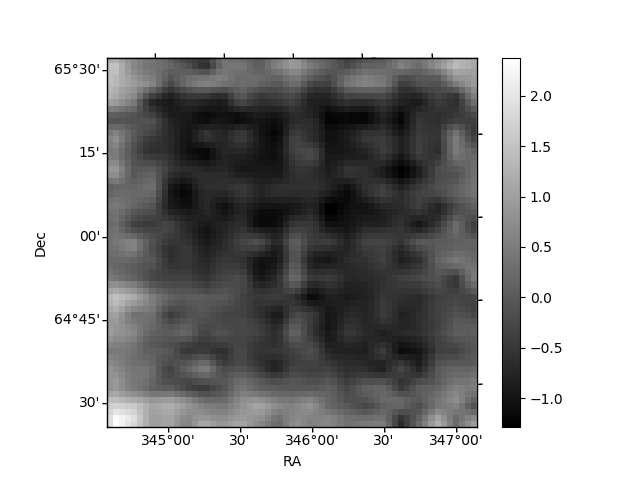
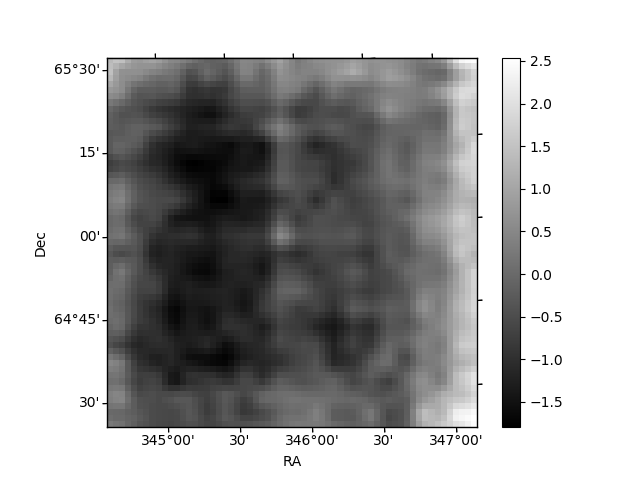
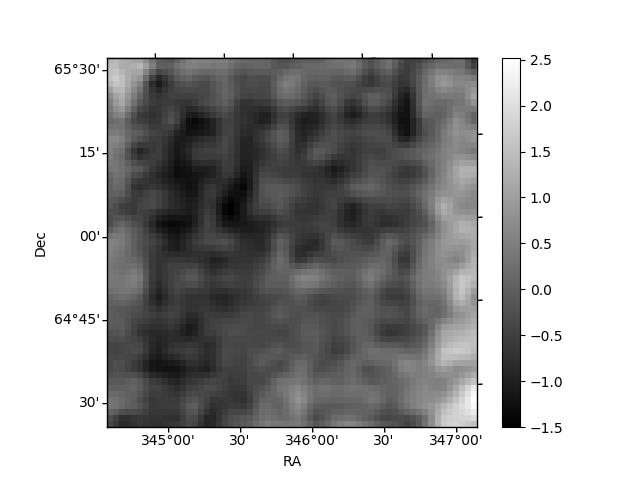
Histogram calculated using DETX and DETY for each event in the final _common_clean file
| Quadrant A | 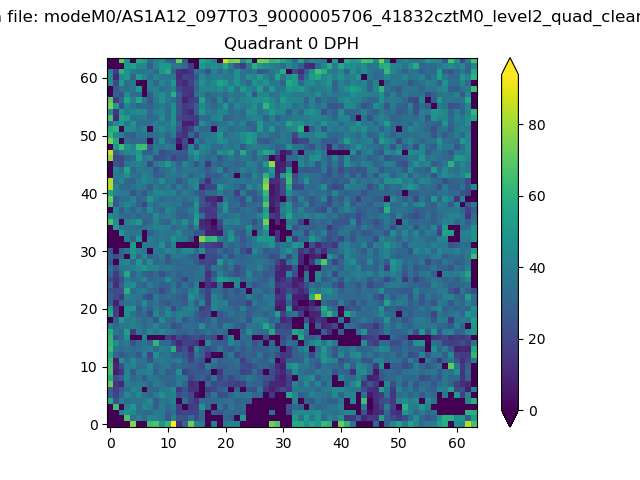 |
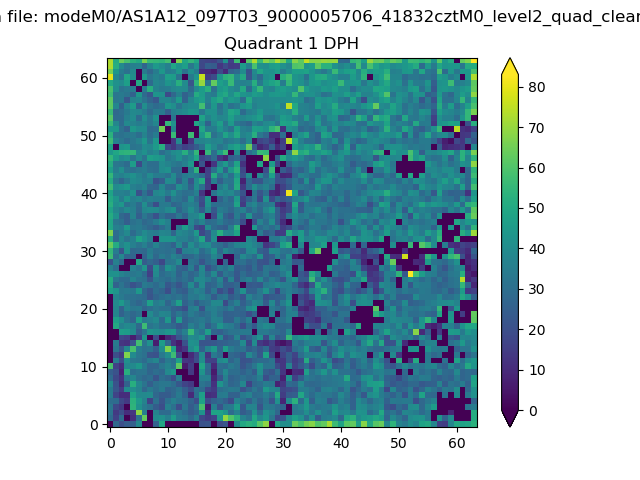 |
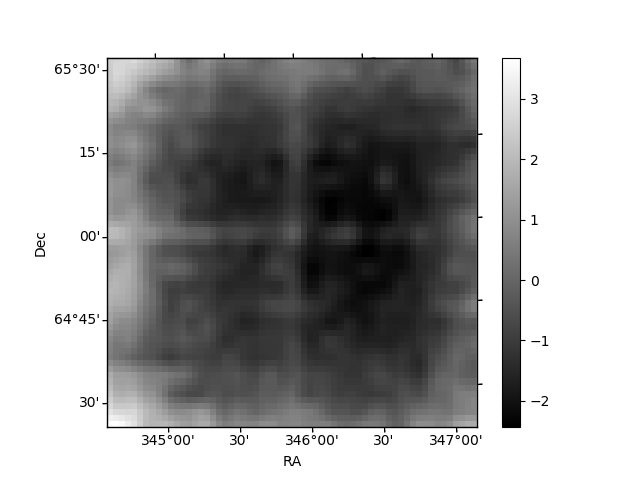
Quadrant B |
|---|---|---|---|
| Quadrant D | 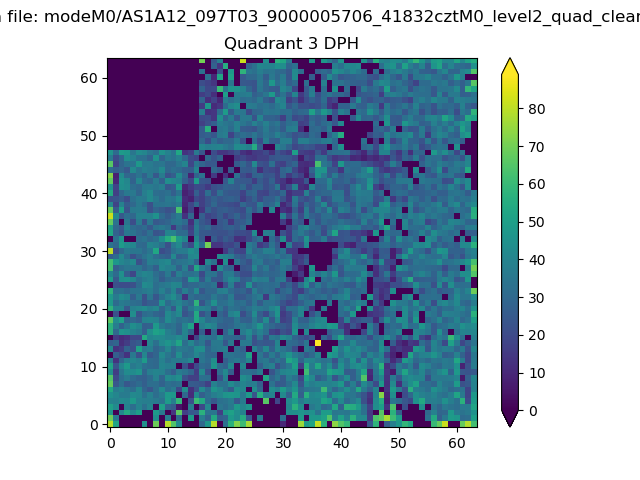 |
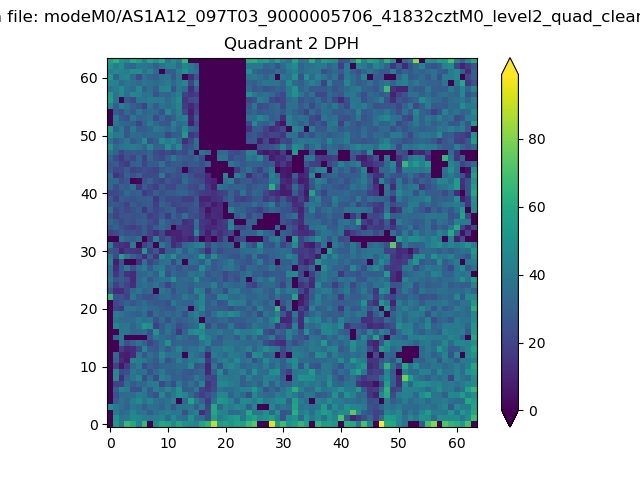 |
Quadrant C |
| Plot type | Count rate plots | Images |
|---|---|---|
| Comparison with Poisson distribution Blue bars denote a histogram of data divided into 1 sec bins. Red curve is a Poisson curve with rate = median count rate of data. |
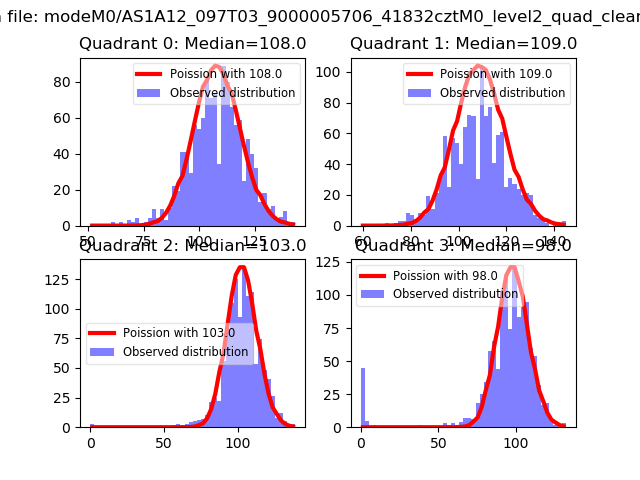 |
 |
| Quadrant-wise count rates Data is divided into 100 sec bins |
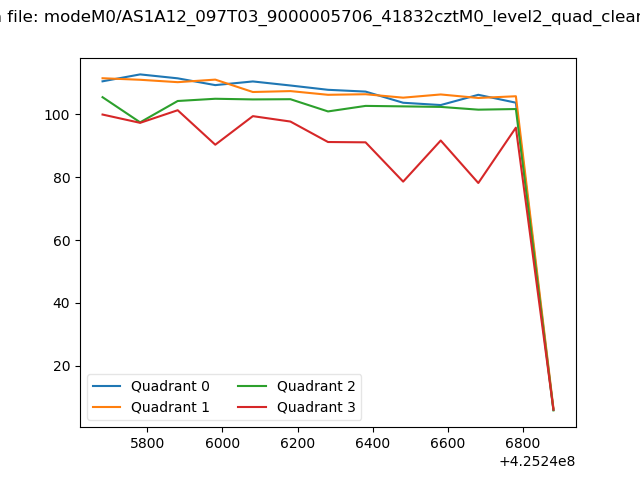 |
|
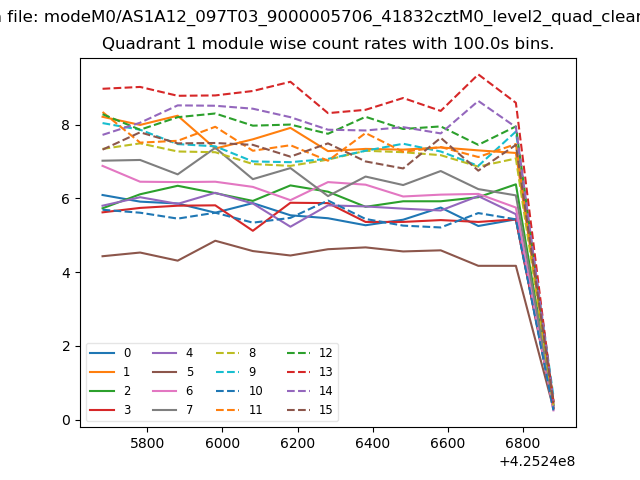
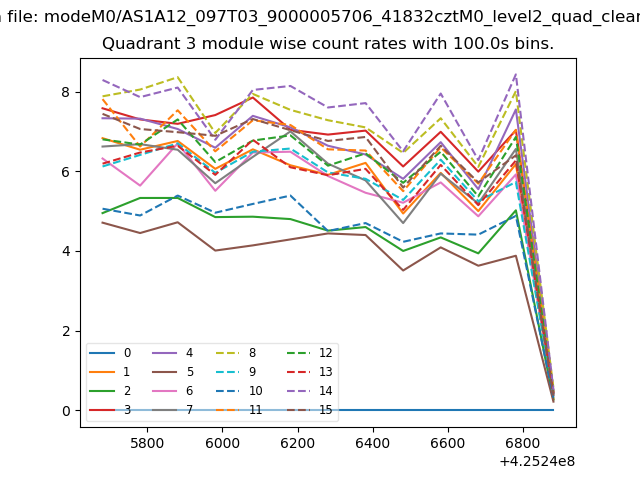
| Module-wise count rates for Quadrant A Data is divided into 100 sec bins |
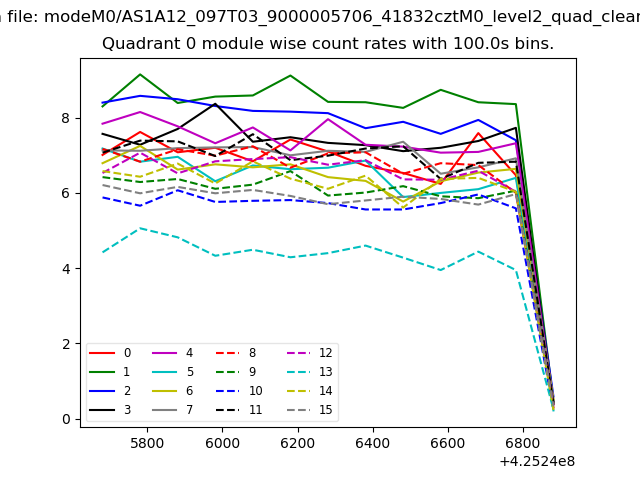 |
 |
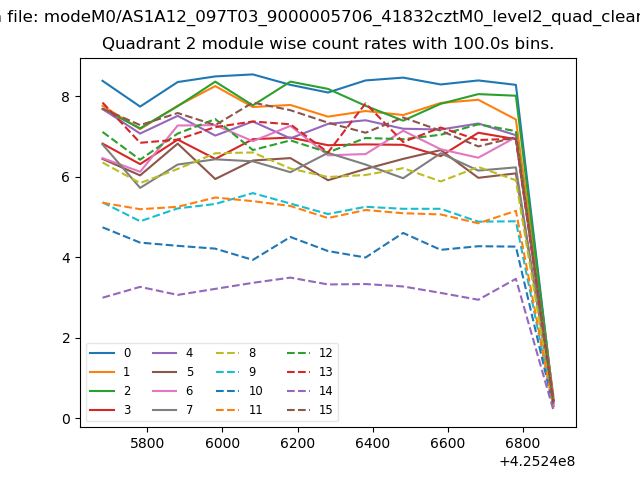
| Module-wise count rates for Quadrant B Data is divided into 100 sec bins |
 |
 |
| Module-wise count rates for Quadrant C Data is divided into 100 sec bins |
 |
 |
| Module-wise count rates for Quadrant D Data is divided into 100 sec bins |
 |
 |
| Parameter | Plot |
|---|---|
| CZT HV Monitor | 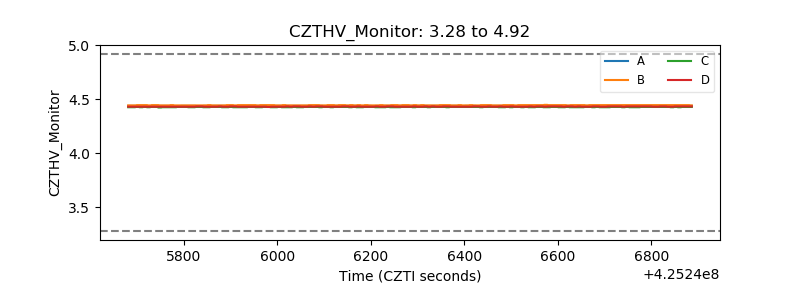 |
| D_VDD | 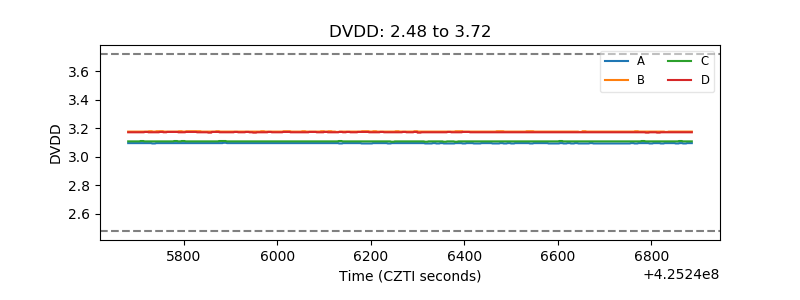 |
| Temperature 1 | 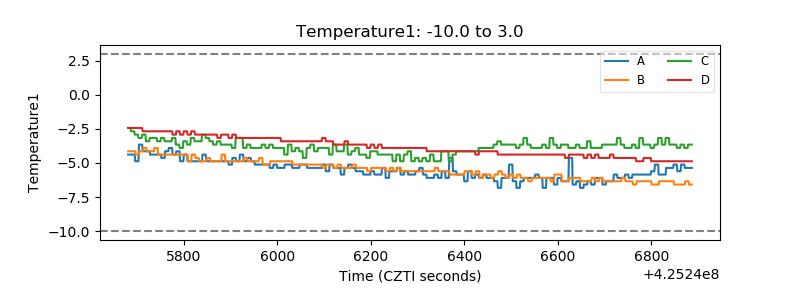 |
| Veto HV Monitor | 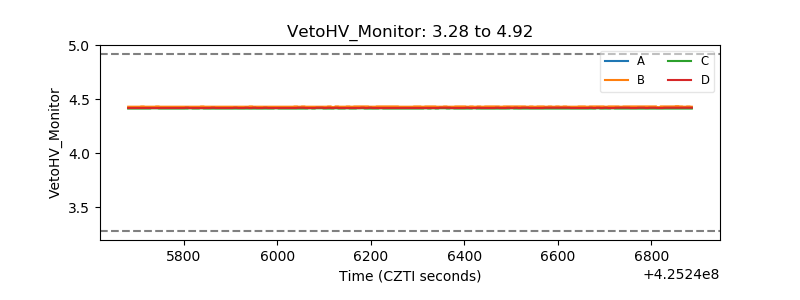 |
| Veto LLD | 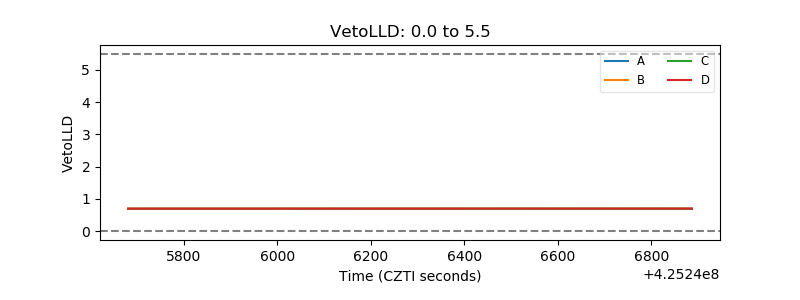 |
| Alpha Counter | 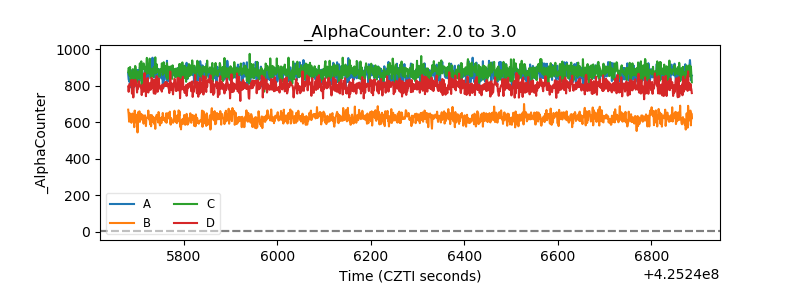 |
| _CPM_Rate | 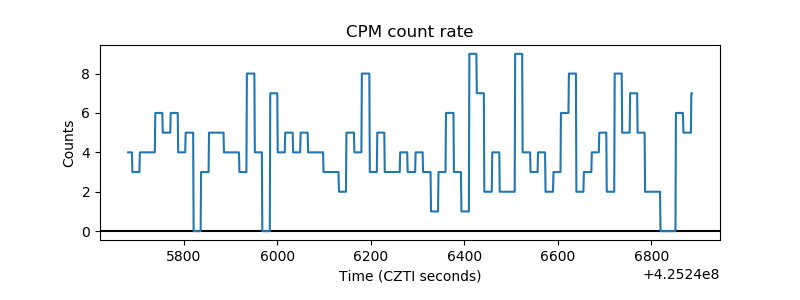 |
| CZT Counter | 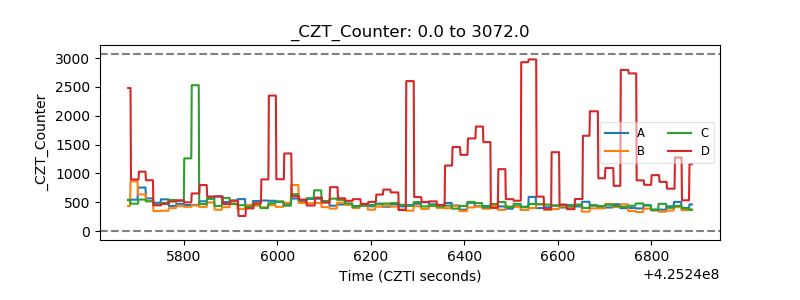 |
| +2.5 Volts monitor | 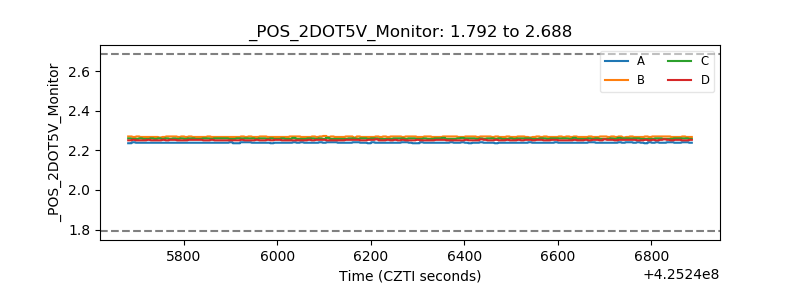 |
| +5 Volts monitor | 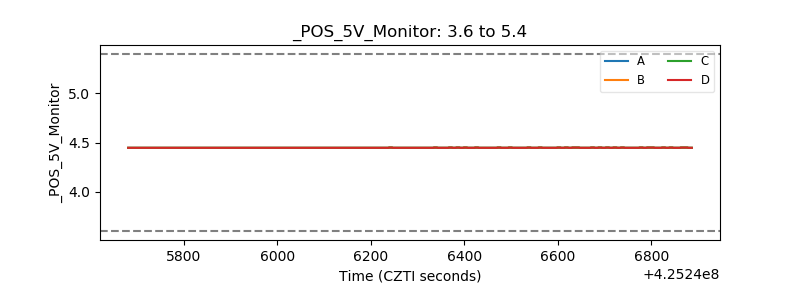 |
| _ROLL_ROT | 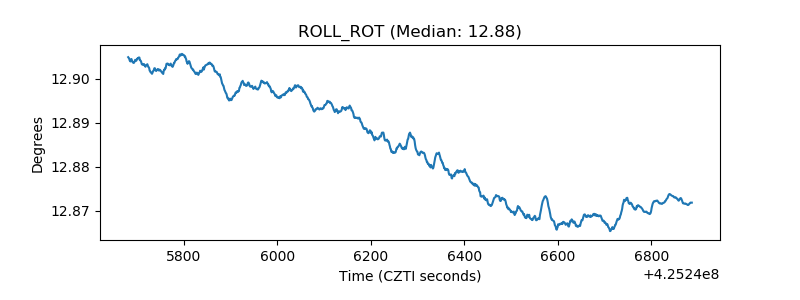 |
| _Roll_DEC | 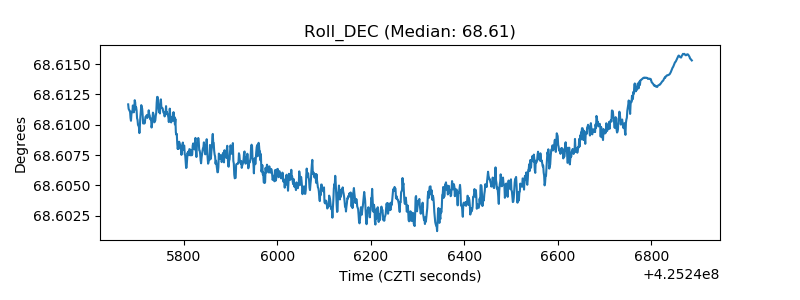 |
| _Roll_RA | 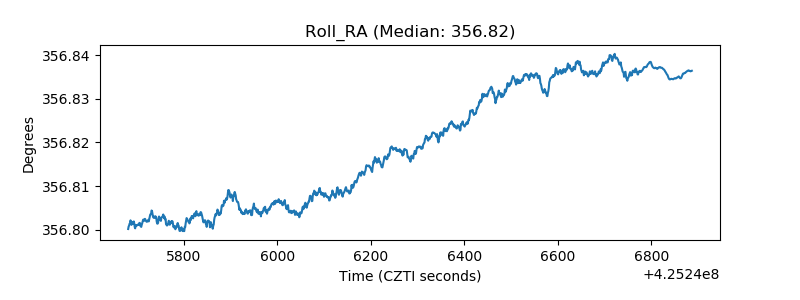 |
| Veto Counter | 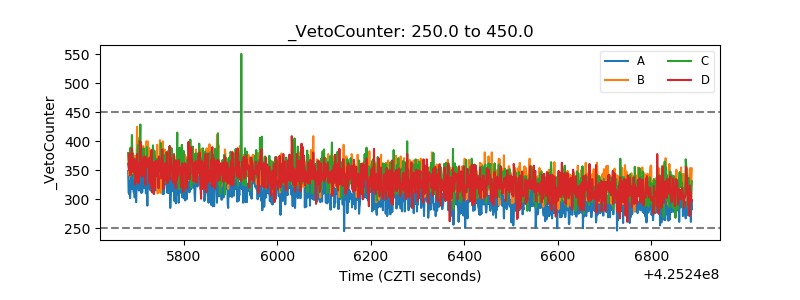 |