| Param | Original file | Final file |
|---|---|---|
| Filename | modeM0/AS1A12_099T04_9000005708_41830cztM0_level2.fits | modeM0/AS1A12_099T04_9000005708_41830cztM0_level2_quad_clean.evt |
| Size (bytes) | 400,579,200 | 97,663,680 |
| Size | 382.0 MB | 93.1 MB |
| Events in quadrant A | 3,160,297 | 661,105 |
| Events in quadrant B | 2,729,225 | 677,017 |
| Events in quadrant C | 3,317,670 | 628,360 |
| Events in quadrant D | 5,152,498 | 569,468 |
| Mode M0 | |||
|---|---|---|---|
| Quadrant | BADHDUFLAG | Total packets | Discarded packets |
| A | 0 | 12995 | 1 |
| B | 0 | 12244 | 1 |
| C | 0 | 13501 | 1 |
| D | 0 | 19476 | 1 |
| Mode SS | |||
|---|---|---|---|
| Quadrant | BADHDUFLAG | Total packets | Discarded packets |
| A | 0 | 124 | 0 |
| B | 0 | 124 | 0 |
| C | 0 | 124 | 0 |
| D | 0 | 124 | 0 |
| Mode M9 | |||
|---|---|---|---|
| Quadrant | BADHDUFLAG | Total packets | Discarded packets |
| A | 0 | 13 | 0 |
| B | 0 | 13 | 0 |
| C | 0 | 13 | 0 |
| D | 0 | 13 | 0 |
| Quadrant | Total seconds | Saturated seconds | Saturation percentage |
|---|---|---|---|
| A | 6024 | 26 | 0.431607% |
| B | 6024 | 12 | 0.199203% |
| C | 6024 | 121 | 2.008632% |
| D | 6024 | 346 | 5.743692% |
Noise dominated data is calculated using 1-second bins in cleaned event files. If a bin has >2000 counts, and if more than 50% of those come from <1% of pixels, then it is considered to be noise-dominated and hence unusable.
| Quadrant | # 1 sec bins | Bins with >0 counts | Bins with >2000 counts | High rate bins dominated by noise | Noise dominated (total time) | Noise dominated (detector-on time) | Marked lightcurve |
|---|---|---|---|---|---|---|---|
| A | 7366 | 6025 | 10 | 10 | 0.14% | 0.17% | 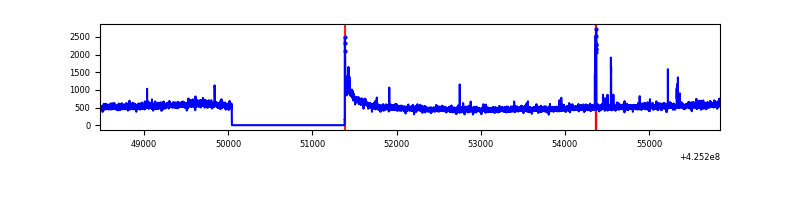 |
| B | 7366 | 6025 | 3 | 3 | 0.04% | 0.05% | 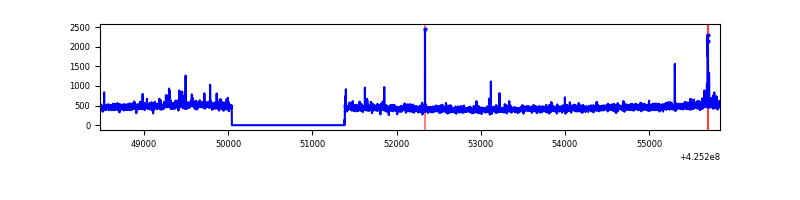 |
| C | 7366 | 6025 | 119 | 119 | 1.62% | 1.98% | 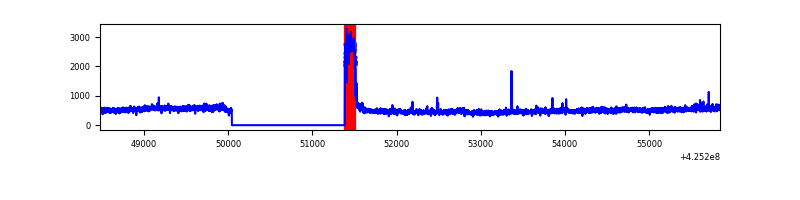 |
| D | 7366 | 6025 | 328 | 328 | 4.45% | 5.44% | 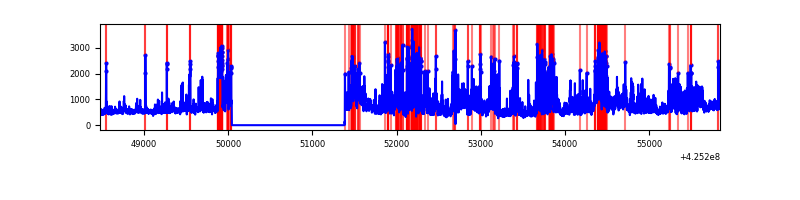 |
Top three noisy pixels from each quadrant. If the there are fewer than three noisy pixels in the level2.evt file, extra rows are filled as -1
| Pixel properties | Quadrant properties | ||||||
|---|---|---|---|---|---|---|---|
| Quadrant | DetID | PixID | Counts | Sigma | Mean | Median | Sigma |
| A | 10 | 83 | 490683 | 3530.71 | 673 | 658 | 138.8 |
| A | 2 | 79 | 45678 | 324.38 | 673 | 658 | 138.8 |
| A | 14 | 235 | 11927 | 81.2 | 673 | 658 | 138.8 |
| B | 0 | 245 | 33794 | 252.6 | 666 | 647 | 131.2 |
| B | 15 | 35 | 33030 | 246.78 | 666 | 647 | 131.2 |
| B | 0 | 183 | 26453 | 196.66 | 666 | 647 | 131.2 |
| C | 0 | 10 | 545528 | 3590.34 | 648 | 650 | 151.8 |
| C | 15 | 214 | 234154 | 1538.62 | 648 | 650 | 151.8 |
| C | 0 | 207 | 10614 | 65.66 | 648 | 650 | 151.8 |
| D | 5 | 222 | 1609310 | 10301.49 | 641 | 621 | 156.2 |
| D | 13 | 249 | 440413 | 2816.28 | 641 | 621 | 156.2 |
| D | 12 | 6 | 364822 | 2332.22 | 641 | 621 | 156.2 |
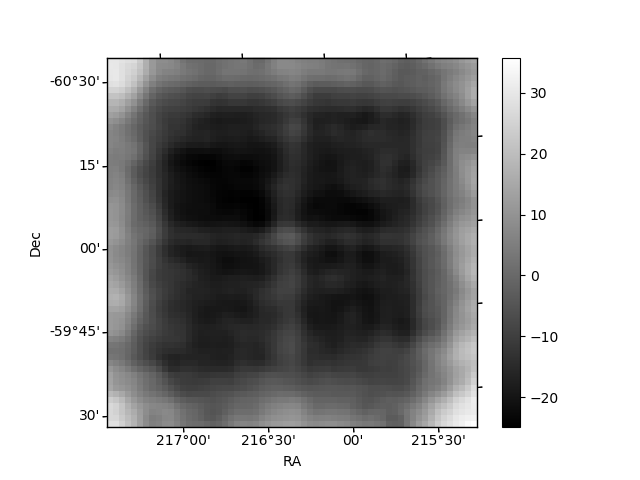
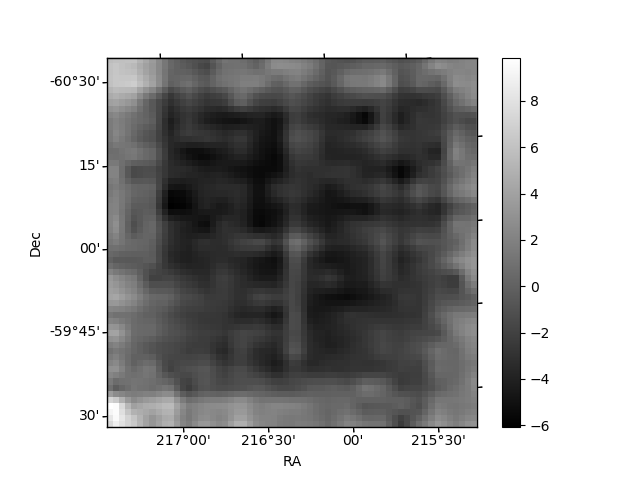
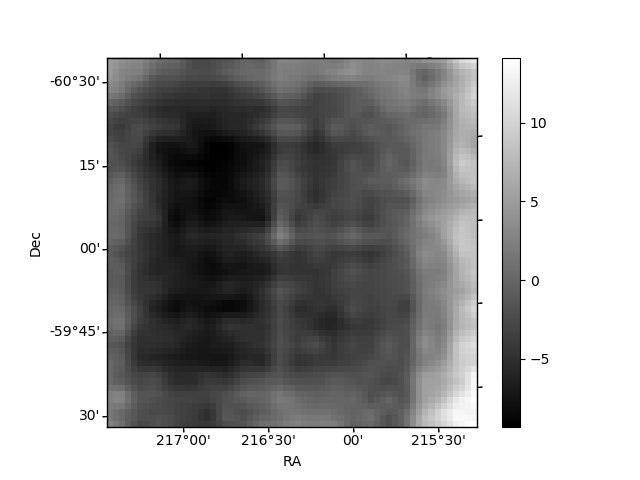
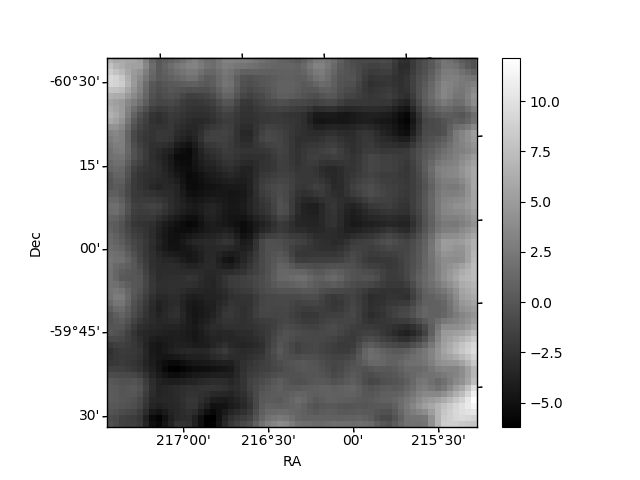
Histogram calculated using DETX and DETY for each event in the final _common_clean file
| Quadrant A | 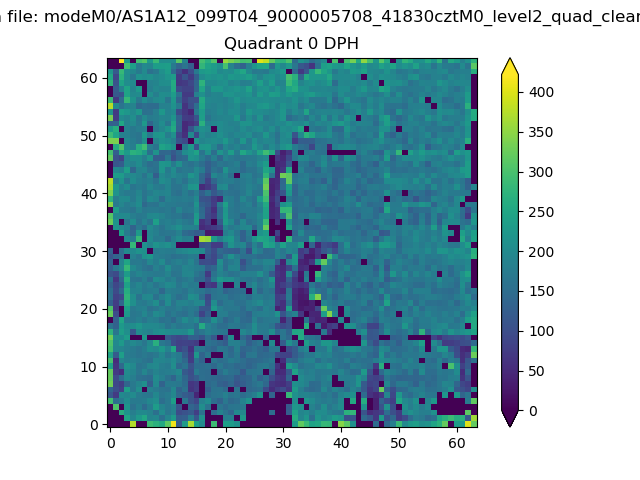 |
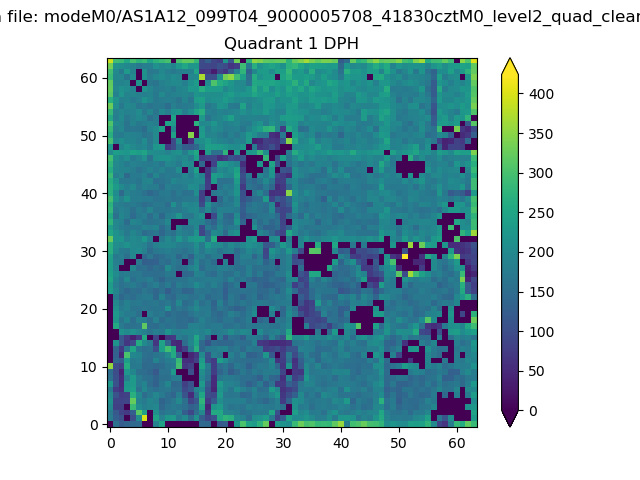 |
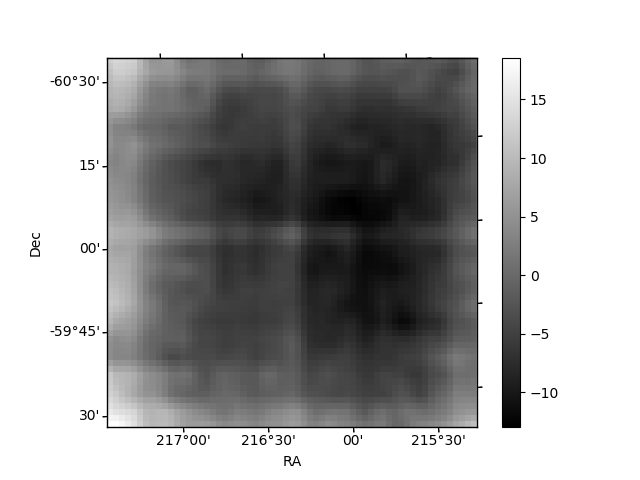
Quadrant B |
|---|---|---|---|
| Quadrant D | 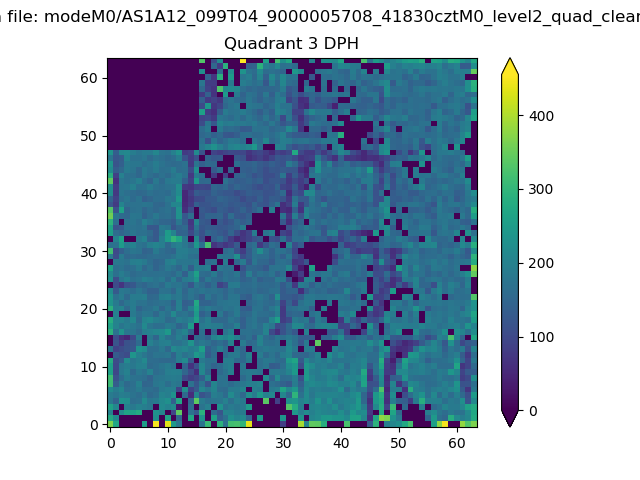 |
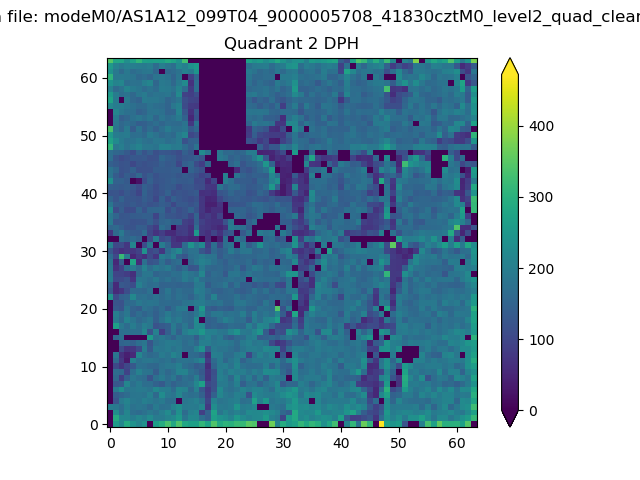 |
Quadrant C |
| Plot type | Count rate plots | Images |
|---|---|---|
| Comparison with Poisson distribution Blue bars denote a histogram of data divided into 1 sec bins. Red curve is a Poisson curve with rate = median count rate of data. |
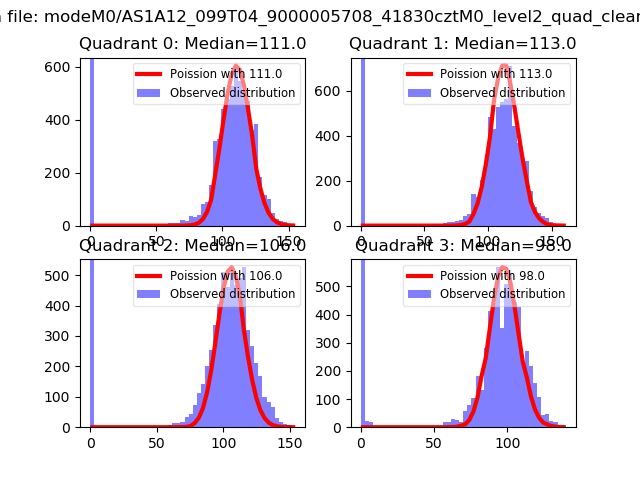 |
 |
| Quadrant-wise count rates Data is divided into 100 sec bins |
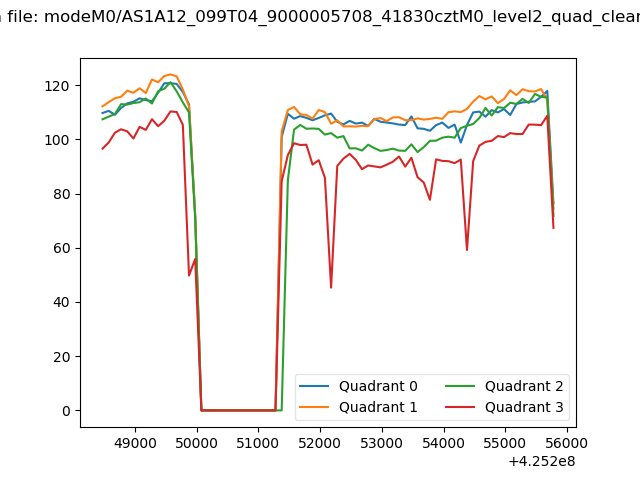 |
|
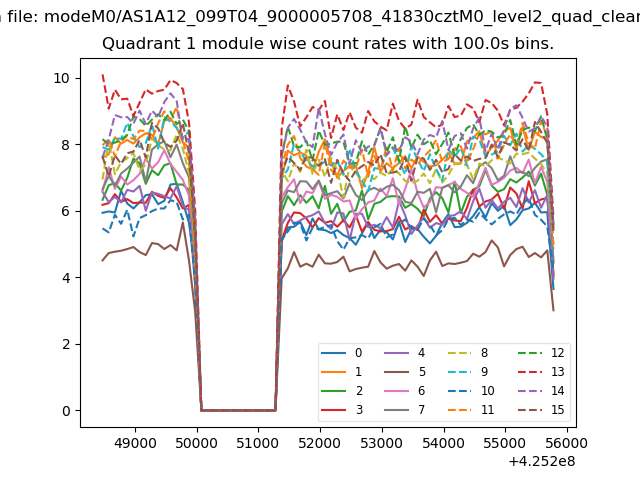
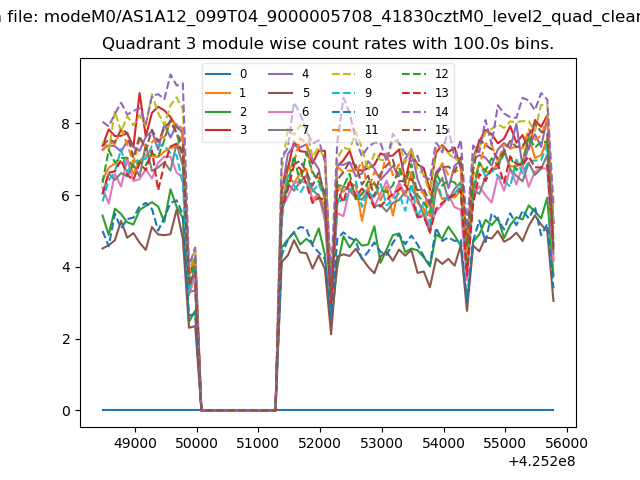
| Module-wise count rates for Quadrant A Data is divided into 100 sec bins |
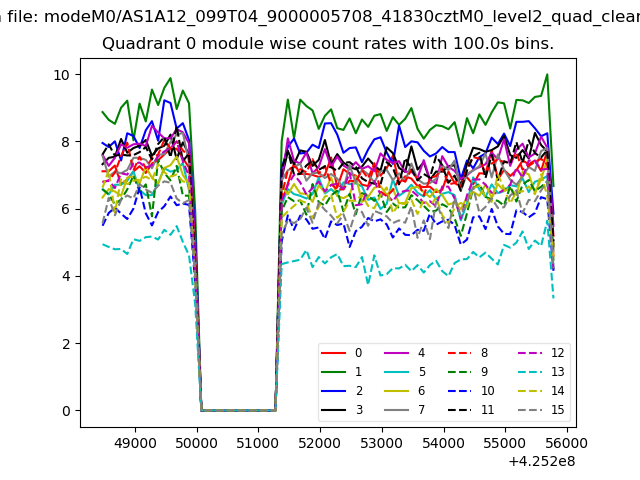 |
 |
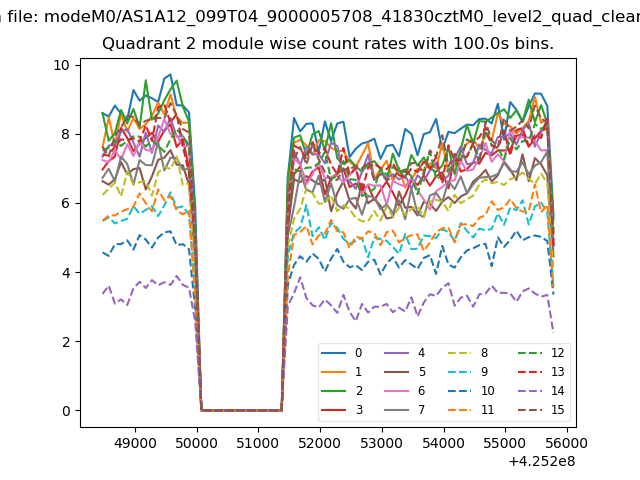
| Module-wise count rates for Quadrant B Data is divided into 100 sec bins |
 |
 |
| Module-wise count rates for Quadrant C Data is divided into 100 sec bins |
 |
 |
| Module-wise count rates for Quadrant D Data is divided into 100 sec bins |
 |
 |
| Parameter | Plot |
|---|---|
| CZT HV Monitor | 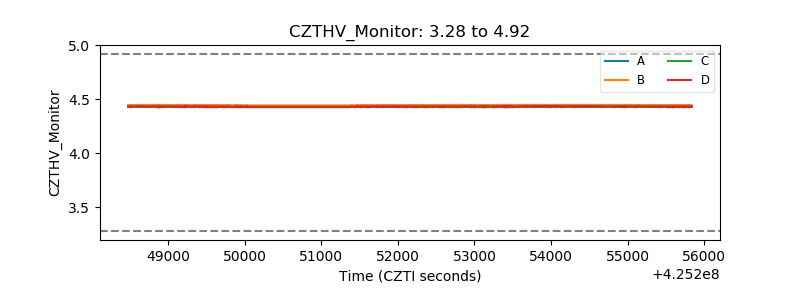 |
| D_VDD | 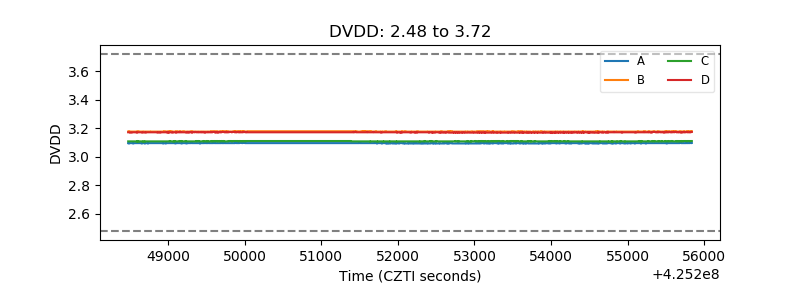 |
| Temperature 1 | 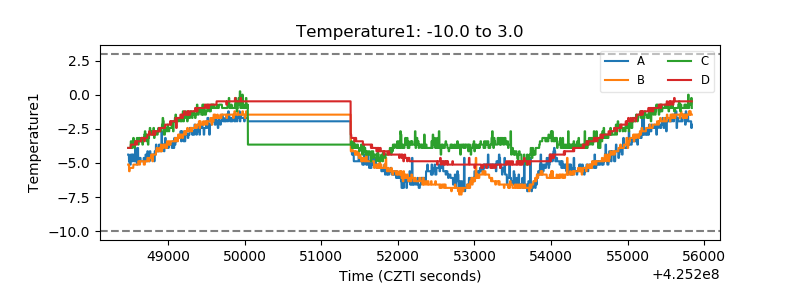 |
| Veto HV Monitor |  |
| Veto LLD | 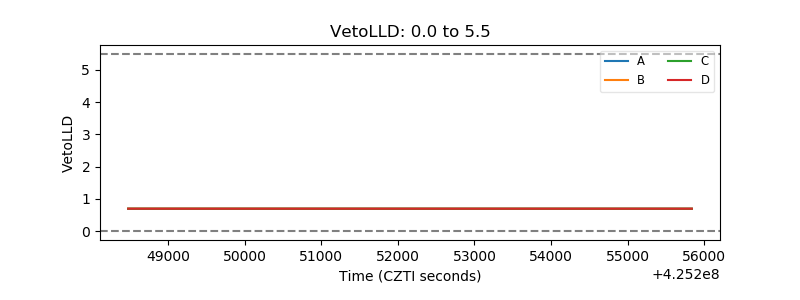 |
| Alpha Counter | 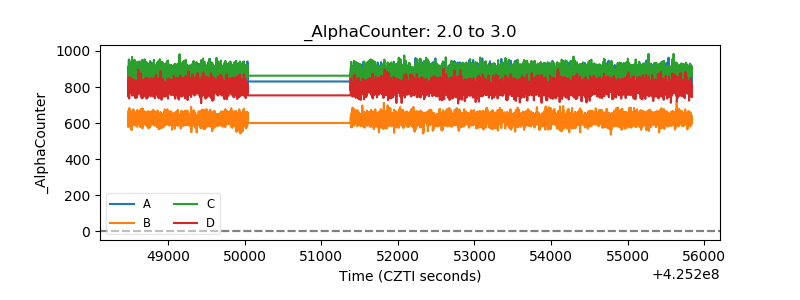 |
| _CPM_Rate | 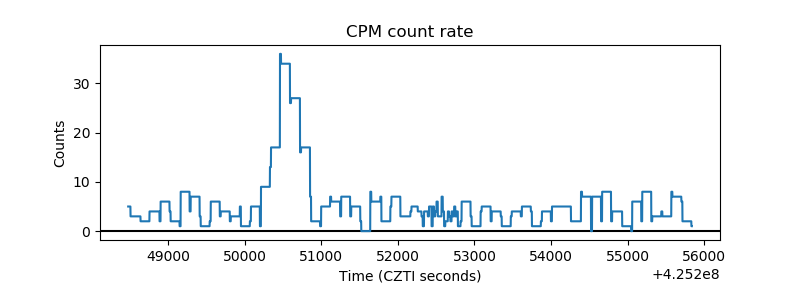 |
| CZT Counter | 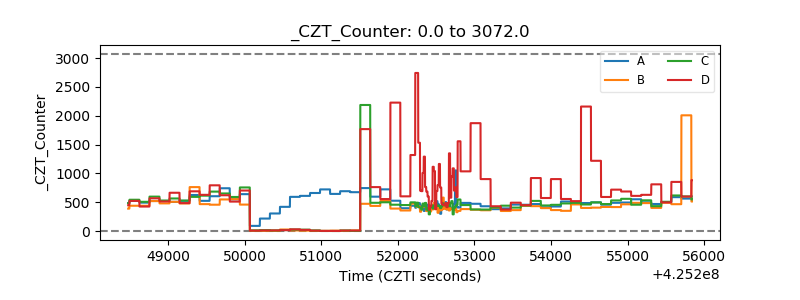 |
| +2.5 Volts monitor | 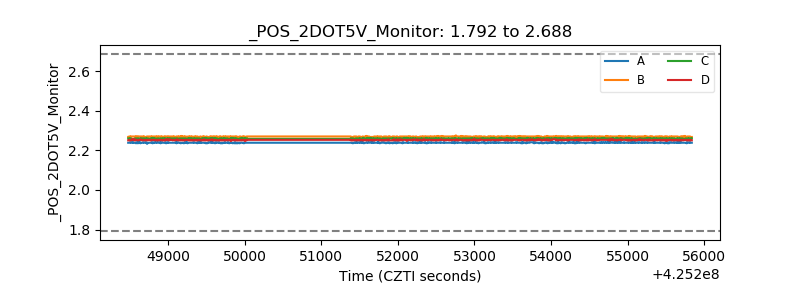 |
| +5 Volts monitor | 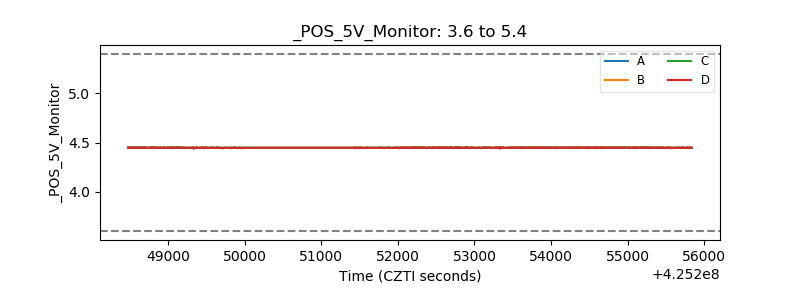 |
| _ROLL_ROT | 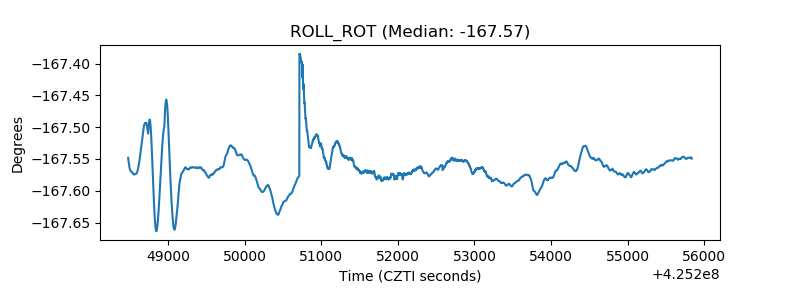 |
| _Roll_DEC | 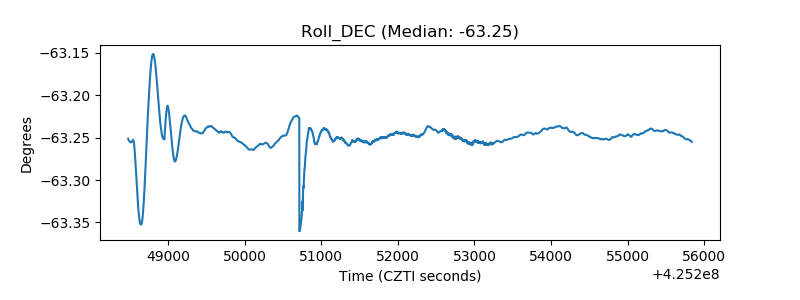 |
| _Roll_RA | 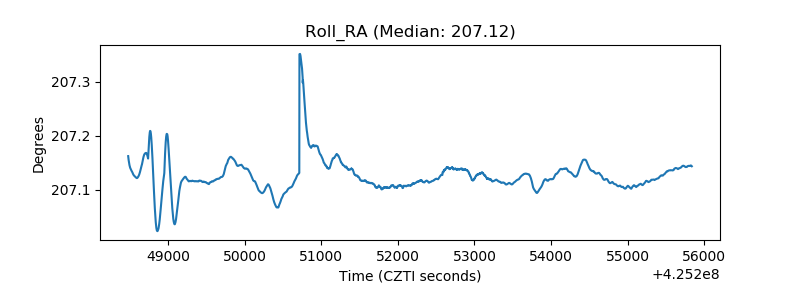 |
| Veto Counter | 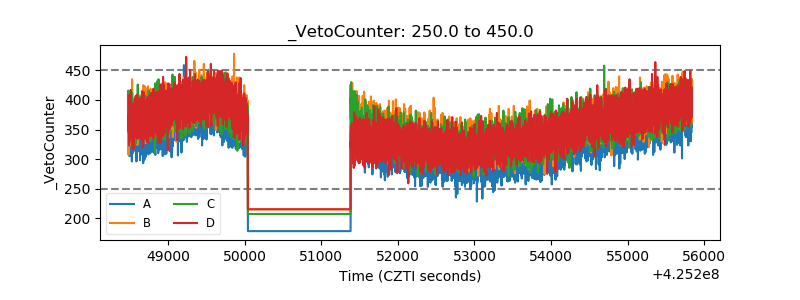 |