| Param | Original file | Final file |
|---|---|---|
| Filename | modeM0/AS1A12_099T04_9000005708_41832cztM0_level2.fits | modeM0/AS1A12_099T04_9000005708_41832cztM0_level2_quad_clean.evt |
| Size (bytes) | 1,236,651,840 | 258,724,800 |
| Size | 1.2 GB | 246.7 MB |
| Events in quadrant A | 14,152,396 | 1,552,570 |
| Events in quadrant B | 7,802,485 | 1,854,485 |
| Events in quadrant C | 9,440,183 | 1,712,845 |
| Events in quadrant D | 13,078,360 | 1,551,579 |
| Mode M0 | |||
|---|---|---|---|
| Quadrant | BADHDUFLAG | Total packets | Discarded packets |
| A | 0 | 52697 | 5 |
| B | 0 | 34965 | 4 |
| C | 0 | 38626 | 4 |
| D | 0 | 50698 | 4 |
| Mode SS | |||
|---|---|---|---|
| Quadrant | BADHDUFLAG | Total packets | Discarded packets |
| A | 0 | 348 | 0 |
| B | 0 | 348 | 0 |
| C | 0 | 348 | 0 |
| D | 0 | 348 | 0 |
| Mode M9 | |||
|---|---|---|---|
| Quadrant | BADHDUFLAG | Total packets | Discarded packets |
| A | 0 | 59 | 0 |
| B | 0 | 59 | 0 |
| C | 0 | 59 | 0 |
| D | 0 | 59 | 0 |
| Quadrant | Total seconds | Saturated seconds | Saturation percentage |
|---|---|---|---|
| A | 16837 | 2567 | 15.246184% |
| B | 16837 | 105 | 0.623627% |
| C | 16837 | 511 | 3.034982% |
| D | 16837 | 954 | 5.666093% |
Noise dominated data is calculated using 1-second bins in cleaned event files. If a bin has >2000 counts, and if more than 50% of those come from <1% of pixels, then it is considered to be noise-dominated and hence unusable.
| Quadrant | # 1 sec bins | Bins with >0 counts | Bins with >2000 counts | High rate bins dominated by noise | Noise dominated (total time) | Noise dominated (detector-on time) | Marked lightcurve |
|---|---|---|---|---|---|---|---|
| A | 22835 | 16841 | 1941 | 1941 | 8.50% | 11.53% | 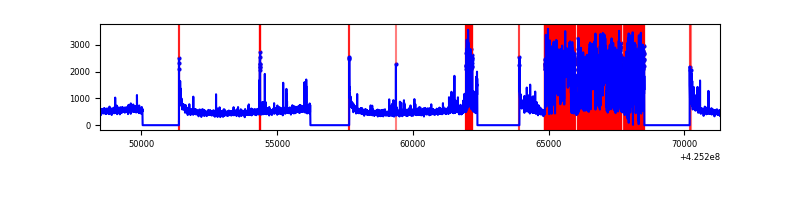 |
| B | 22835 | 16841 | 68 | 68 | 0.30% | 0.40% | 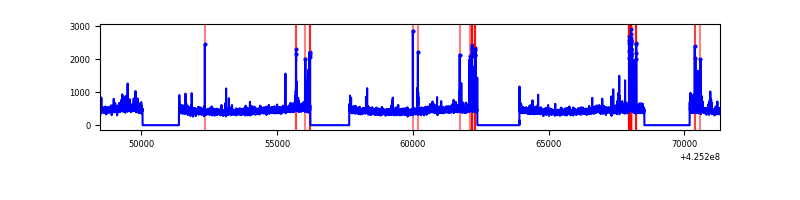 |
| C | 22835 | 16841 | 502 | 502 | 2.20% | 2.98% | 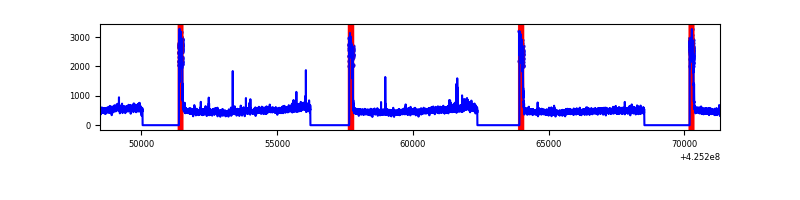 |
| D | 22835 | 16841 | 881 | 881 | 3.86% | 5.23% | 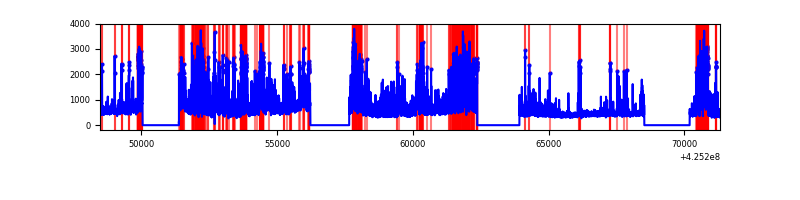 |
Top three noisy pixels from each quadrant. If the there are fewer than three noisy pixels in the level2.evt file, extra rows are filled as -1
| Pixel properties | Quadrant properties | ||||||
|---|---|---|---|---|---|---|---|
| Quadrant | DetID | PixID | Counts | Sigma | Mean | Median | Sigma |
| A | 14 | 24 | 6172629 | 18068.75 | 1678 | 1644 | 341.5 |
| A | 10 | 83 | 1365417 | 3993.15 | 1678 | 1644 | 341.5 |
| A | 2 | 79 | 99312 | 285.97 | 1678 | 1644 | 341.5 |
| B | 5 | 32 | 163121 | 459.24 | 1837 | 1784 | 351.3 |
| B | 0 | 186 | 96117 | 268.52 | 1837 | 1784 | 351.3 |
| B | 0 | 245 | 75138 | 208.8 | 1837 | 1784 | 351.3 |
| C | 0 | 10 | 1814249 | 4436.63 | 1772 | 1781 | 408.5 |
| C | 15 | 214 | 665200 | 1623.94 | 1772 | 1781 | 408.5 |
| C | 15 | 111 | 14784 | 31.83 | 1772 | 1781 | 408.5 |
| D | 5 | 222 | 3250441 | 7673.03 | 1760 | 1709 | 423.4 |
| D | 13 | 249 | 1534832 | 3621.01 | 1760 | 1709 | 423.4 |
| D | 12 | 6 | 612899 | 1443.54 | 1760 | 1709 | 423.4 |
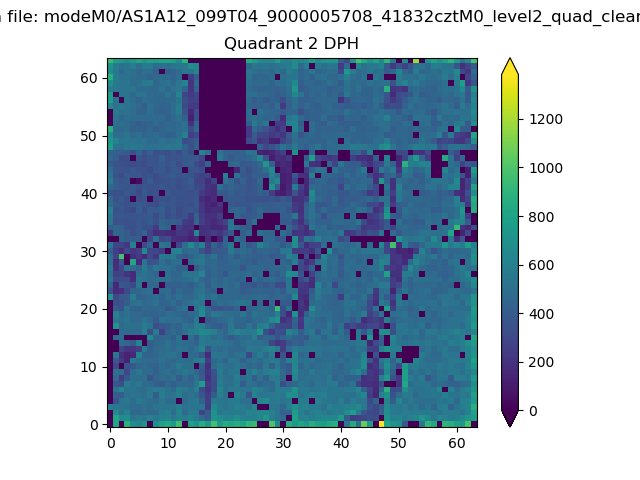
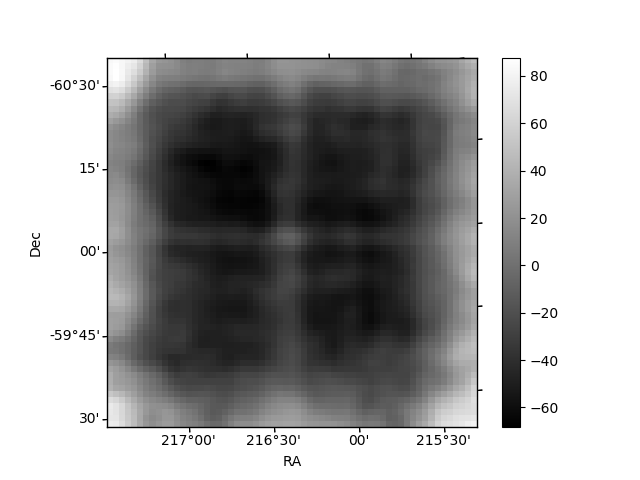
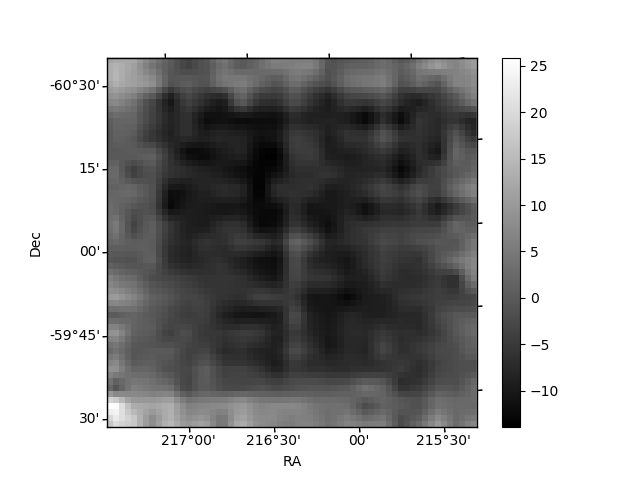
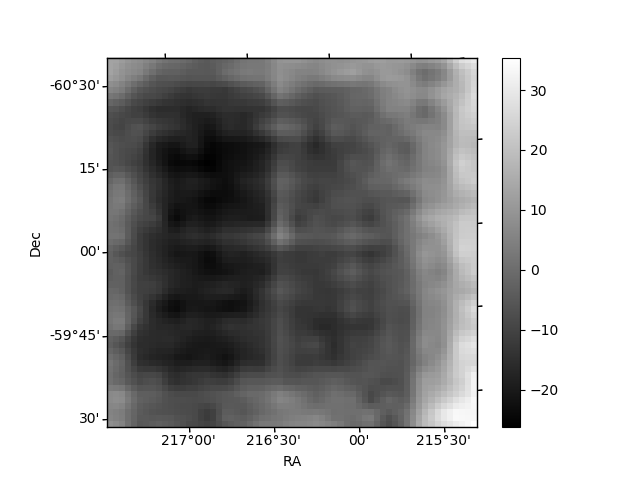
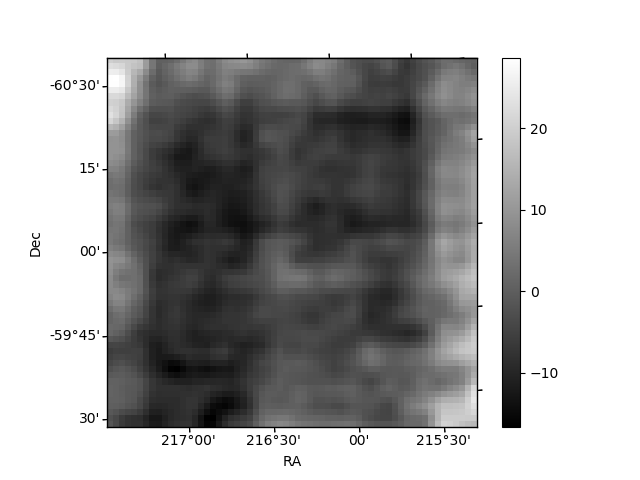
Histogram calculated using DETX and DETY for each event in the final _common_clean file
| Quadrant A | 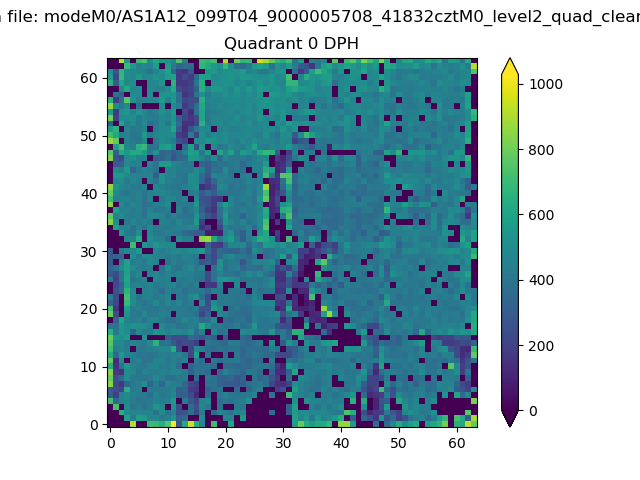 |
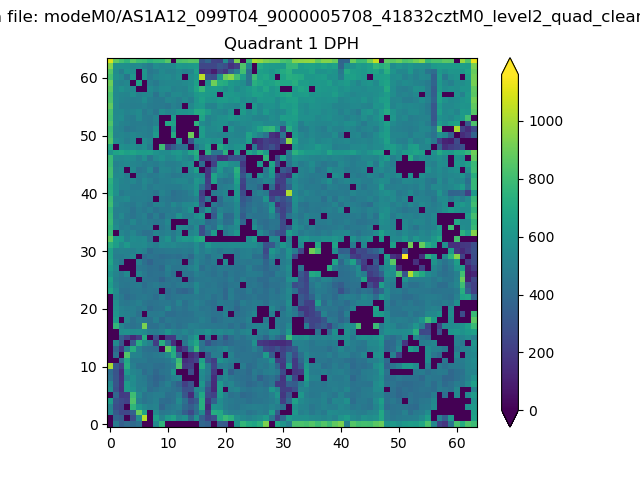 |
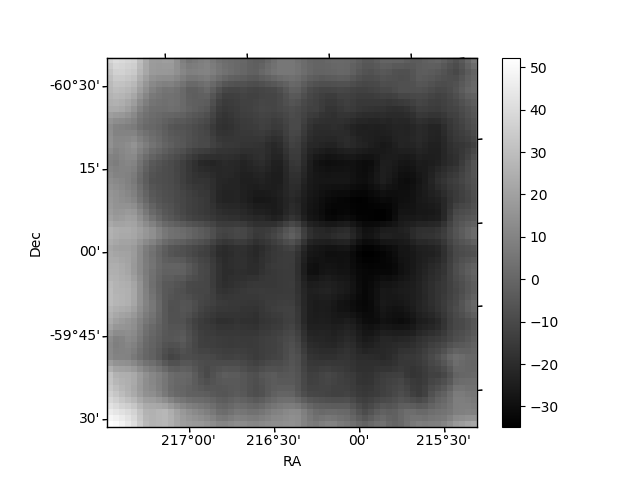
Quadrant B |
|---|---|---|---|
| Quadrant D | 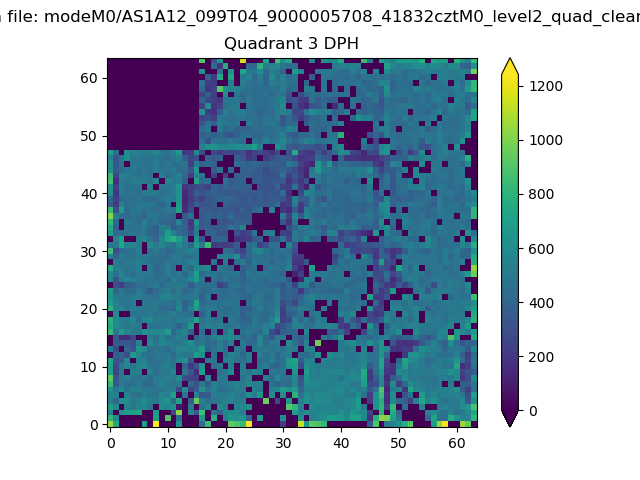 |
 |
Quadrant C |
| Plot type | Count rate plots | Images |
|---|---|---|
| Comparison with Poisson distribution Blue bars denote a histogram of data divided into 1 sec bins. Red curve is a Poisson curve with rate = median count rate of data. |
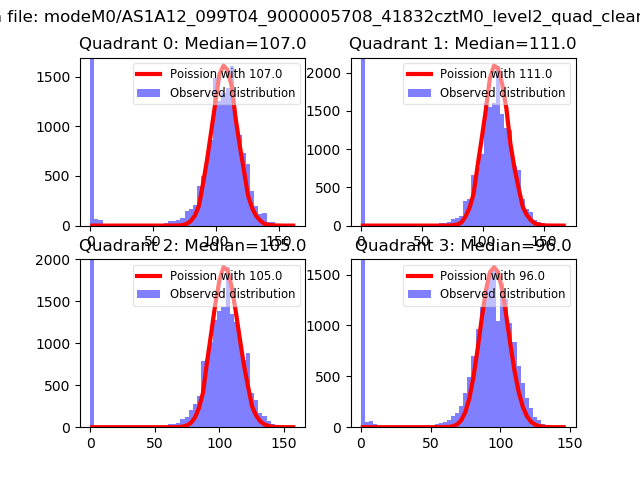 |
 |
| Quadrant-wise count rates Data is divided into 100 sec bins |
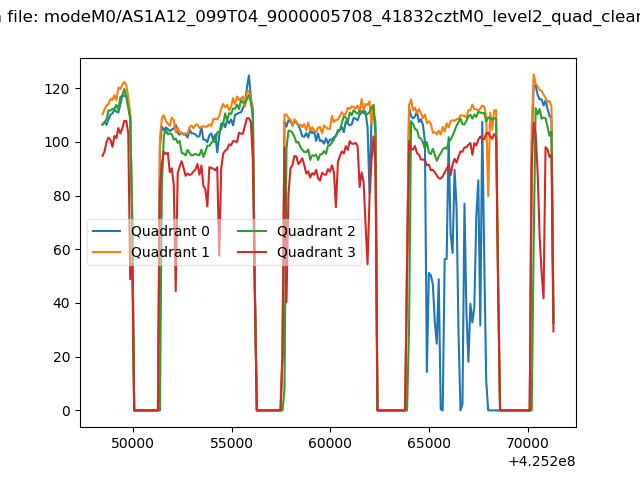 |
|
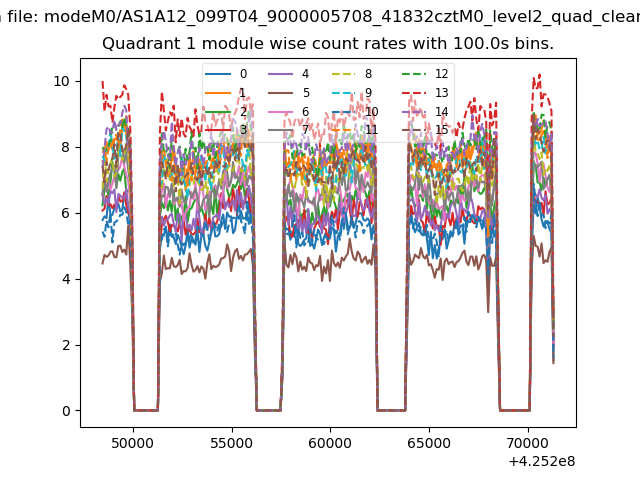
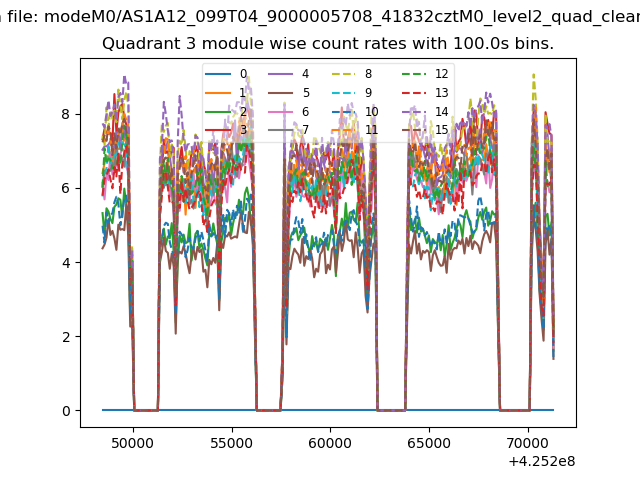
| Module-wise count rates for Quadrant A Data is divided into 100 sec bins |
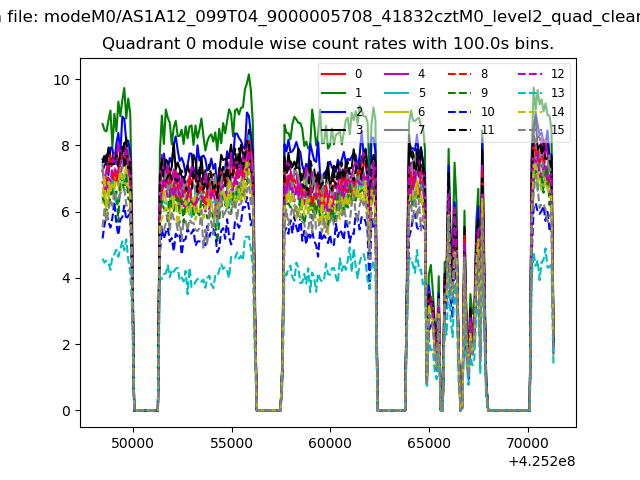 |
 |
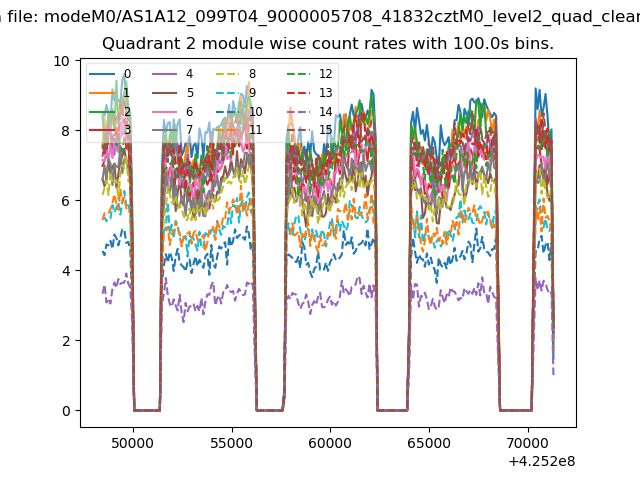
| Module-wise count rates for Quadrant B Data is divided into 100 sec bins |
 |
 |
| Module-wise count rates for Quadrant C Data is divided into 100 sec bins |
 |
 |
| Module-wise count rates for Quadrant D Data is divided into 100 sec bins |
 |
 |
| Parameter | Plot |
|---|---|
| CZT HV Monitor | 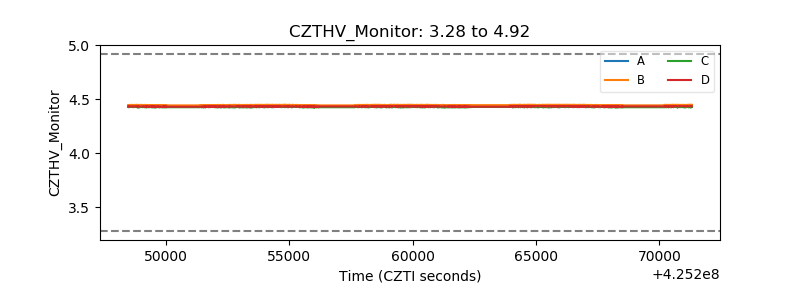 |
| D_VDD | 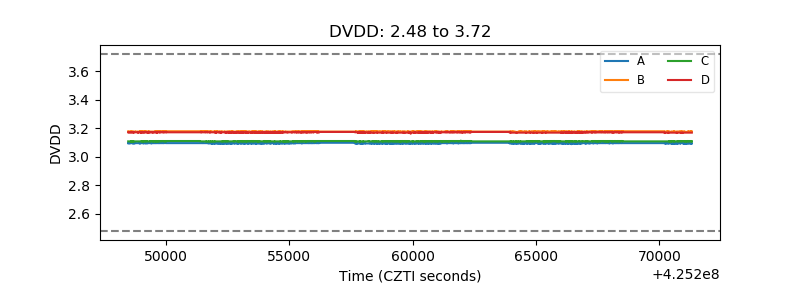 |
| Temperature 1 | 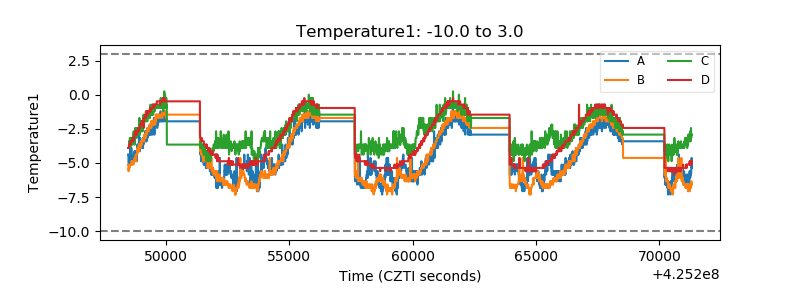 |
| Veto HV Monitor | 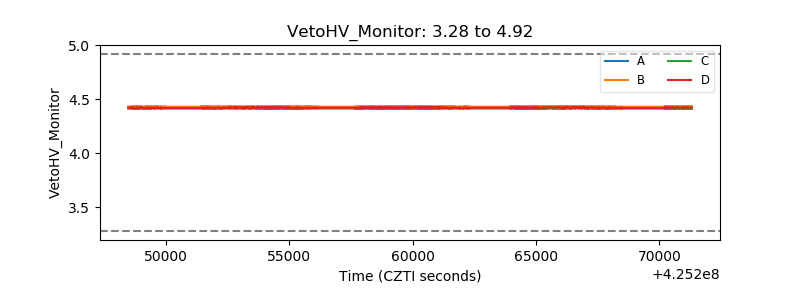 |
| Veto LLD | 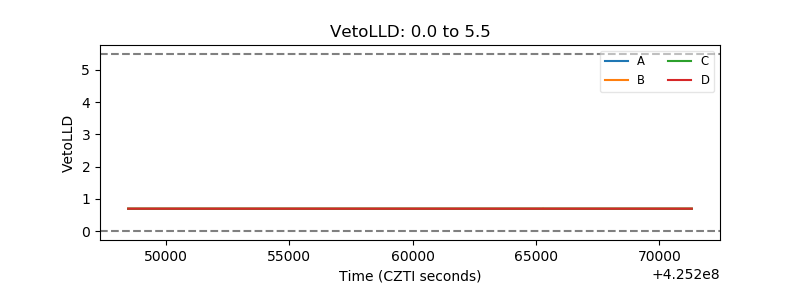 |
| Alpha Counter | 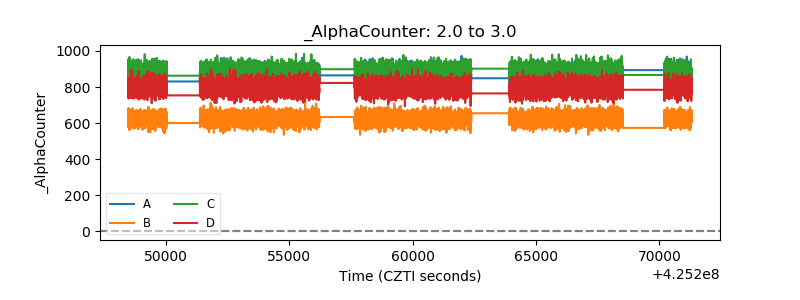 |
| _CPM_Rate | 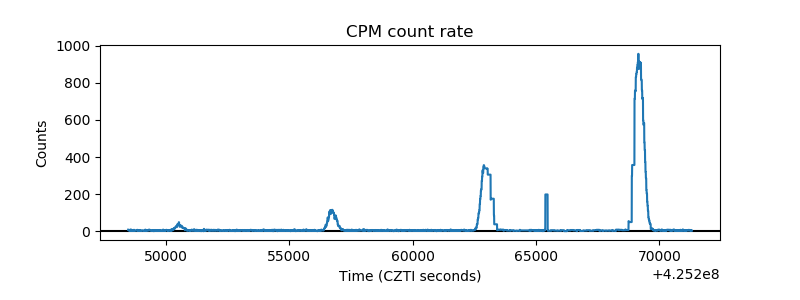 |
| CZT Counter | 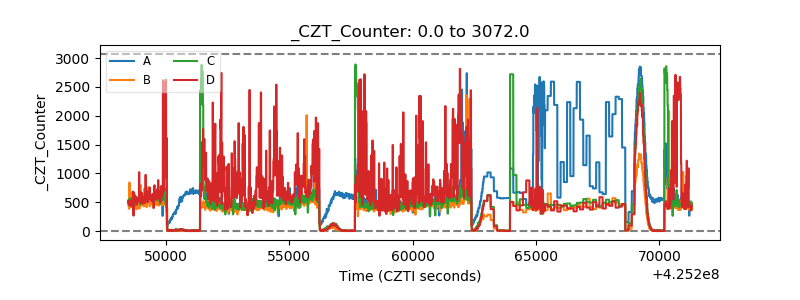 |
| +2.5 Volts monitor | 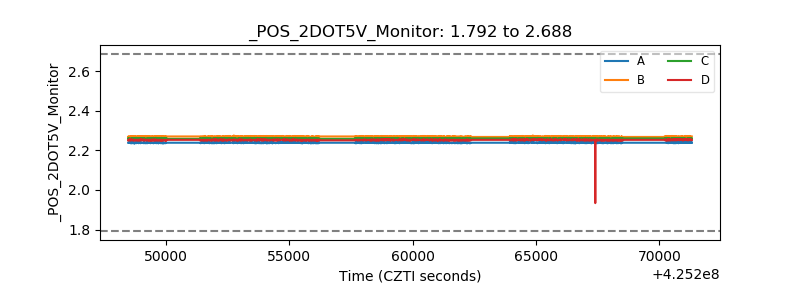 |
| +5 Volts monitor | 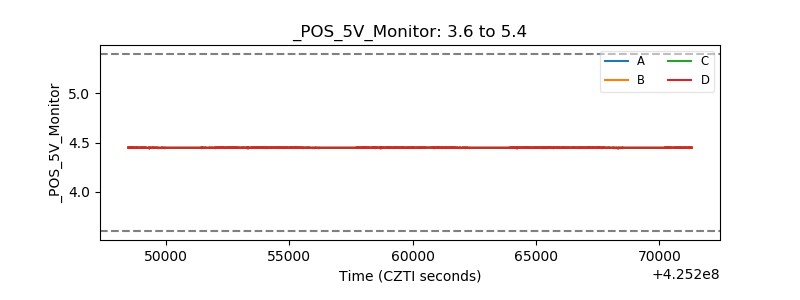 |
| _ROLL_ROT | 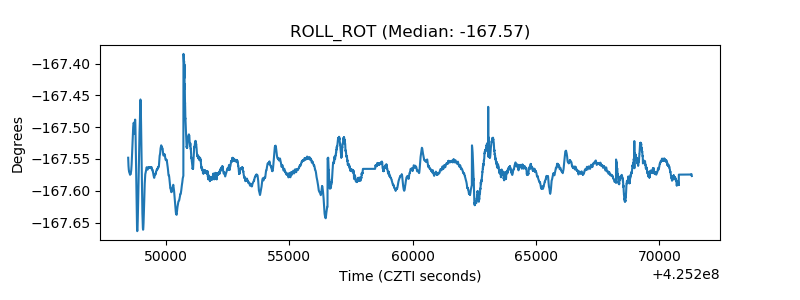 |
| _Roll_DEC | 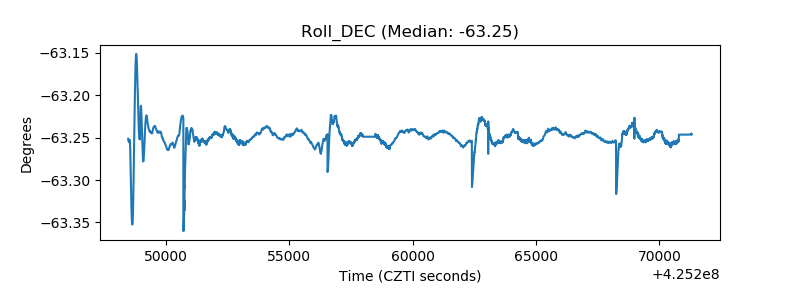 |
| _Roll_RA | 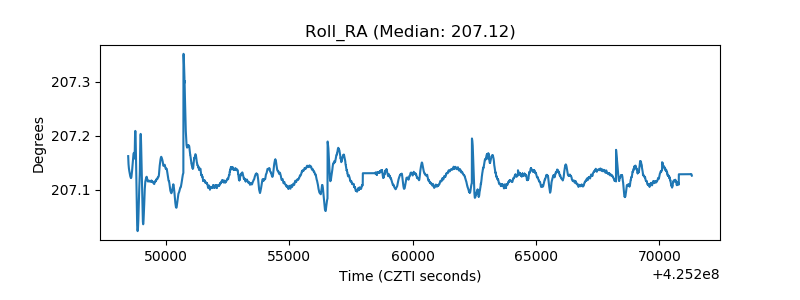 |
| Veto Counter |  |