| Param | Original file | Final file |
|---|---|---|
| Filename | modeM0/AS1A12_099T04_9000005708_41834cztM0_level2.fits | modeM0/AS1A12_099T04_9000005708_41834cztM0_level2_quad_clean.evt |
| Size (bytes) | 410,258,880 | 83,816,640 |
| Size | 391.3 MB | 79.9 MB |
| Events in quadrant A | 5,544,577 | 465,698 |
| Events in quadrant B | 2,373,803 | 624,872 |
| Events in quadrant C | 3,291,475 | 554,506 |
| Events in quadrant D | 3,565,454 | 523,321 |
| Mode M0 | |||
|---|---|---|---|
| Quadrant | BADHDUFLAG | Total packets | Discarded packets |
| A | 0 | 19888 | 2 |
| B | 0 | 10740 | 2 |
| C | 0 | 12889 | 2 |
| D | 0 | 14241 | 2 |
| Mode SS | |||
|---|---|---|---|
| Quadrant | BADHDUFLAG | Total packets | Discarded packets |
| A | 0 | 108 | 0 |
| B | 0 | 108 | 0 |
| C | 0 | 108 | 0 |
| D | 0 | 108 | 0 |
| Mode M9 | |||
|---|---|---|---|
| Quadrant | BADHDUFLAG | Total packets | Discarded packets |
| A | 0 | 29 | 0 |
| B | 0 | 30 | 0 |
| C | 0 | 30 | 0 |
| D | 0 | 30 | 0 |
| Quadrant | Total seconds | Saturated seconds | Saturation percentage |
|---|---|---|---|
| A | 5276 | 1273 | 24.128127% |
| B | 5276 | 8 | 0.151630% |
| C | 5276 | 267 | 5.060652% |
| D | 5276 | 284 | 5.382866% |
Noise dominated data is calculated using 1-second bins in cleaned event files. If a bin has >2000 counts, and if more than 50% of those come from <1% of pixels, then it is considered to be noise-dominated and hence unusable.
| Quadrant | # 1 sec bins | Bins with >0 counts | Bins with >2000 counts | High rate bins dominated by noise | Noise dominated (total time) | Noise dominated (detector-on time) | Marked lightcurve |
|---|---|---|---|---|---|---|---|
| A | 7099 | 5277 | 965 | 965 | 13.59% | 18.29% | 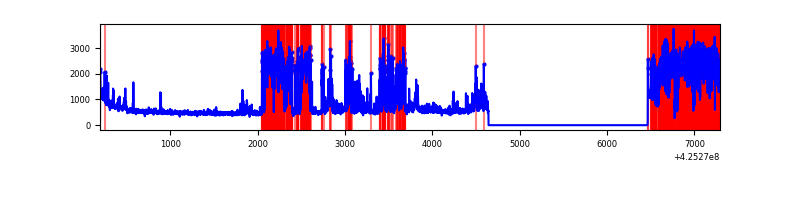 |
| B | 7099 | 5277 | 3 | 3 | 0.04% | 0.06% | 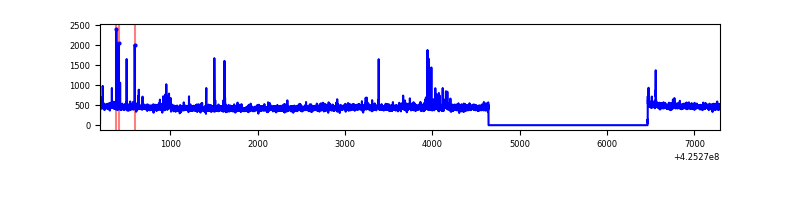 |
| C | 7099 | 5277 | 258 | 258 | 3.63% | 4.89% | 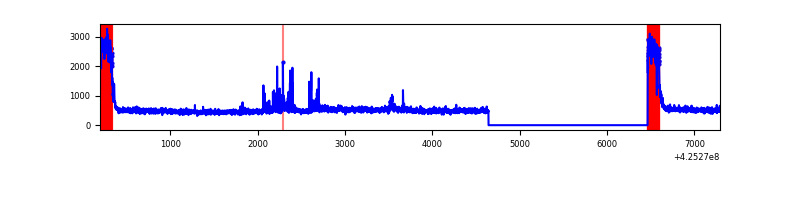 |
| D | 7099 | 5277 | 272 | 272 | 3.83% | 5.15% | 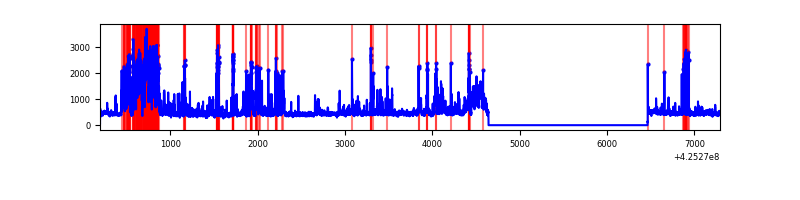 |
Top three noisy pixels from each quadrant. If the there are fewer than three noisy pixels in the level2.evt file, extra rows are filled as -1
| Pixel properties | Quadrant properties | ||||||
|---|---|---|---|---|---|---|---|
| Quadrant | DetID | PixID | Counts | Sigma | Mean | Median | Sigma |
| A | 14 | 24 | 3084211 | 29955.65 | 500 | 490 | 102.9 |
| A | 10 | 83 | 462238 | 4485.48 | 500 | 490 | 102.9 |
| A | 15 | 223 | 26492 | 252.59 | 500 | 490 | 102.9 |
| B | 5 | 255 | 41659 | 365.98 | 582 | 566 | 112.3 |
| B | 15 | 35 | 32110 | 280.94 | 582 | 566 | 112.3 |
| B | 12 | 111 | 13730 | 117.24 | 582 | 566 | 112.3 |
| C | 0 | 10 | 834810 | 6466.59 | 553 | 557 | 129.0 |
| C | 15 | 214 | 210305 | 1625.83 | 553 | 557 | 129.0 |
| C | 14 | 254 | 87326 | 672.58 | 553 | 557 | 129.0 |
| D | 2 | 249 | 517123 | 3805.99 | 561 | 545 | 135.7 |
| D | 13 | 249 | 474590 | 3492.62 | 561 | 545 | 135.7 |
| D | 12 | 6 | 225184 | 1655.07 | 561 | 545 | 135.7 |
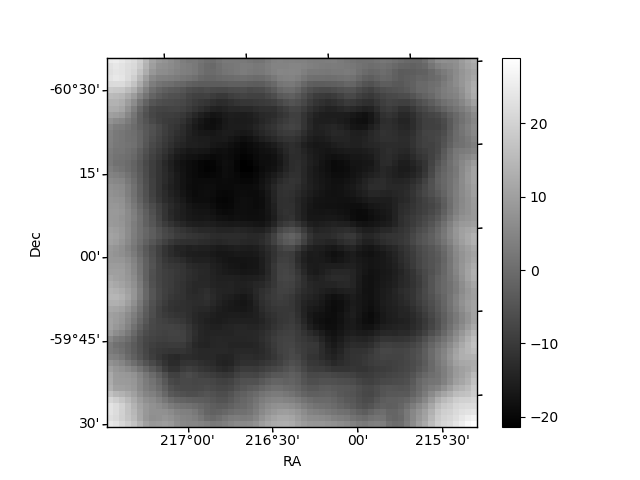
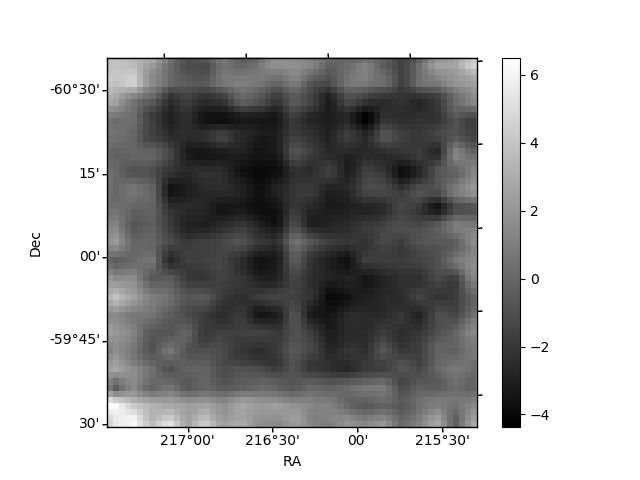
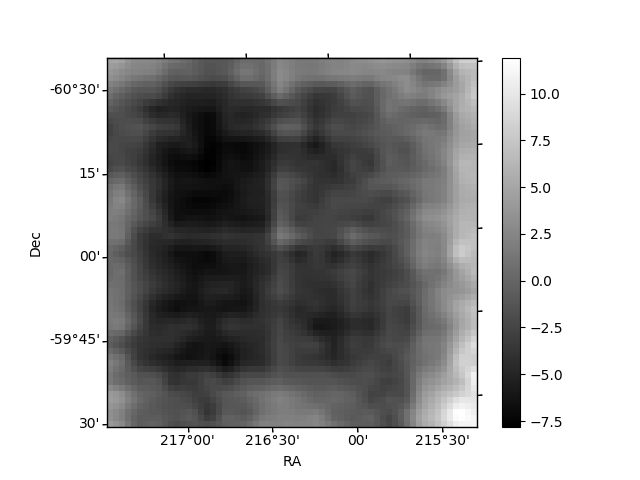
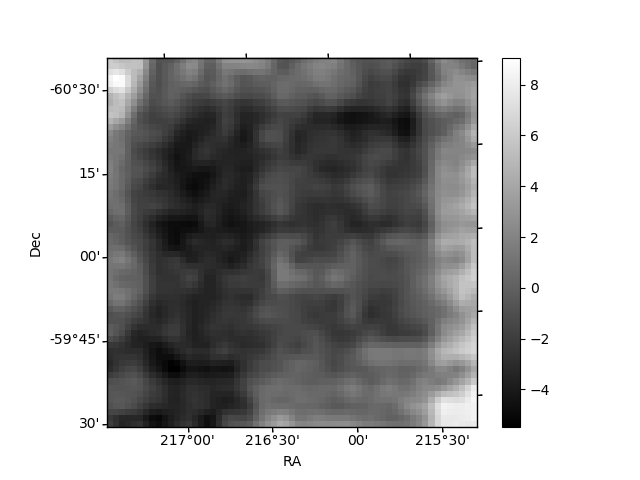
Histogram calculated using DETX and DETY for each event in the final _common_clean file
| Quadrant A | 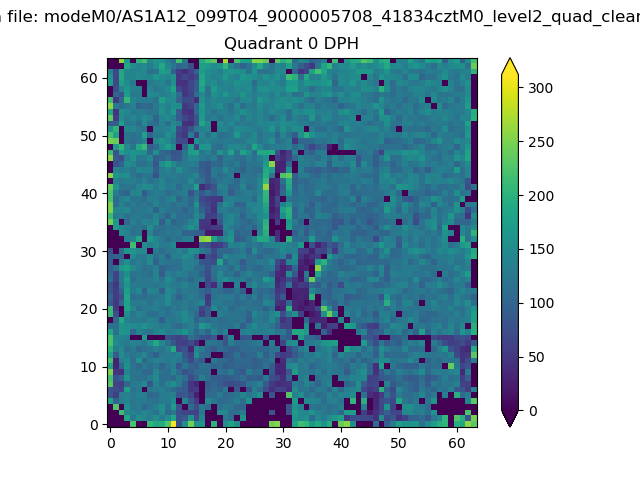 |
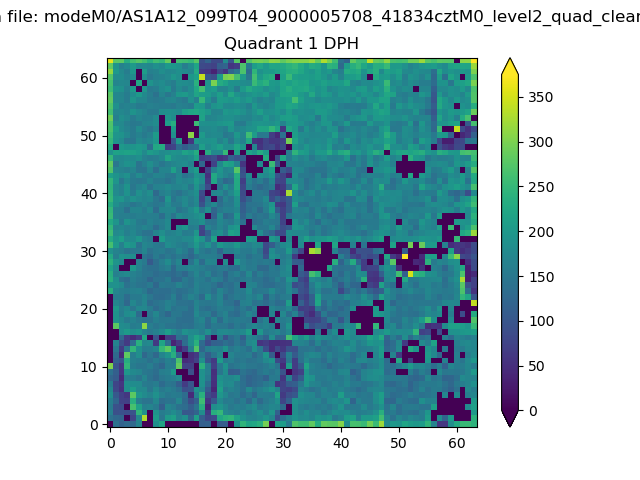 |
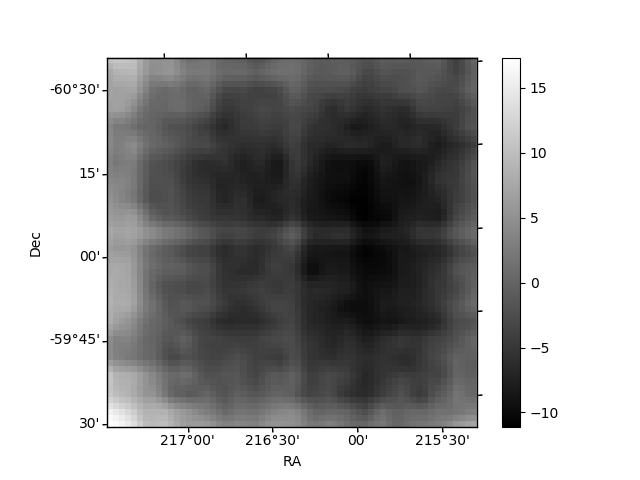
Quadrant B |
|---|---|---|---|
| Quadrant D | 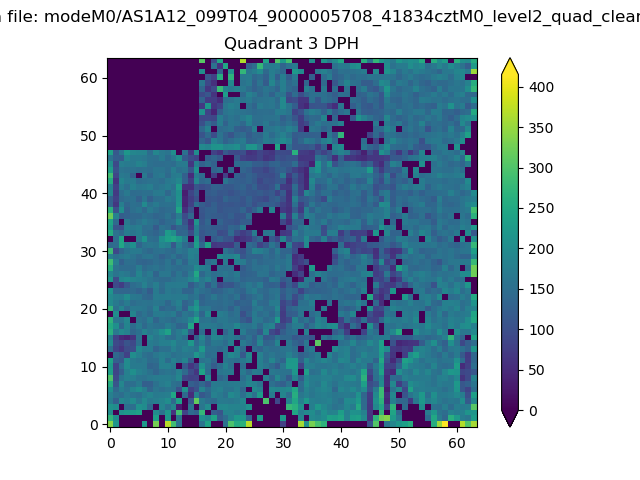 |
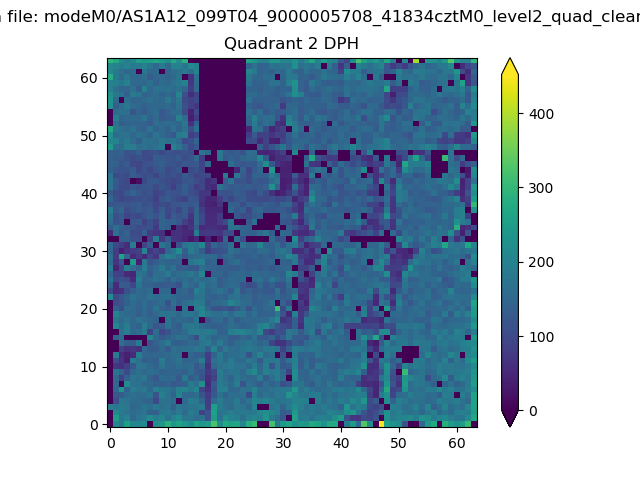 |
Quadrant C |
| Plot type | Count rate plots | Images |
|---|---|---|
| Comparison with Poisson distribution Blue bars denote a histogram of data divided into 1 sec bins. Red curve is a Poisson curve with rate = median count rate of data. |
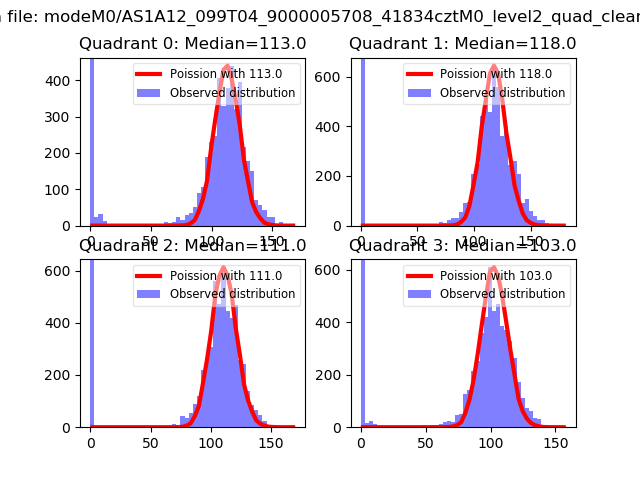 |
 |
| Quadrant-wise count rates Data is divided into 100 sec bins |
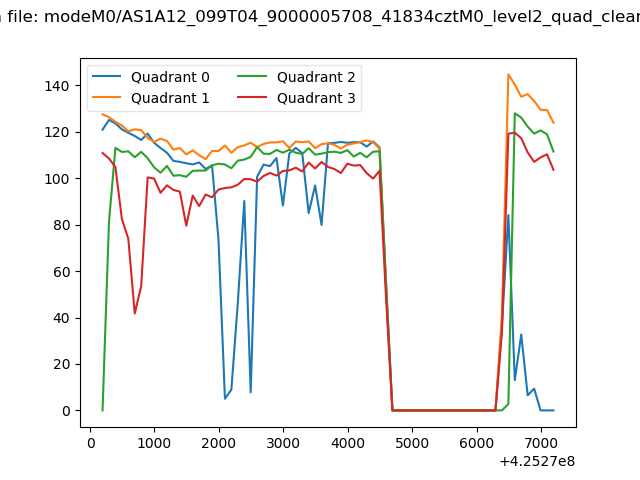 |
|
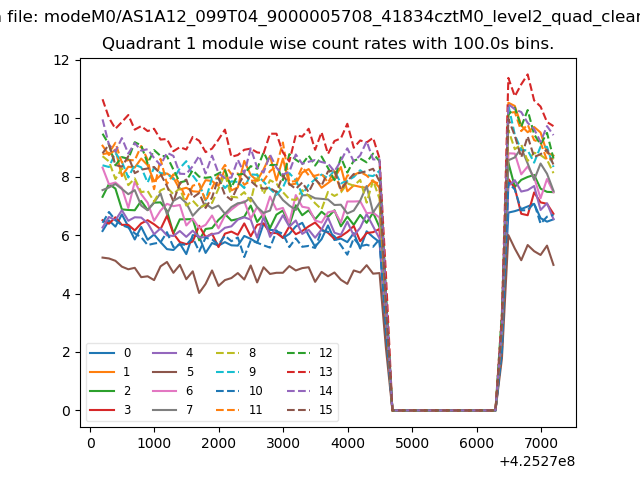
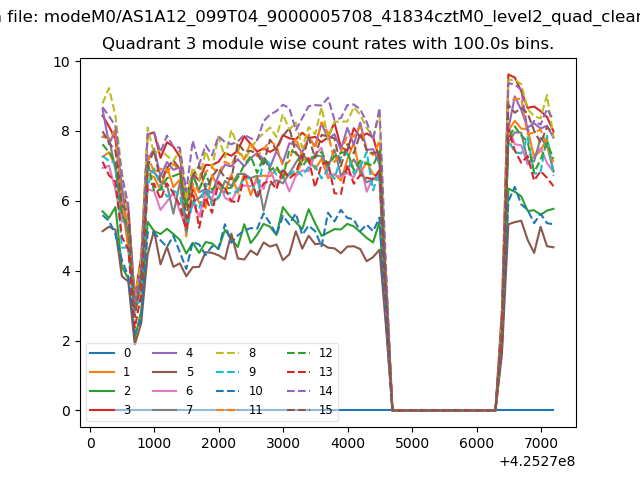
| Module-wise count rates for Quadrant A Data is divided into 100 sec bins |
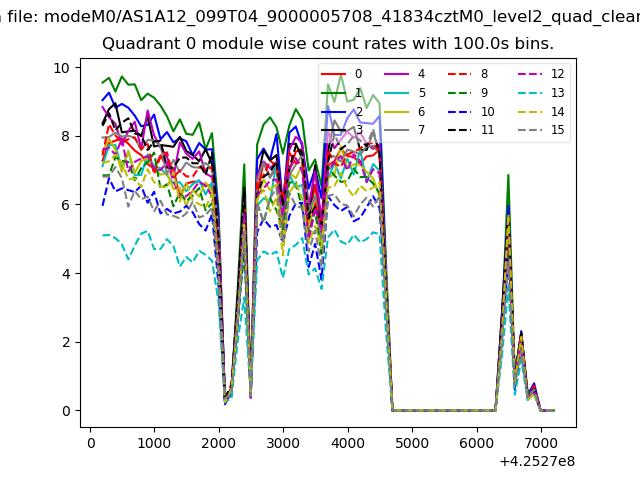 |
 |
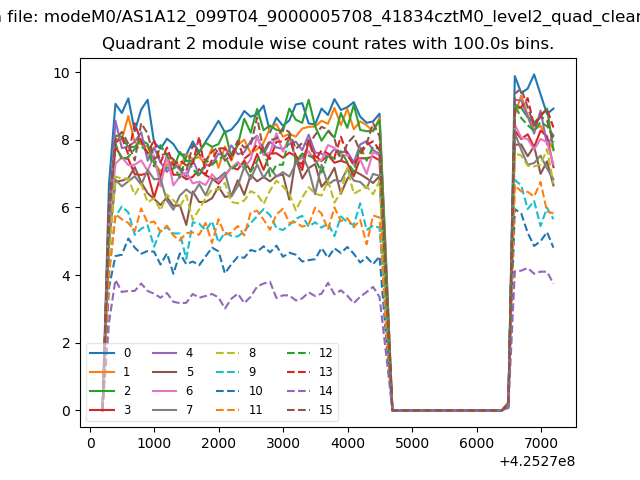
| Module-wise count rates for Quadrant B Data is divided into 100 sec bins |
 |
 |
| Module-wise count rates for Quadrant C Data is divided into 100 sec bins |
 |
 |
| Module-wise count rates for Quadrant D Data is divided into 100 sec bins |
 |
 |
| Parameter | Plot |
|---|---|
| CZT HV Monitor | 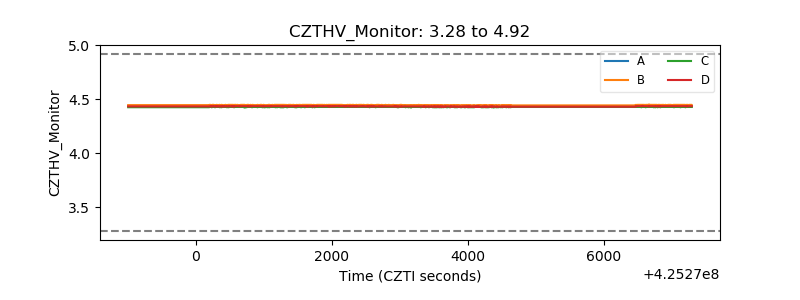 |
| D_VDD | 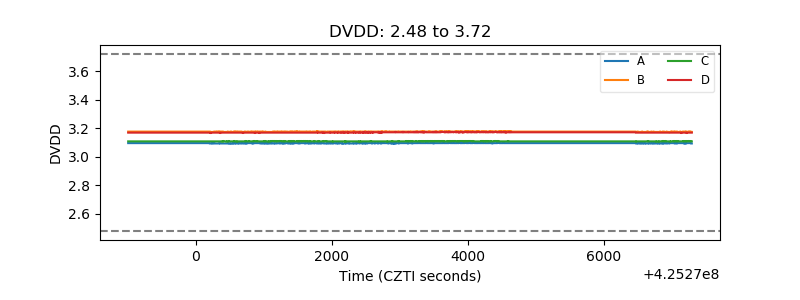 |
| Temperature 1 | 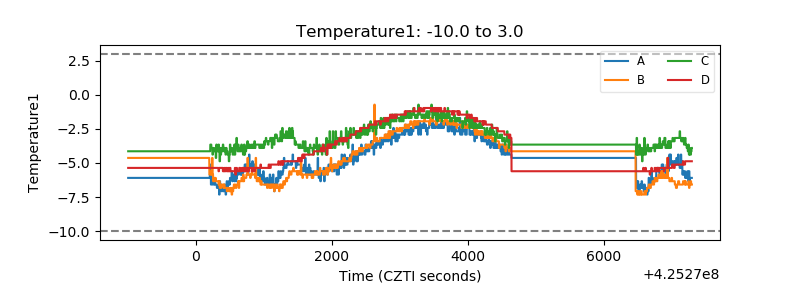 |
| Veto HV Monitor | 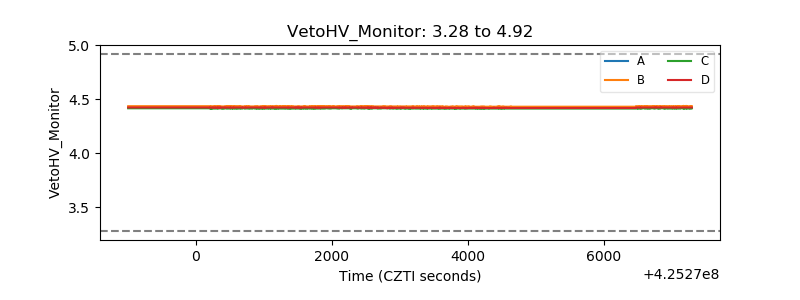 |
| Veto LLD | 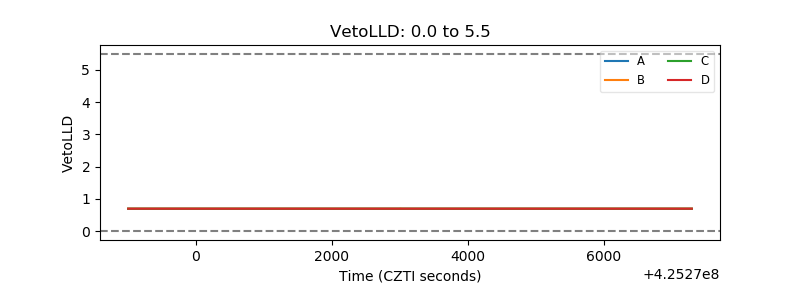 |
| Alpha Counter | 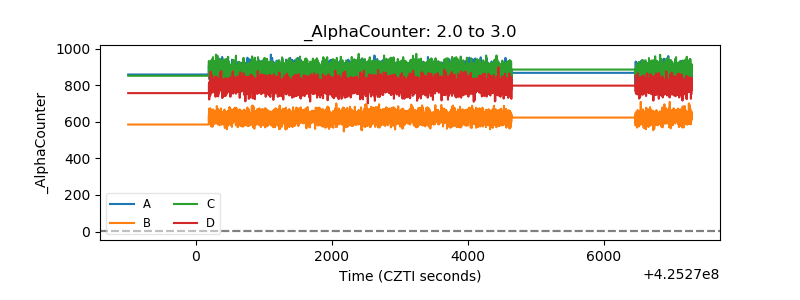 |
| _CPM_Rate | 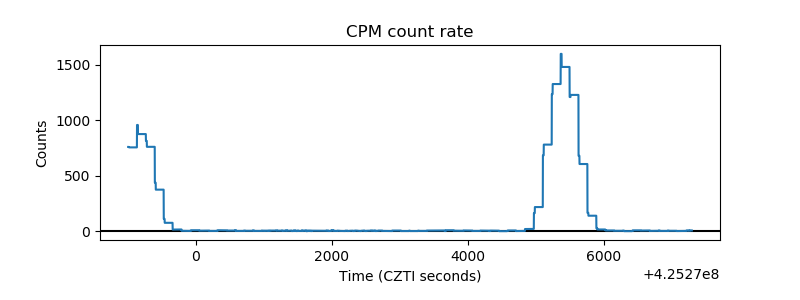 |
| CZT Counter | 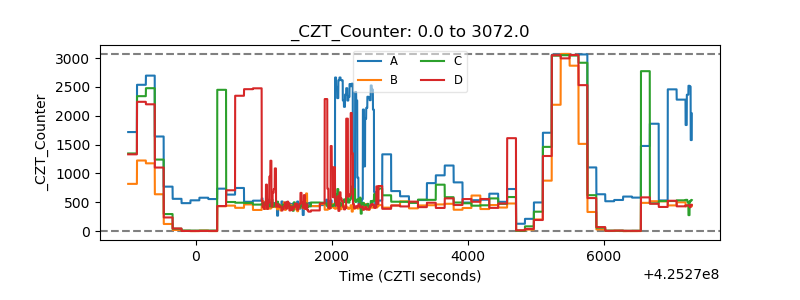 |
| +2.5 Volts monitor | 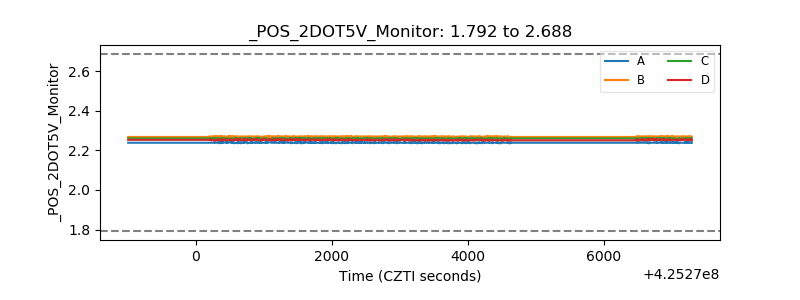 |
| +5 Volts monitor | 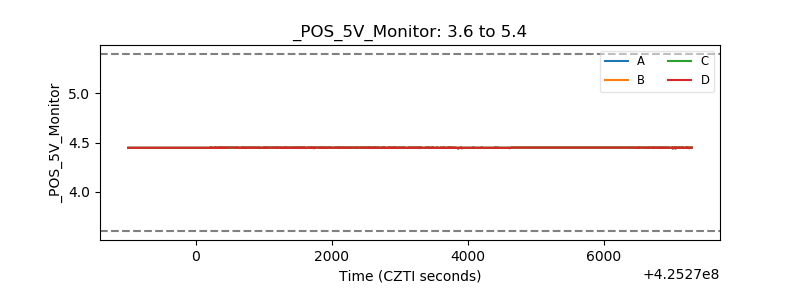 |
| _ROLL_ROT | 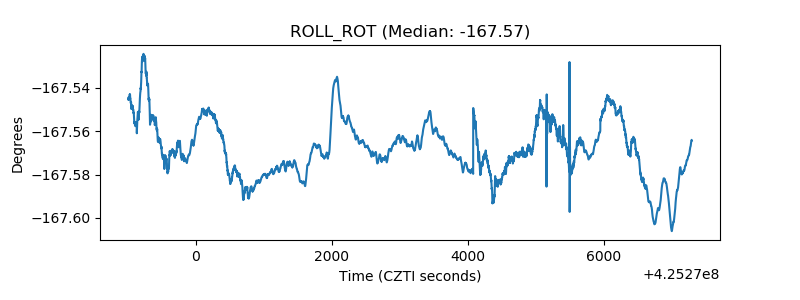 |
| _Roll_DEC |  |
| _Roll_RA | 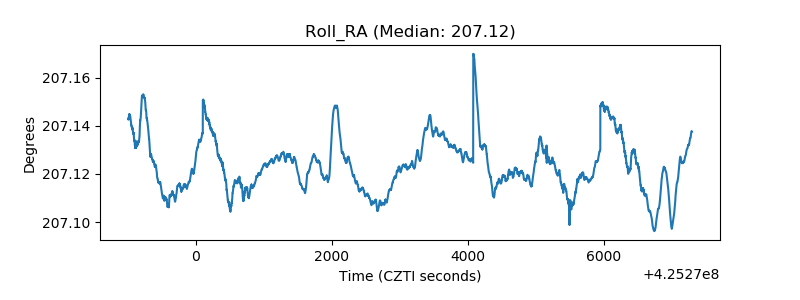 |
| Veto Counter | 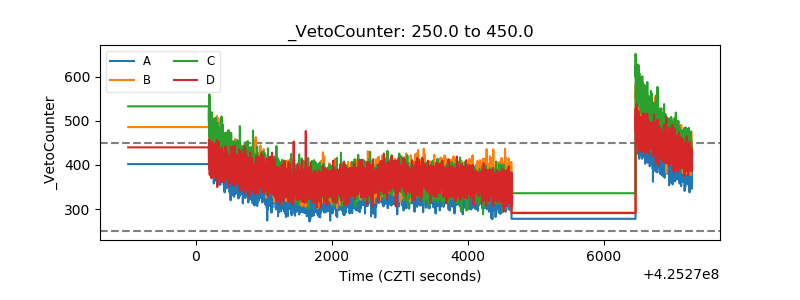 |