| Param | Original file | Final file |
|---|---|---|
| Filename | modeM0/AS1A12_099T04_9000005708_41835cztM0_level2.fits | modeM0/AS1A12_099T04_9000005708_41835cztM0_level2_quad_clean.evt |
| Size (bytes) | 391,222,080 | 87,076,800 |
| Size | 373.1 MB | 83.0 MB |
| Events in quadrant A | 5,612,445 | 495,388 |
| Events in quadrant B | 2,349,220 | 647,536 |
| Events in quadrant C | 3,237,751 | 576,540 |
| Events in quadrant D | 2,881,672 | 556,607 |
| Mode M0 | |||
|---|---|---|---|
| Quadrant | BADHDUFLAG | Total packets | Discarded packets |
| A | 0 | 20065 | 3 |
| B | 0 | 10360 | 2 |
| C | 0 | 12621 | 2 |
| D | 0 | 12092 | 2 |
| Mode SS | |||
|---|---|---|---|
| Quadrant | BADHDUFLAG | Total packets | Discarded packets |
| A | 0 | 106 | 0 |
| B | 0 | 106 | 0 |
| C | 0 | 106 | 0 |
| D | 0 | 106 | 0 |
| Mode M9 | |||
|---|---|---|---|
| Quadrant | BADHDUFLAG | Total packets | Discarded packets |
| A | 0 | 24 | 0 |
| B | 0 | 24 | 0 |
| C | 0 | 24 | 0 |
| D | 0 | 25 | 0 |
| Quadrant | Total seconds | Saturated seconds | Saturation percentage |
|---|---|---|---|
| A | 5144 | 1192 | 23.172628% |
| B | 5144 | 7 | 0.136081% |
| C | 5144 | 265 | 5.151633% |
| D | 5144 | 86 | 1.671851% |
Noise dominated data is calculated using 1-second bins in cleaned event files. If a bin has >2000 counts, and if more than 50% of those come from <1% of pixels, then it is considered to be noise-dominated and hence unusable.
| Quadrant | # 1 sec bins | Bins with >0 counts | Bins with >2000 counts | High rate bins dominated by noise | Noise dominated (total time) | Noise dominated (detector-on time) | Marked lightcurve |
|---|---|---|---|---|---|---|---|
| A | 7056 | 5145 | 809 | 809 | 11.47% | 15.72% | 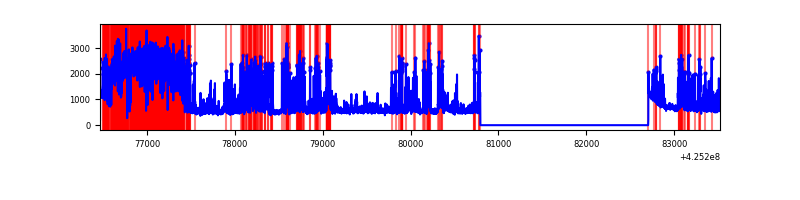 |
| B | 7056 | 5145 | 0 | 0 | 0.00% | 0.00% | 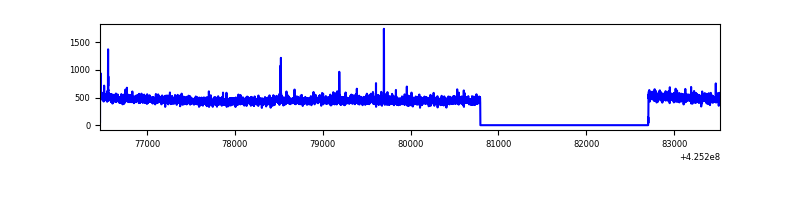 |
| C | 7056 | 5145 | 255 | 255 | 3.61% | 4.96% | 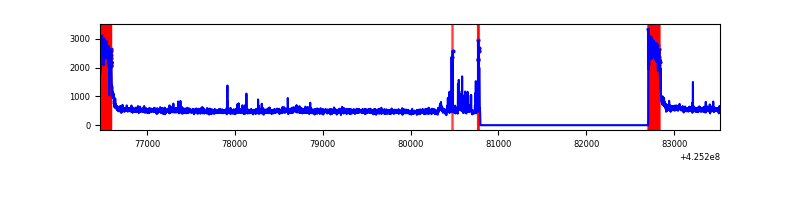 |
| D | 7056 | 5145 | 73 | 73 | 1.03% | 1.42% | 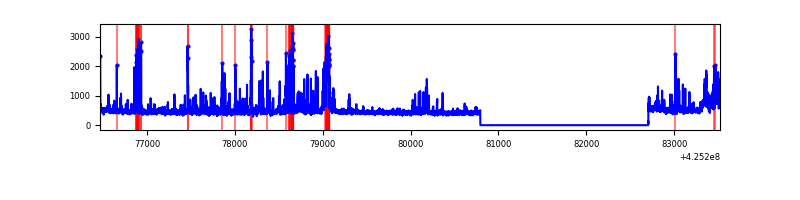 |
Top three noisy pixels from each quadrant. If the there are fewer than three noisy pixels in the level2.evt file, extra rows are filled as -1
| Pixel properties | Quadrant properties | ||||||
|---|---|---|---|---|---|---|---|
| Quadrant | DetID | PixID | Counts | Sigma | Mean | Median | Sigma |
| A | 14 | 24 | 3160976 | 30381.55 | 509 | 500 | 104.0 |
| A | 10 | 83 | 449825 | 4319.35 | 509 | 500 | 104.0 |
| A | 2 | 79 | 23838 | 224.35 | 509 | 500 | 104.0 |
| B | 0 | 183 | 21104 | 184.83 | 589 | 575 | 111.1 |
| B | 12 | 111 | 13570 | 117.0 | 589 | 575 | 111.1 |
| B | 11 | 111 | 12409 | 106.54 | 589 | 575 | 111.1 |
| C | 0 | 10 | 748479 | 5805.95 | 559 | 562 | 128.8 |
| C | 15 | 214 | 206104 | 1595.59 | 559 | 562 | 128.8 |
| C | 14 | 254 | 103064 | 795.71 | 559 | 562 | 128.8 |
| D | 13 | 249 | 211502 | 1508.26 | 577 | 561 | 139.9 |
| D | 2 | 249 | 174506 | 1243.74 | 577 | 561 | 139.9 |
| D | 5 | 222 | 133576 | 951.08 | 577 | 561 | 139.9 |
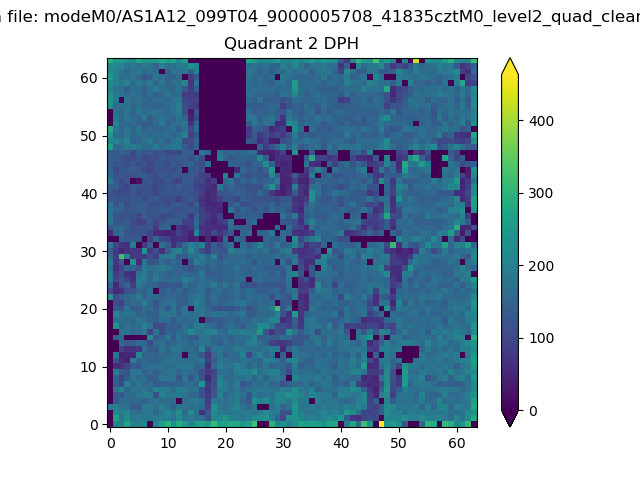
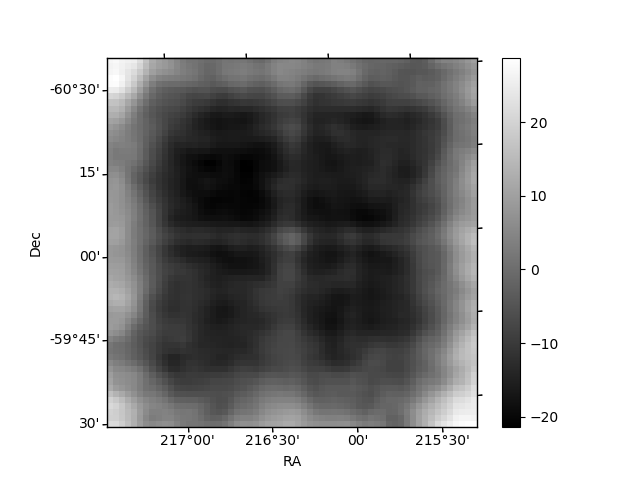
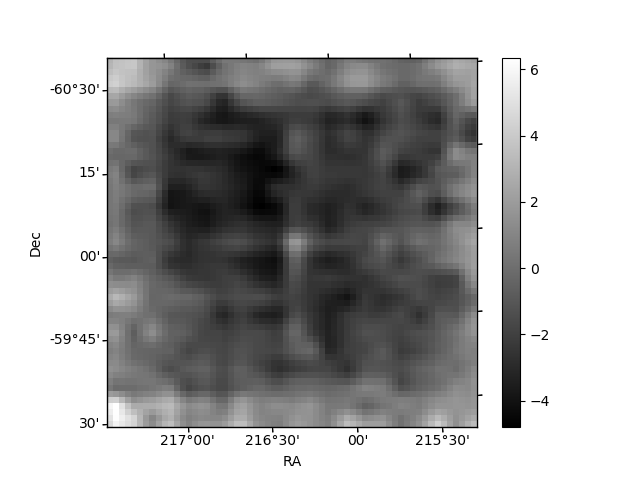
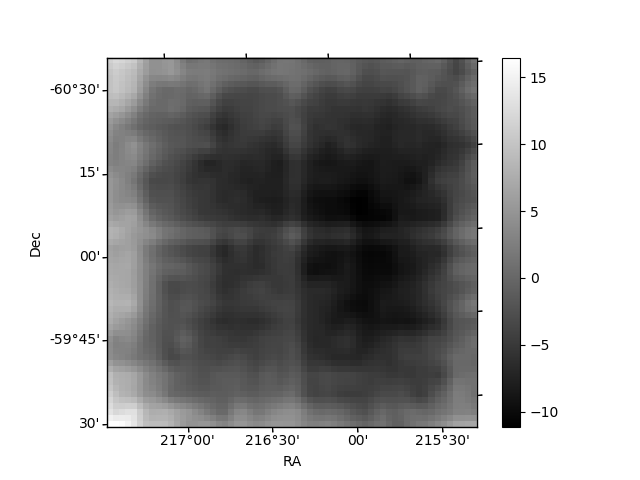
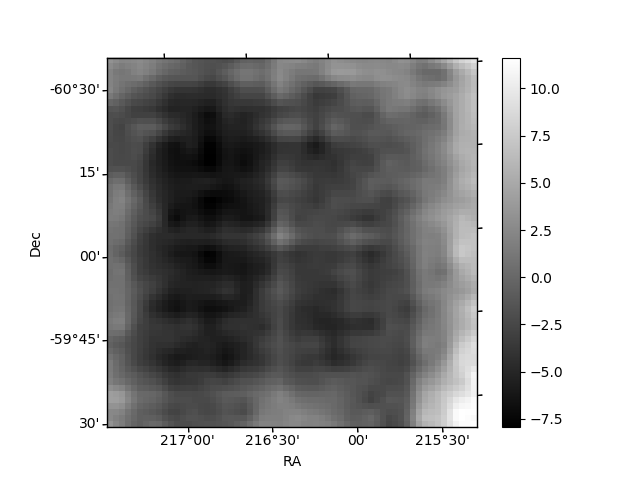
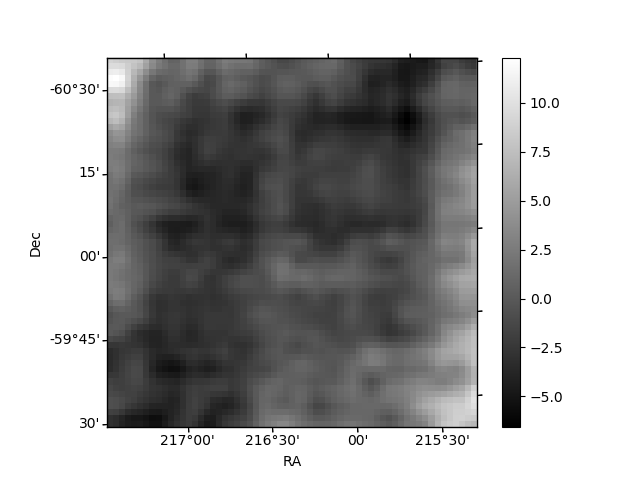
Histogram calculated using DETX and DETY for each event in the final _common_clean file
| Quadrant A | 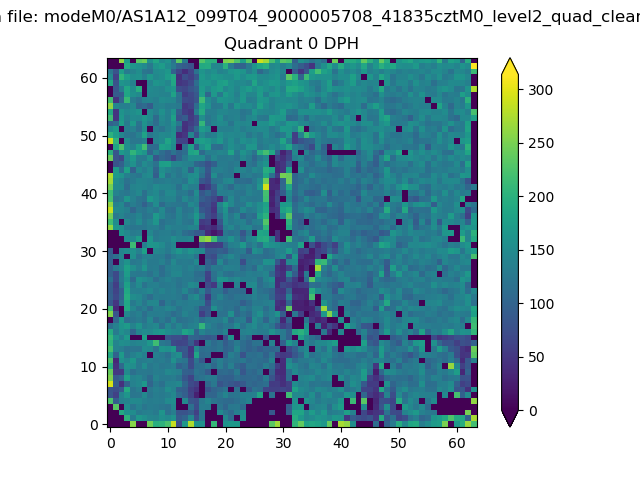 |
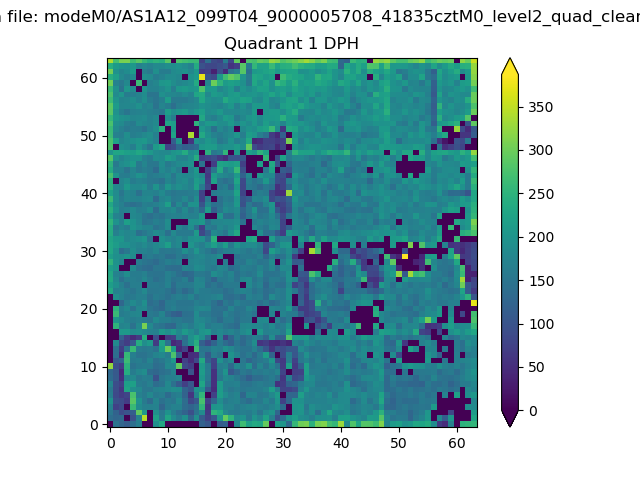 |
Quadrant B |
|---|---|---|---|
| Quadrant D | 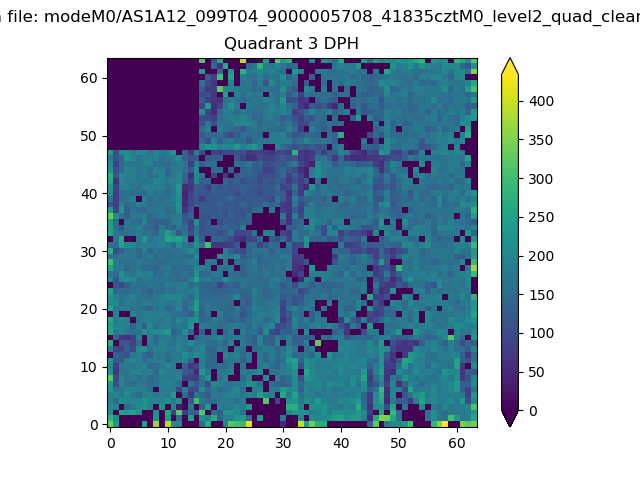 |
 |
Quadrant C |
| Plot type | Count rate plots | Images |
|---|---|---|
| Comparison with Poisson distribution Blue bars denote a histogram of data divided into 1 sec bins. Red curve is a Poisson curve with rate = median count rate of data. |
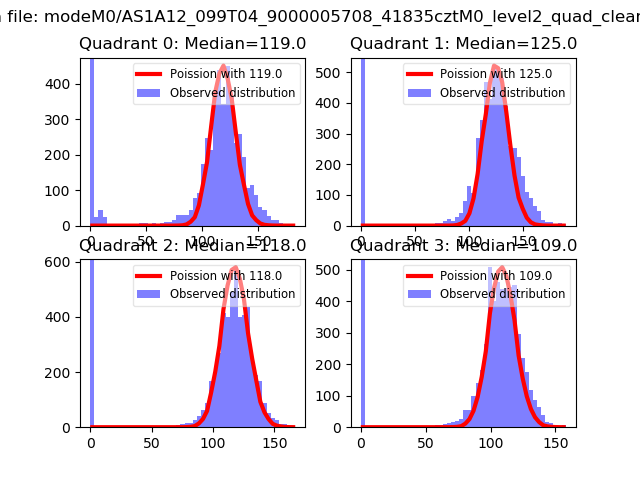 |
 |
| Quadrant-wise count rates Data is divided into 100 sec bins |
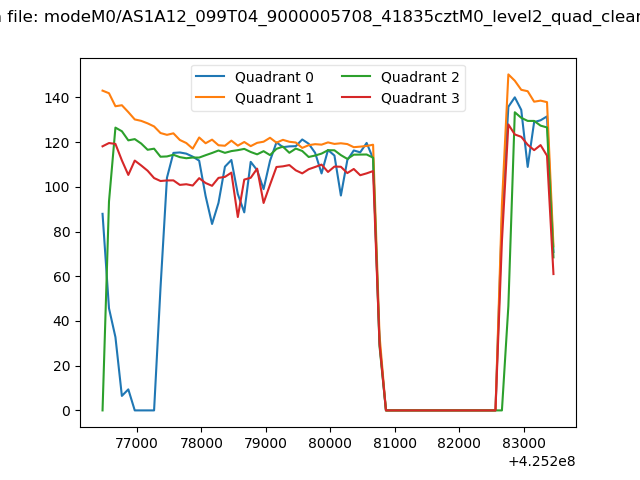 |
|
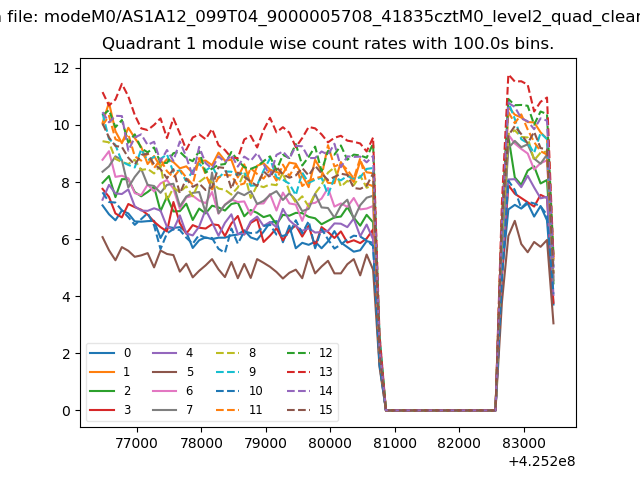
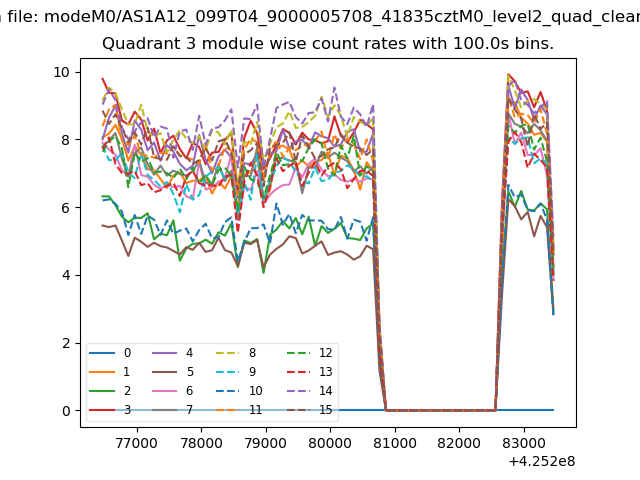
| Module-wise count rates for Quadrant A Data is divided into 100 sec bins |
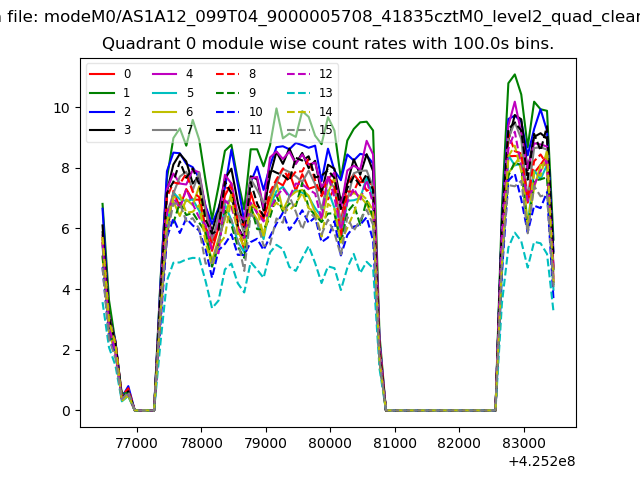 |
 |
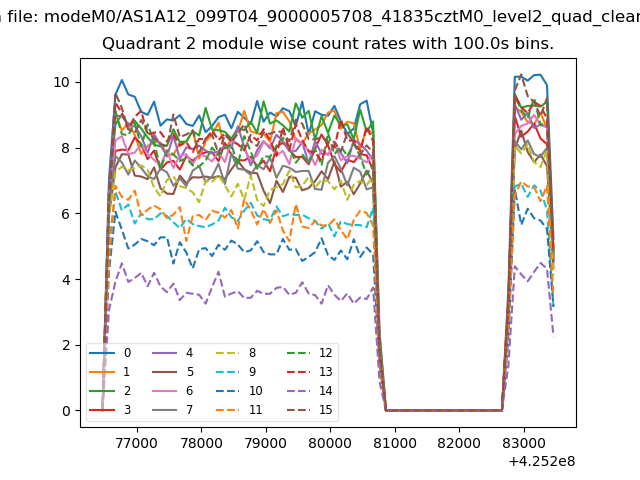
| Module-wise count rates for Quadrant B Data is divided into 100 sec bins |
 |
 |
| Module-wise count rates for Quadrant C Data is divided into 100 sec bins |
 |
 |
| Module-wise count rates for Quadrant D Data is divided into 100 sec bins |
 |
 |
| Parameter | Plot |
|---|---|
| CZT HV Monitor | 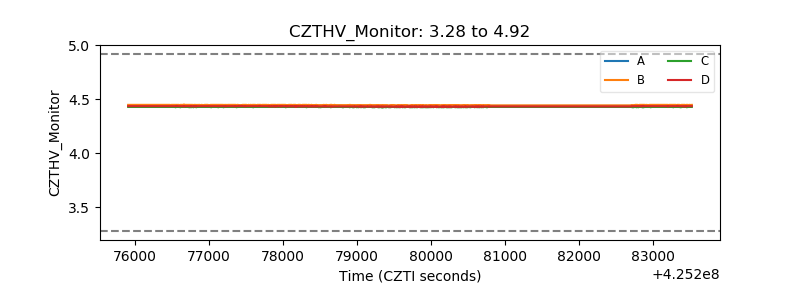 |
| D_VDD | 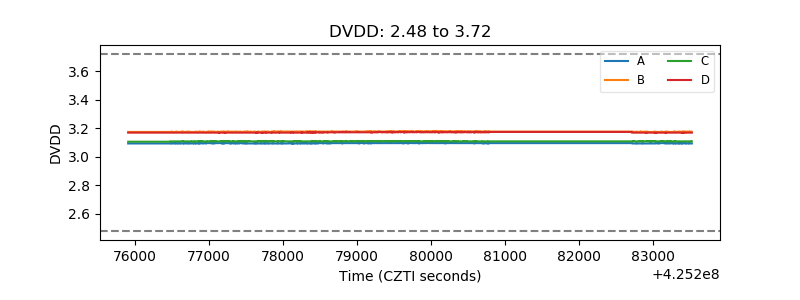 |
| Temperature 1 | 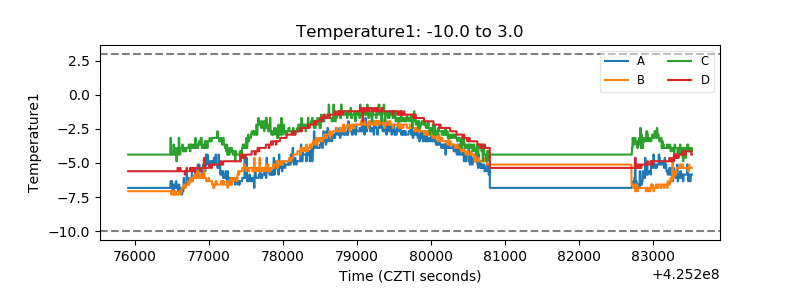 |
| Veto HV Monitor | 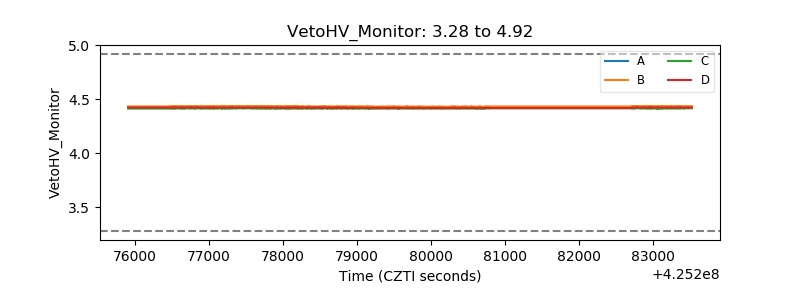 |
| Veto LLD | 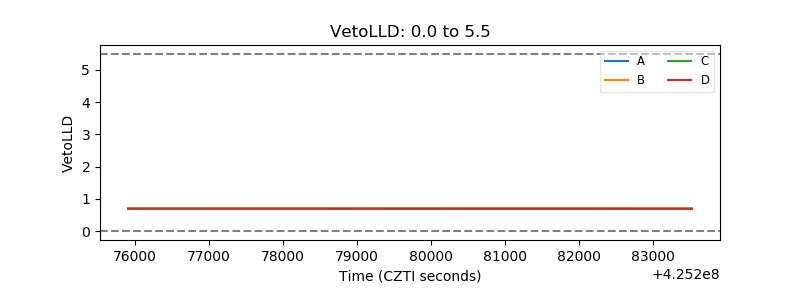 |
| Alpha Counter | 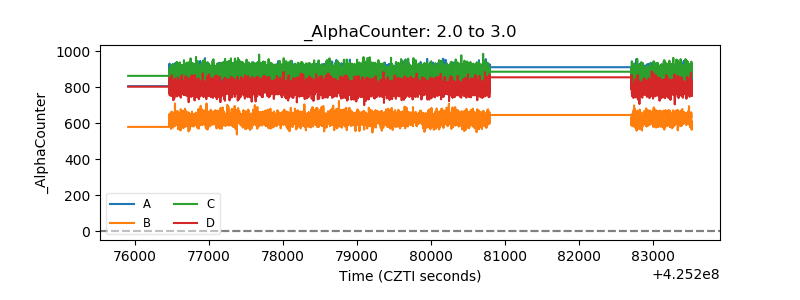 |
| _CPM_Rate | 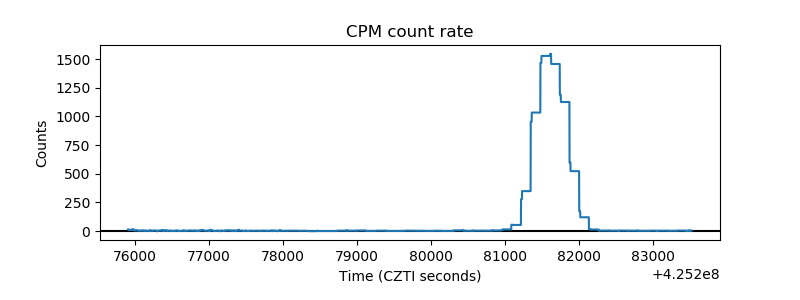 |
| CZT Counter | 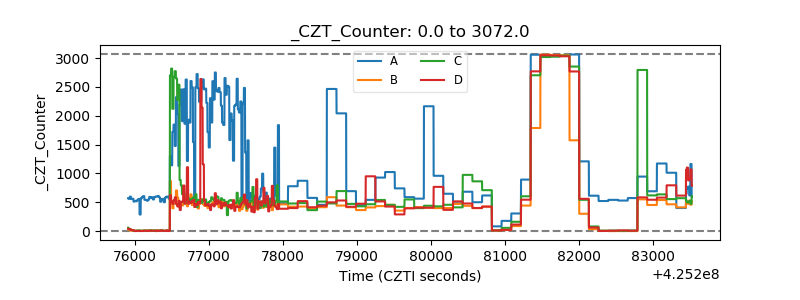 |
| +2.5 Volts monitor | 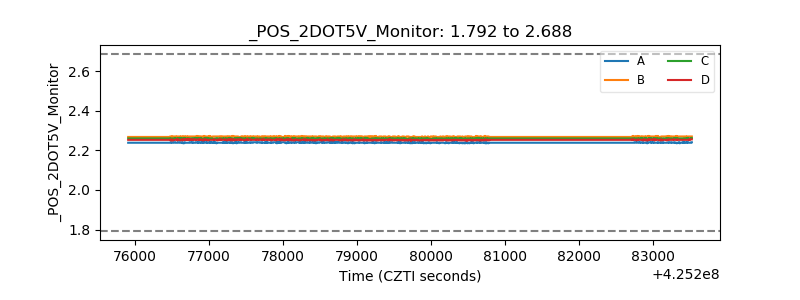 |
| +5 Volts monitor | 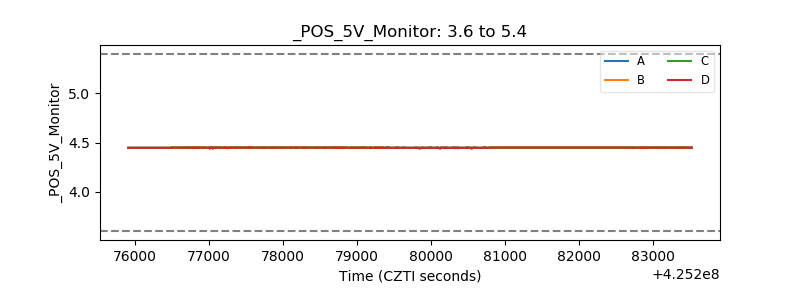 |
| _ROLL_ROT | 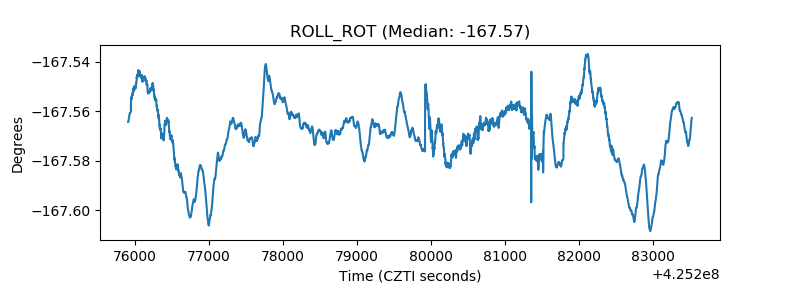 |
| _Roll_DEC | 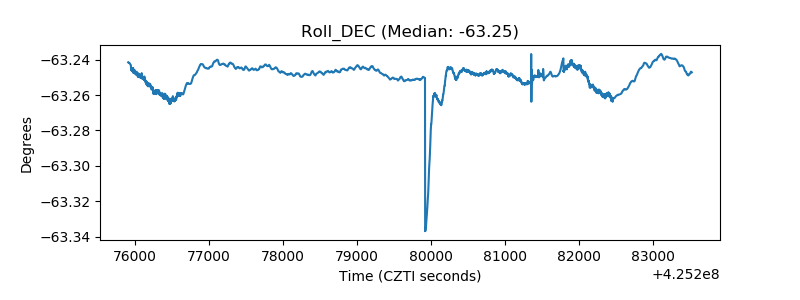 |
| _Roll_RA | 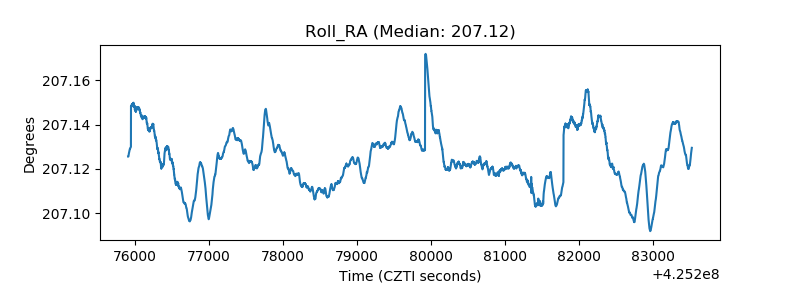 |
| Veto Counter | 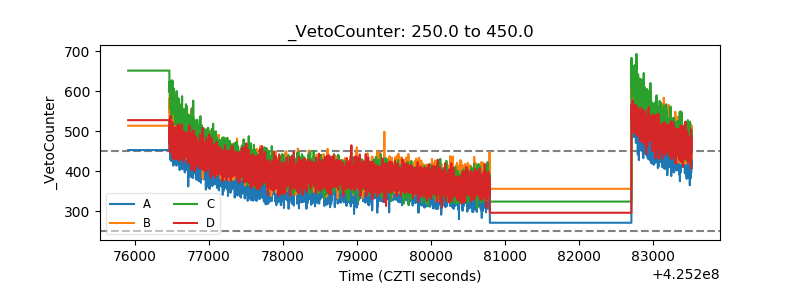 |