| Param | Original file | Final file |
|---|---|---|
| Filename | modeM0/AS1A12_099T04_9000005708_41836cztM0_level2.fits | modeM0/AS1A12_099T04_9000005708_41836cztM0_level2_quad_clean.evt |
| Size (bytes) | 357,396,480 | 91,673,280 |
| Size | 340.8 MB | 87.4 MB |
| Events in quadrant A | 3,985,681 | 618,036 |
| Events in quadrant B | 2,441,159 | 655,732 |
| Events in quadrant C | 3,197,611 | 585,177 |
| Events in quadrant D | 3,215,145 | 565,293 |
| Mode M0 | |||
|---|---|---|---|
| Quadrant | BADHDUFLAG | Total packets | Discarded packets |
| A | 0 | 15148 | 2 |
| B | 0 | 10428 | 2 |
| C | 0 | 12450 | 2 |
| D | 0 | 12833 | 2 |
| Mode SS | |||
|---|---|---|---|
| Quadrant | BADHDUFLAG | Total packets | Discarded packets |
| A | 0 | 104 | 0 |
| B | 0 | 104 | 0 |
| C | 0 | 104 | 0 |
| D | 0 | 104 | 0 |
| Mode M9 | |||
|---|---|---|---|
| Quadrant | BADHDUFLAG | Total packets | Discarded packets |
| A | 0 | 33 | 0 |
| B | 0 | 33 | 0 |
| C | 0 | 34 | 0 |
| D | 0 | 34 | 0 |
| Quadrant | Total seconds | Saturated seconds | Saturation percentage |
|---|---|---|---|
| A | 5013 | 235 | 4.687812% |
| B | 5013 | 13 | 0.259326% |
| C | 5013 | 283 | 5.645322% |
| D | 5013 | 102 | 2.034710% |
Noise dominated data is calculated using 1-second bins in cleaned event files. If a bin has >2000 counts, and if more than 50% of those come from <1% of pixels, then it is considered to be noise-dominated and hence unusable.
| Quadrant | # 1 sec bins | Bins with >0 counts | Bins with >2000 counts | High rate bins dominated by noise | Noise dominated (total time) | Noise dominated (detector-on time) | Marked lightcurve |
|---|---|---|---|---|---|---|---|
| A | 7046 | 5014 | 164 | 164 | 2.33% | 3.27% | 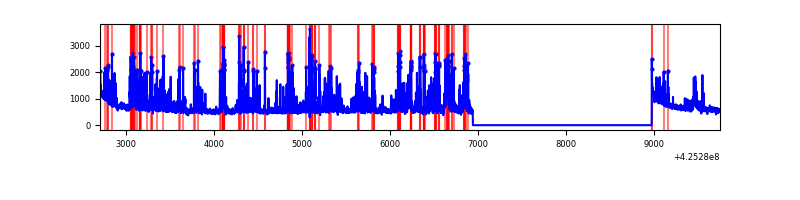 |
| B | 7046 | 5014 | 5 | 5 | 0.07% | 0.10% | 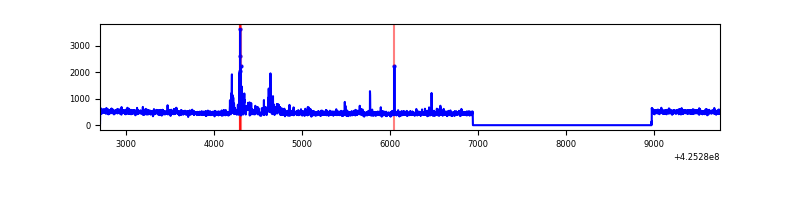 |
| C | 7046 | 5014 | 274 | 274 | 3.89% | 5.46% | 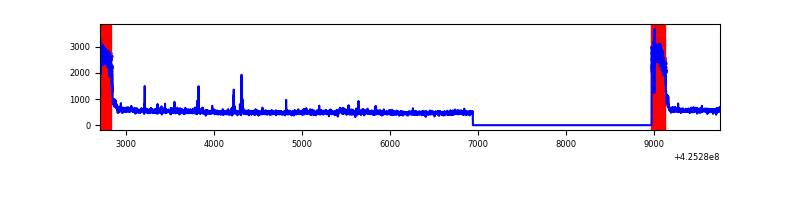 |
| D | 7046 | 5014 | 109 | 109 | 1.55% | 2.17% | 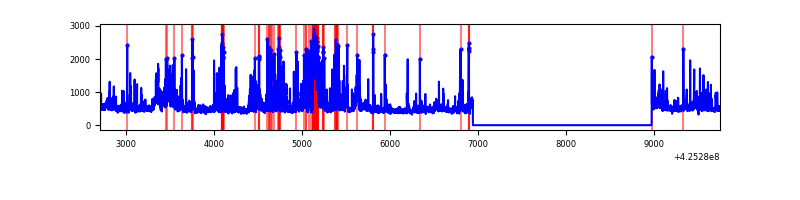 |
Top three noisy pixels from each quadrant. If the there are fewer than three noisy pixels in the level2.evt file, extra rows are filled as -1
| Pixel properties | Quadrant properties | ||||||
|---|---|---|---|---|---|---|---|
| Quadrant | DetID | PixID | Counts | Sigma | Mean | Median | Sigma |
| A | 14 | 24 | 1183895 | 10073.32 | 585 | 573 | 117.5 |
| A | 10 | 83 | 508882 | 4327.1 | 585 | 573 | 117.5 |
| A | 2 | 79 | 26122 | 217.49 | 585 | 573 | 117.5 |
| B | 0 | 183 | 62080 | 557.87 | 587 | 573 | 110.3 |
| B | 3 | 112 | 52152 | 467.82 | 587 | 573 | 110.3 |
| B | 12 | 111 | 13538 | 117.59 | 587 | 573 | 110.3 |
| C | 0 | 10 | 799996 | 6275.86 | 554 | 557 | 127.4 |
| C | 15 | 214 | 201494 | 1577.42 | 554 | 557 | 127.4 |
| C | 14 | 254 | 28177 | 216.83 | 554 | 557 | 127.4 |
| D | 5 | 222 | 648465 | 4692.8 | 576 | 561 | 138.1 |
| D | 2 | 249 | 139356 | 1005.3 | 576 | 561 | 138.1 |
| D | 13 | 249 | 95260 | 685.91 | 576 | 561 | 138.1 |
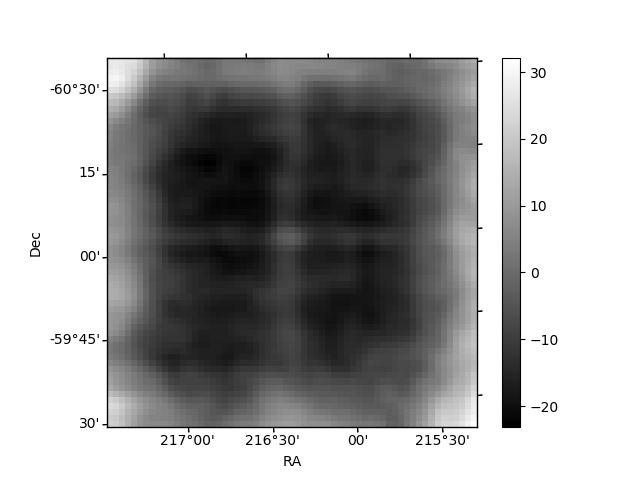
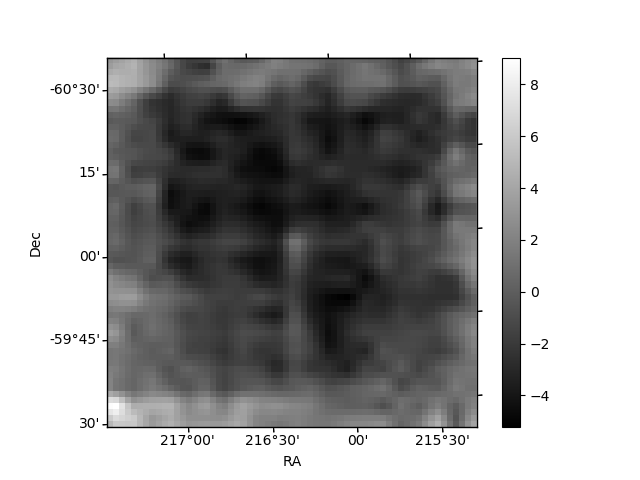
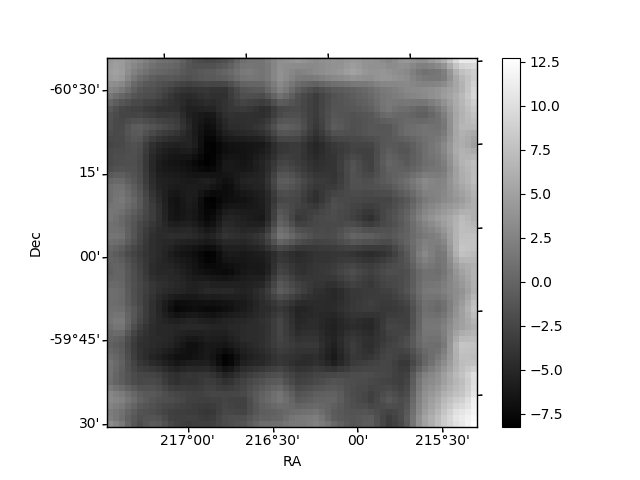
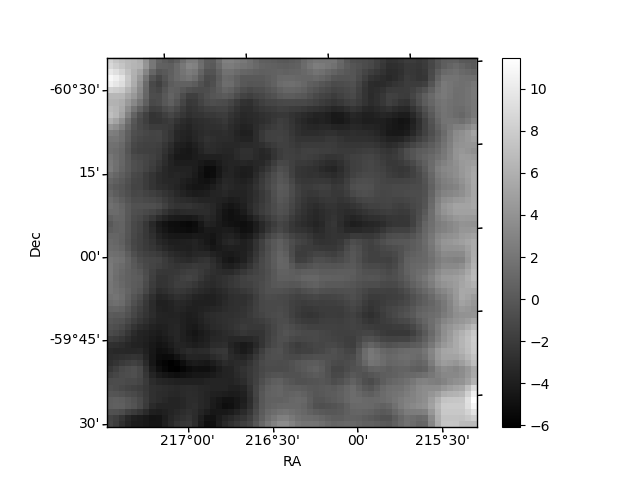
Histogram calculated using DETX and DETY for each event in the final _common_clean file
| Quadrant A | 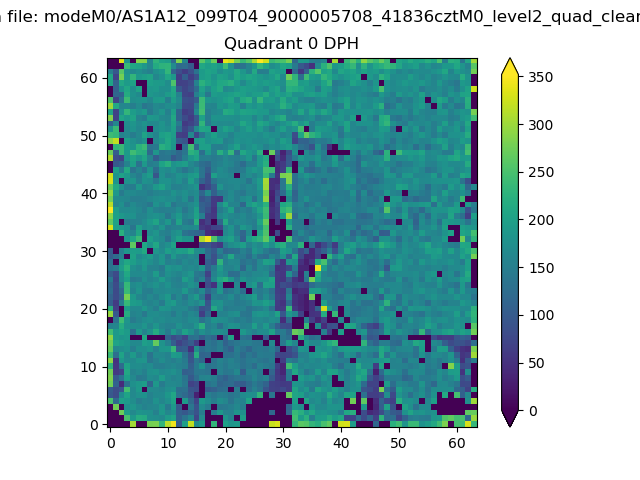 |
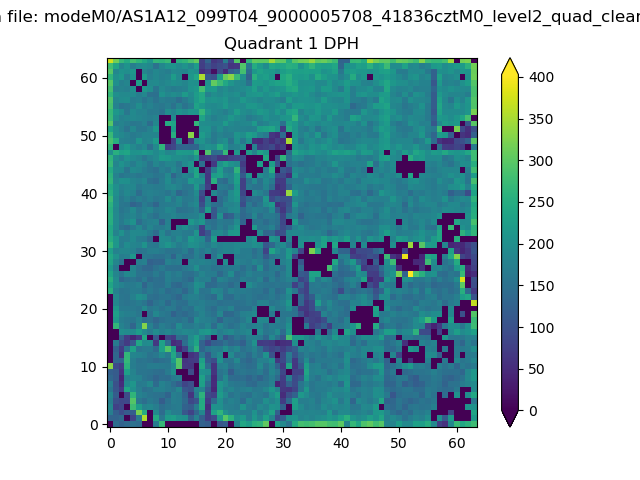 |
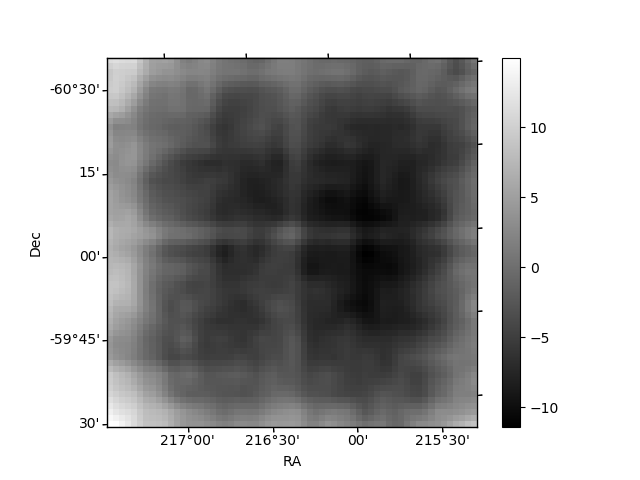
Quadrant B |
|---|---|---|---|
| Quadrant D | 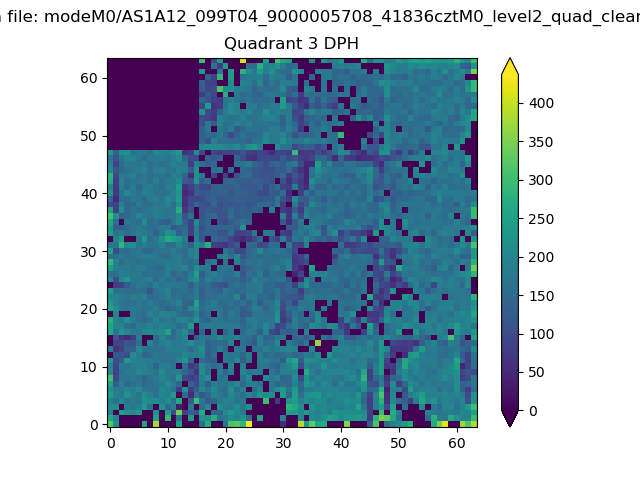 |
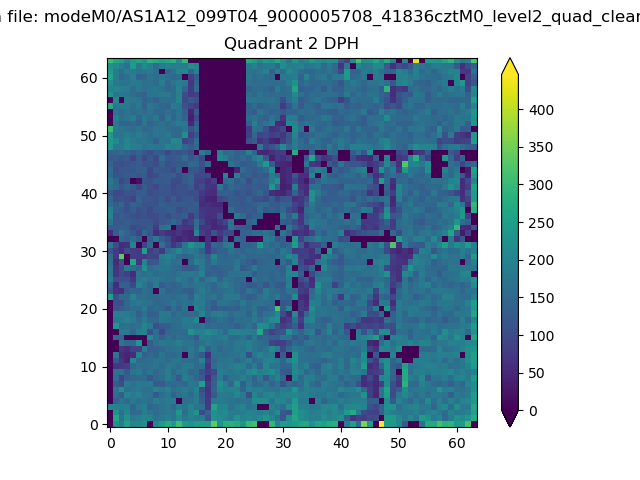 |
Quadrant C |
| Plot type | Count rate plots | Images |
|---|---|---|
| Comparison with Poisson distribution Blue bars denote a histogram of data divided into 1 sec bins. Red curve is a Poisson curve with rate = median count rate of data. |
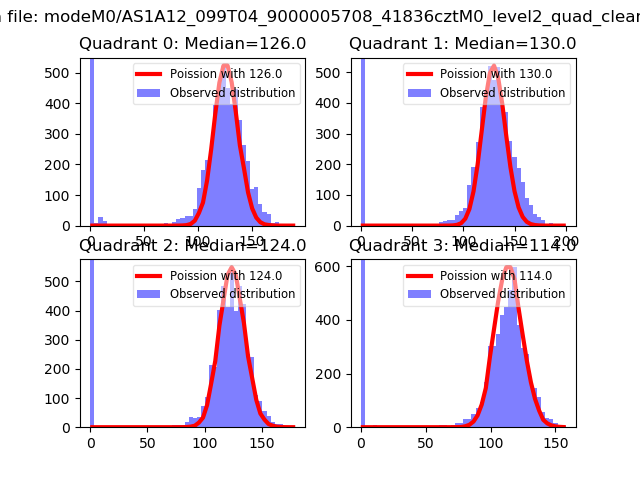 |
 |
| Quadrant-wise count rates Data is divided into 100 sec bins |
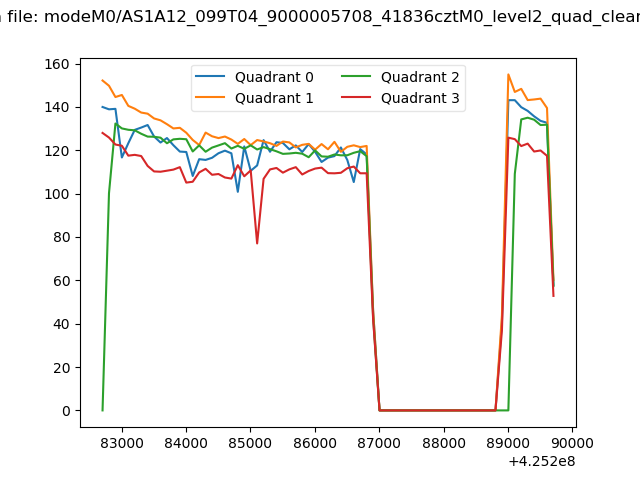 |
|
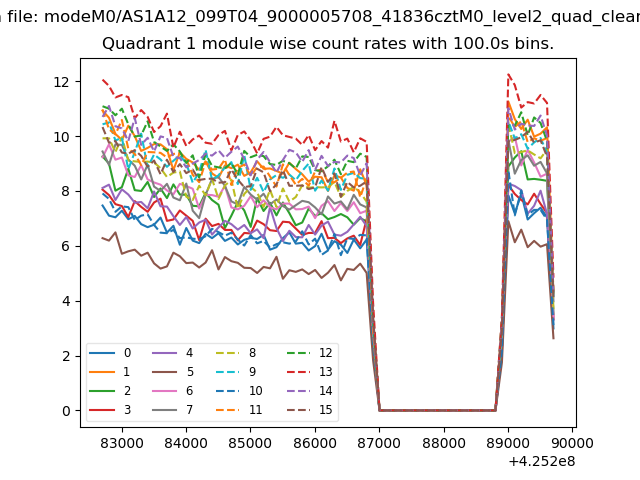
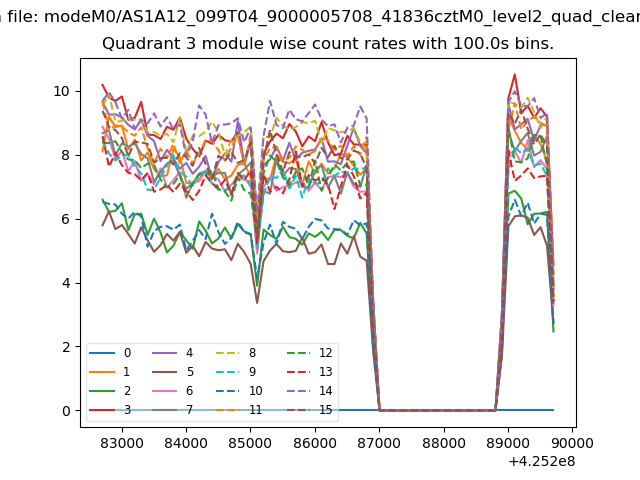
| Module-wise count rates for Quadrant A Data is divided into 100 sec bins |
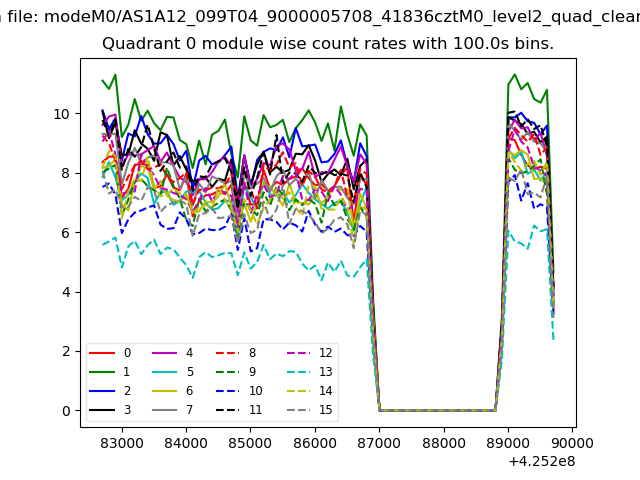 |
 |
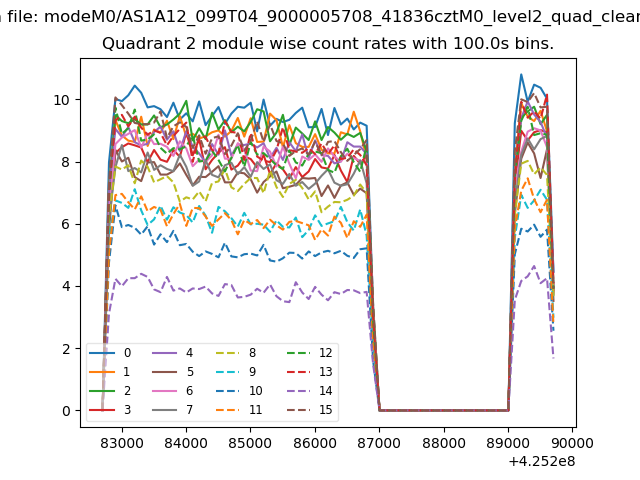
| Module-wise count rates for Quadrant B Data is divided into 100 sec bins |
 |
 |
| Module-wise count rates for Quadrant C Data is divided into 100 sec bins |
 |
 |
| Module-wise count rates for Quadrant D Data is divided into 100 sec bins |
 |
 |
| Parameter | Plot |
|---|---|
| CZT HV Monitor | 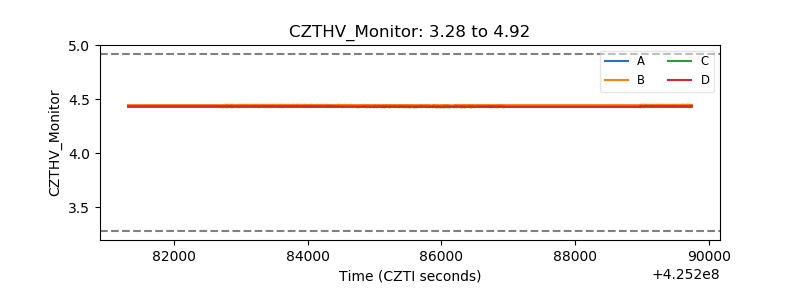 |
| D_VDD | 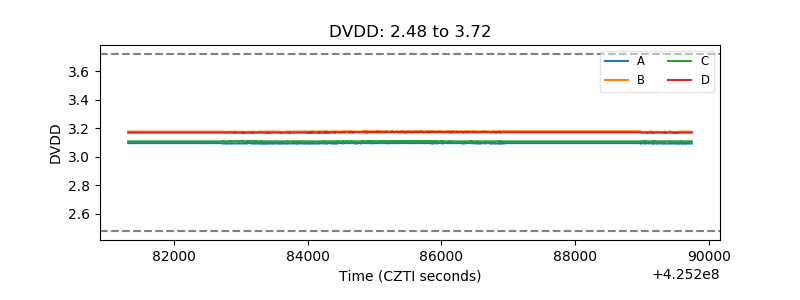 |
| Temperature 1 |  |
| Veto HV Monitor | 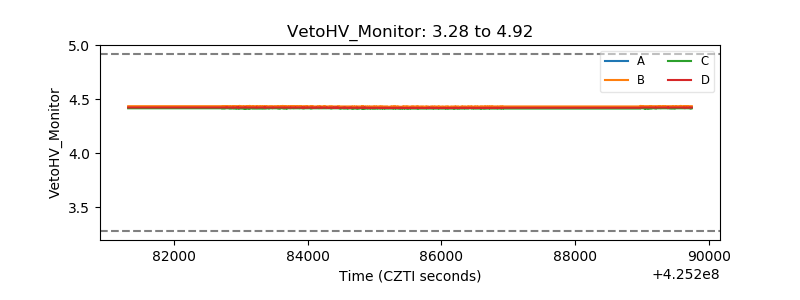 |
| Veto LLD | 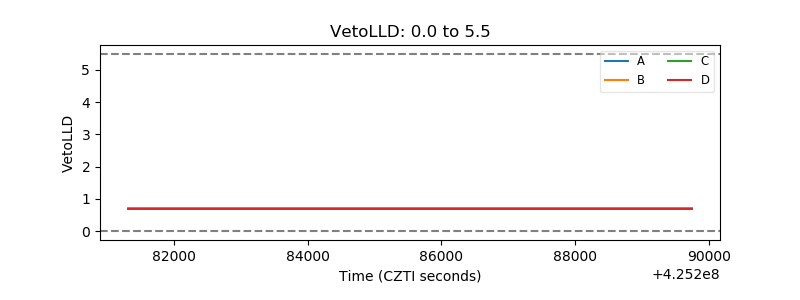 |
| Alpha Counter | 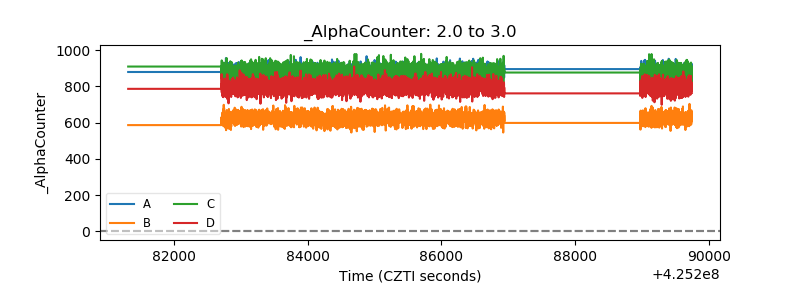 |
| _CPM_Rate | 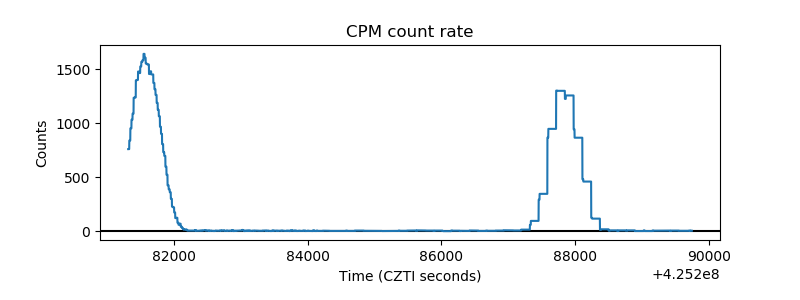 |
| CZT Counter | 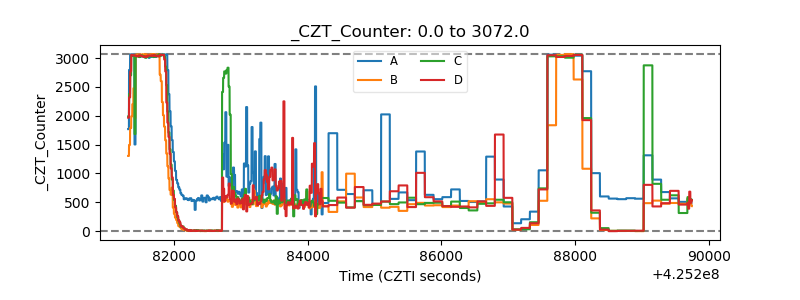 |
| +2.5 Volts monitor | 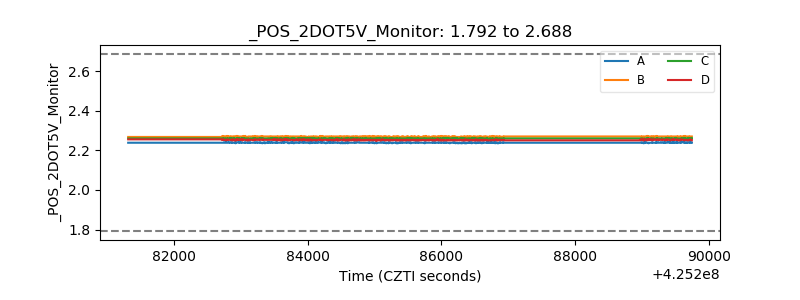 |
| +5 Volts monitor | 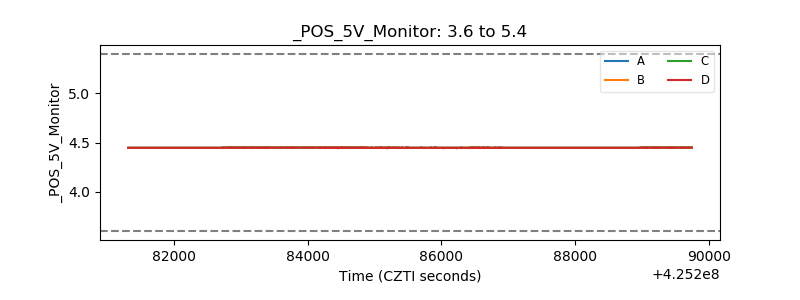 |
| _ROLL_ROT | 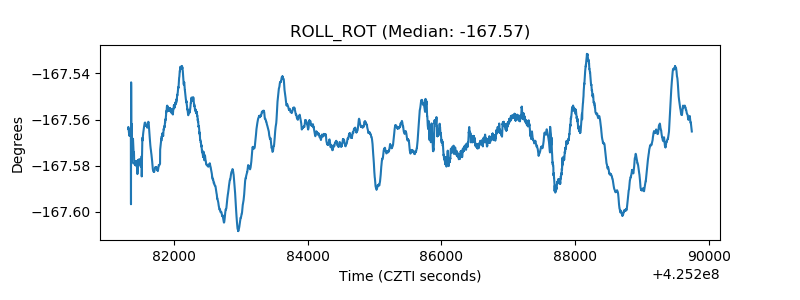 |
| _Roll_DEC | 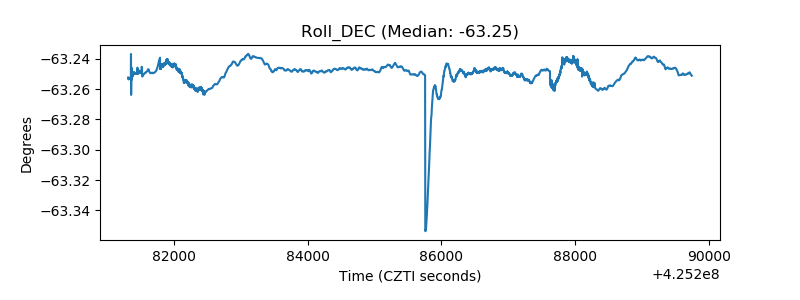 |
| _Roll_RA | 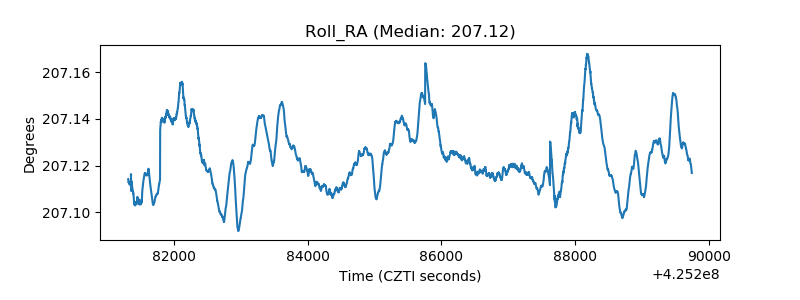 |
| Veto Counter | 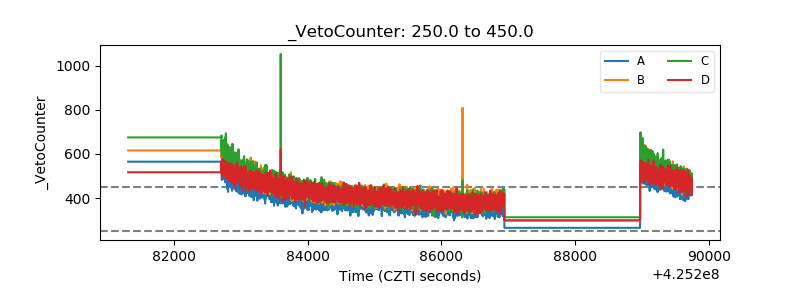 |