| Param | Original file | Final file |
|---|---|---|
| Filename | modeM0/AS1A12_099T04_9000005708_41837cztM0_level2.fits | modeM0/AS1A12_099T04_9000005708_41837cztM0_level2_quad_clean.evt |
| Size (bytes) | 329,857,920 | 90,918,720 |
| Size | 314.6 MB | 86.7 MB |
| Events in quadrant A | 3,671,522 | 616,287 |
| Events in quadrant B | 2,328,162 | 646,982 |
| Events in quadrant C | 3,248,841 | 576,495 |
| Events in quadrant D | 2,575,968 | 566,098 |
| Mode M0 | |||
|---|---|---|---|
| Quadrant | BADHDUFLAG | Total packets | Discarded packets |
| A | 0 | 14091 | 2 |
| B | 0 | 10086 | 2 |
| C | 0 | 12537 | 3 |
| D | 0 | 10903 | 2 |
| Mode SS | |||
|---|---|---|---|
| Quadrant | BADHDUFLAG | Total packets | Discarded packets |
| A | 0 | 102 | 0 |
| B | 0 | 102 | 0 |
| C | 0 | 102 | 0 |
| D | 0 | 102 | 0 |
| Mode M9 | |||
|---|---|---|---|
| Quadrant | BADHDUFLAG | Total packets | Discarded packets |
| A | 0 | 30 | 0 |
| B | 0 | 31 | 0 |
| C | 0 | 31 | 0 |
| D | 0 | 31 | 0 |
| Quadrant | Total seconds | Saturated seconds | Saturation percentage |
|---|---|---|---|
| A | 4953 | 148 | 2.988088% |
| B | 4953 | 17 | 0.343226% |
| C | 4952 | 299 | 6.037964% |
| D | 4952 | 22 | 0.444265% |
Noise dominated data is calculated using 1-second bins in cleaned event files. If a bin has >2000 counts, and if more than 50% of those come from <1% of pixels, then it is considered to be noise-dominated and hence unusable.
| Quadrant | # 1 sec bins | Bins with >0 counts | Bins with >2000 counts | High rate bins dominated by noise | Noise dominated (total time) | Noise dominated (detector-on time) | Marked lightcurve |
|---|---|---|---|---|---|---|---|
| A | 7074 | 4954 | 109 | 109 | 1.54% | 2.20% | 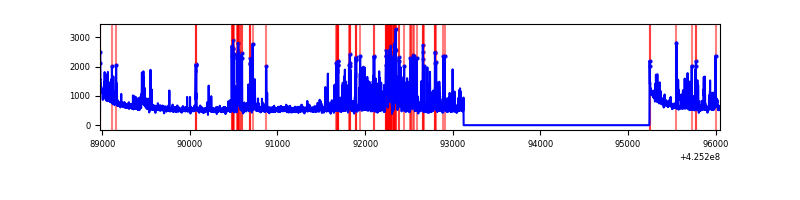 |
| B | 7074 | 4954 | 7 | 7 | 0.10% | 0.14% | 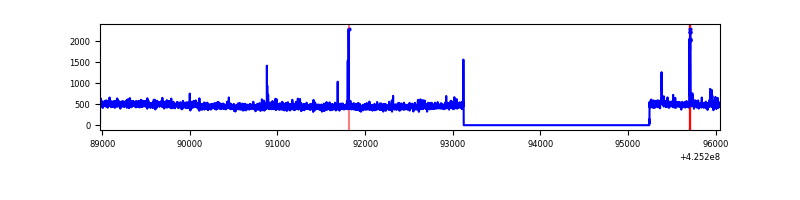 |
| C | 7073 | 4953 | 292 | 292 | 4.13% | 5.90% | 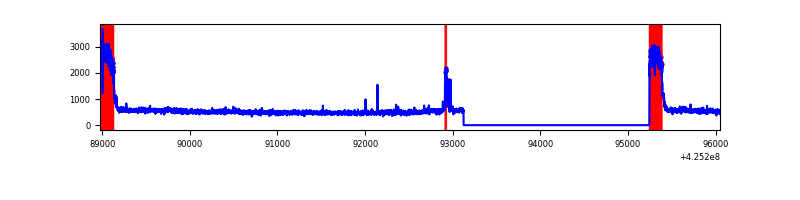 |
| D | 7073 | 4953 | 15 | 15 | 0.21% | 0.30% | 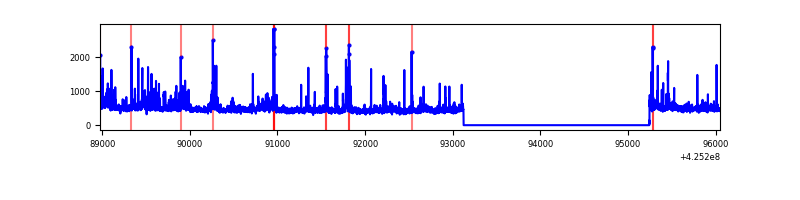 |
Top three noisy pixels from each quadrant. If the there are fewer than three noisy pixels in the level2.evt file, extra rows are filled as -1
| Pixel properties | Quadrant properties | ||||||
|---|---|---|---|---|---|---|---|
| Quadrant | DetID | PixID | Counts | Sigma | Mean | Median | Sigma |
| A | 14 | 24 | 901787 | 7684.36 | 580 | 571 | 117.3 |
| A | 10 | 83 | 511586 | 4357.25 | 580 | 571 | 117.3 |
| A | 13 | 248 | 6948 | 54.37 | 580 | 571 | 117.3 |
| B | 5 | 255 | 23200 | 208.18 | 577 | 561 | 108.7 |
| B | 0 | 183 | 16673 | 148.16 | 577 | 561 | 108.7 |
| B | 12 | 111 | 13347 | 117.58 | 577 | 561 | 108.7 |
| C | 0 | 10 | 872649 | 6934.62 | 541 | 544 | 125.8 |
| C | 15 | 214 | 197865 | 1569.01 | 541 | 544 | 125.8 |
| C | 14 | 254 | 51650 | 406.37 | 541 | 544 | 125.8 |
| D | 13 | 249 | 115081 | 843.75 | 569 | 555 | 135.7 |
| D | 5 | 222 | 105024 | 769.66 | 569 | 555 | 135.7 |
| D | 2 | 249 | 50172 | 365.55 | 569 | 555 | 135.7 |
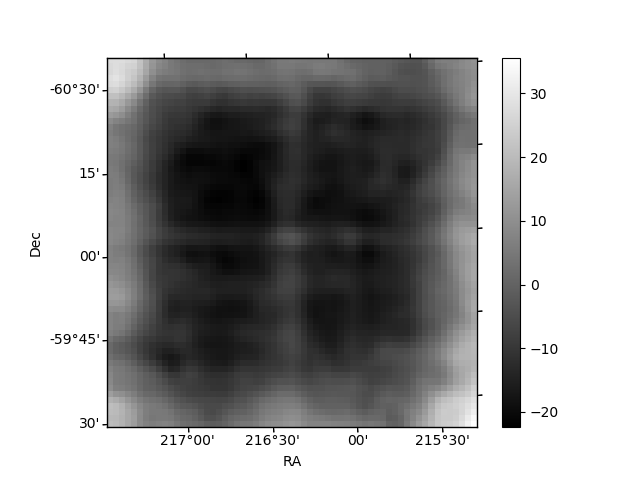
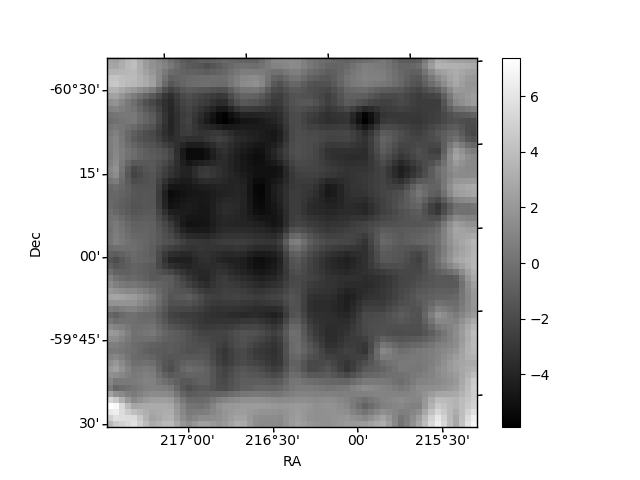
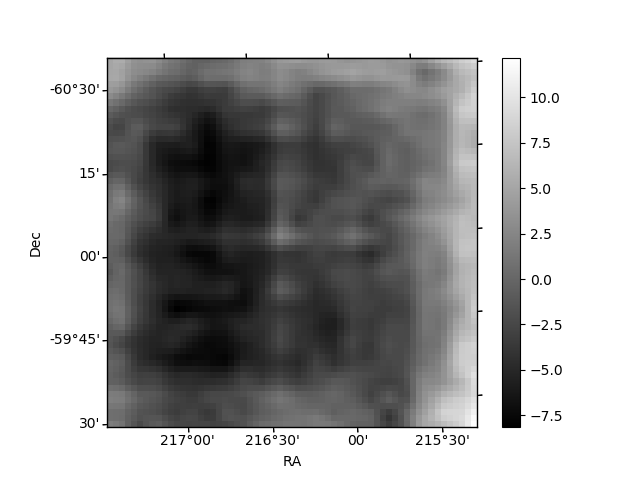
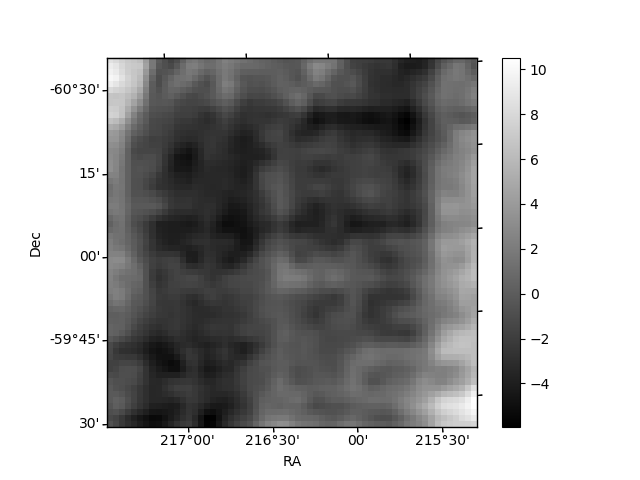
Histogram calculated using DETX and DETY for each event in the final _common_clean file
| Quadrant A | 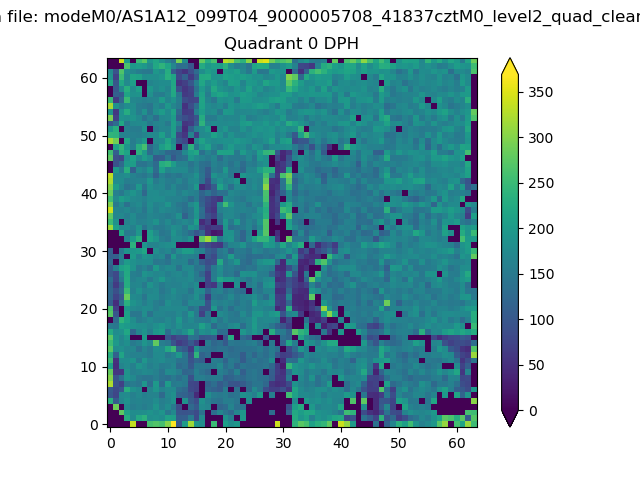 |
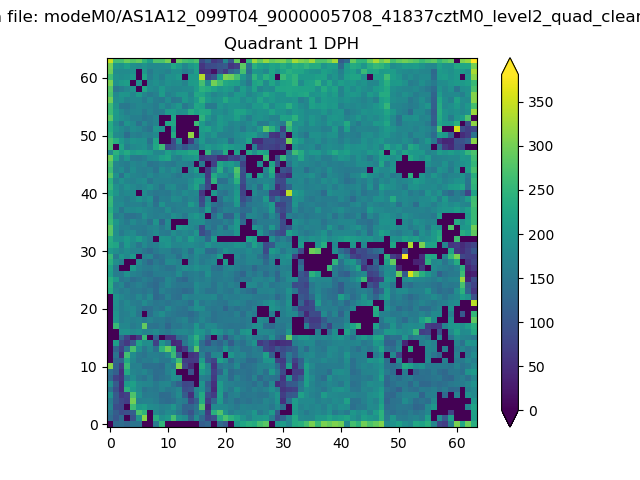 |
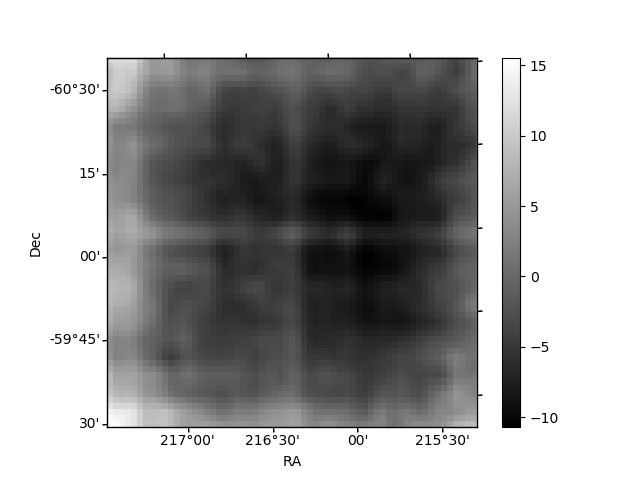
Quadrant B |
|---|---|---|---|
| Quadrant D | 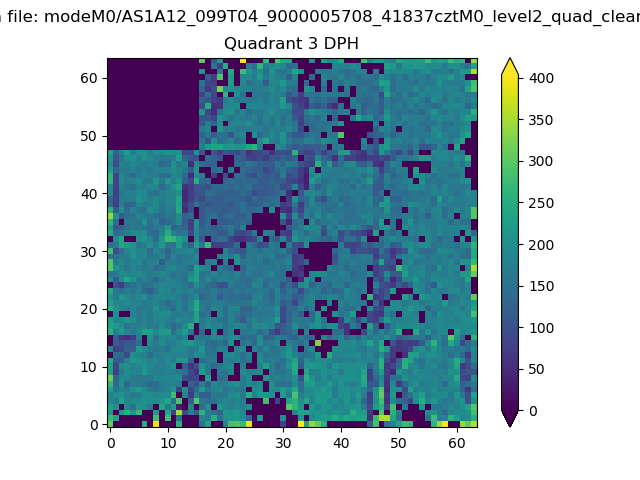 |
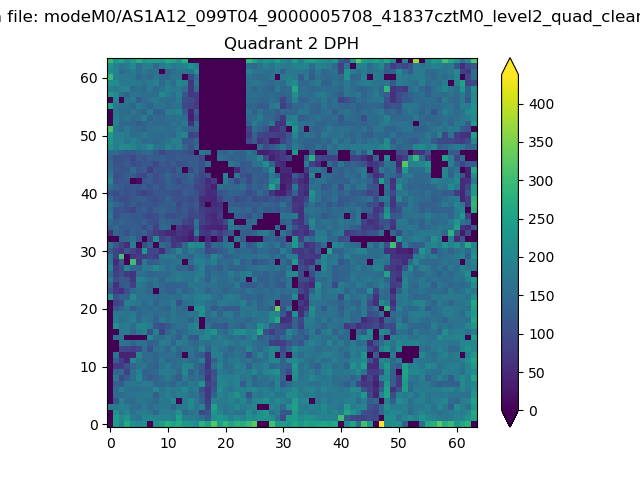 |
Quadrant C |
| Plot type | Count rate plots | Images |
|---|---|---|
| Comparison with Poisson distribution Blue bars denote a histogram of data divided into 1 sec bins. Red curve is a Poisson curve with rate = median count rate of data. |
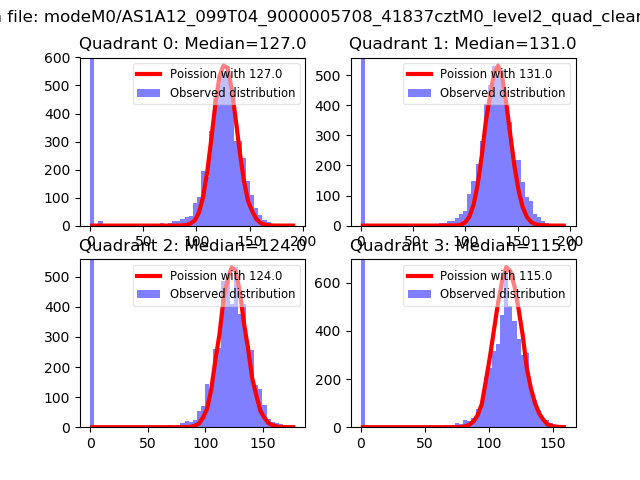 |
 |
| Quadrant-wise count rates Data is divided into 100 sec bins |
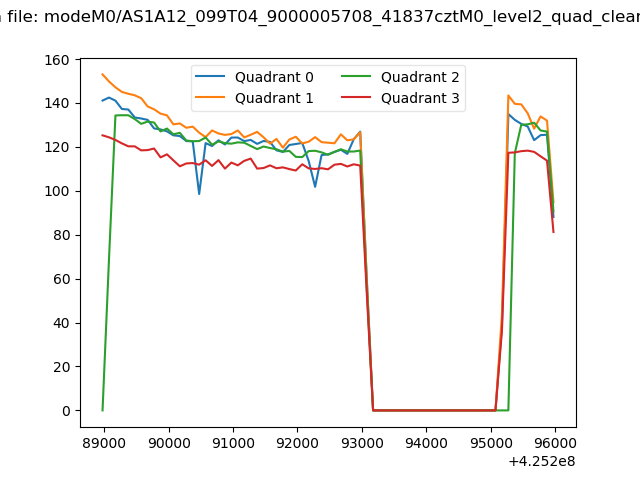 |
|
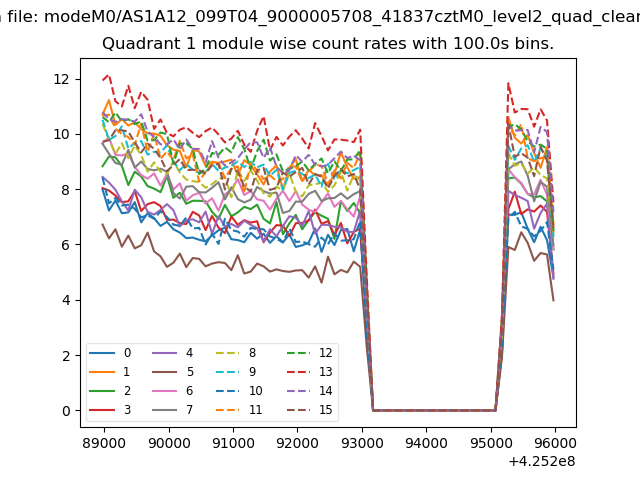
| Module-wise count rates for Quadrant A Data is divided into 100 sec bins |
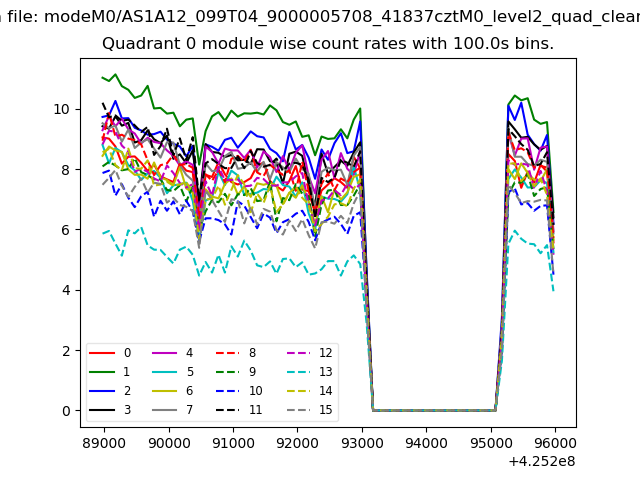 |
 |
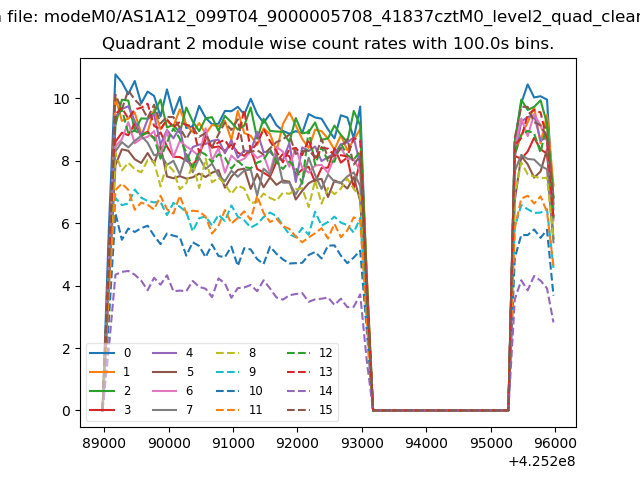
| Module-wise count rates for Quadrant B Data is divided into 100 sec bins |
 |
 |
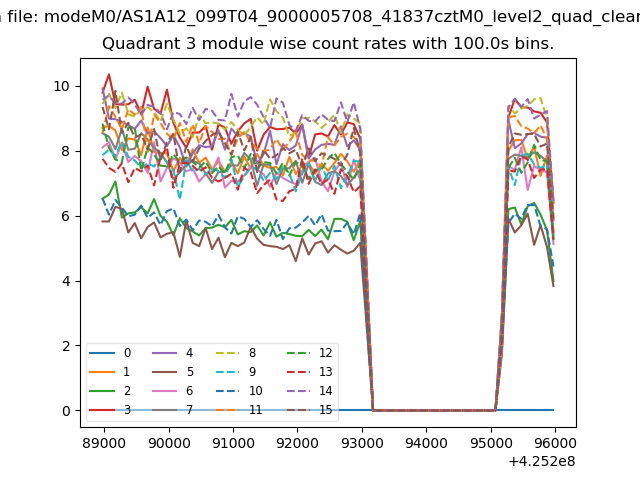
| Module-wise count rates for Quadrant C Data is divided into 100 sec bins |
 |
 |
| Module-wise count rates for Quadrant D Data is divided into 100 sec bins |
 |
 |
| Parameter | Plot |
|---|---|
| CZT HV Monitor | 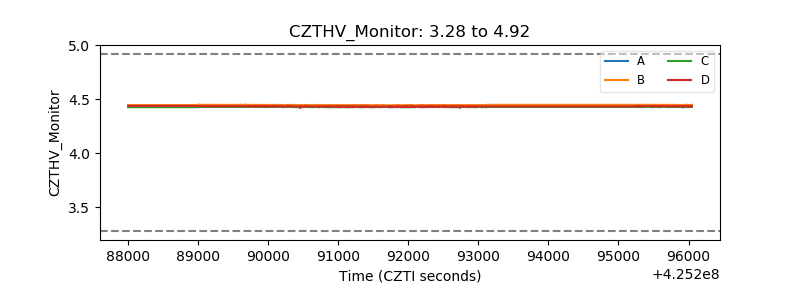 |
| D_VDD |  |
| Temperature 1 | 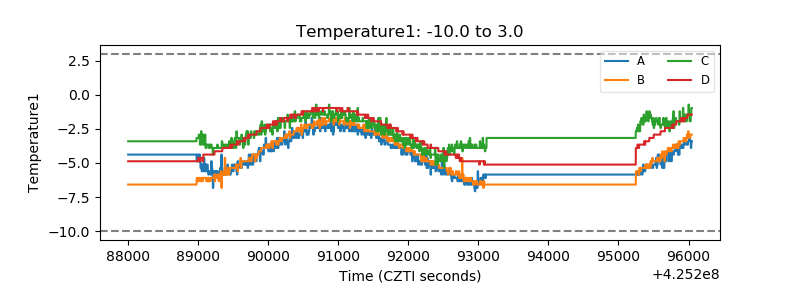 |
| Veto HV Monitor | 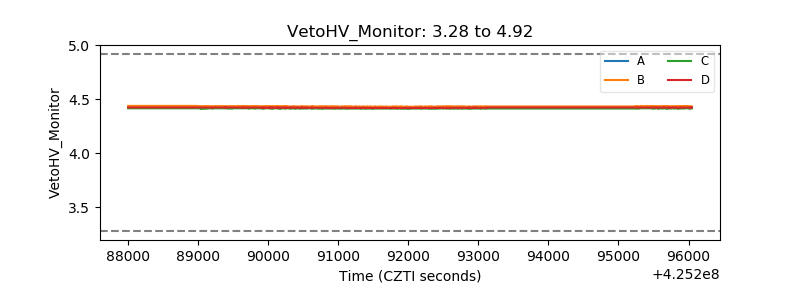 |
| Veto LLD | 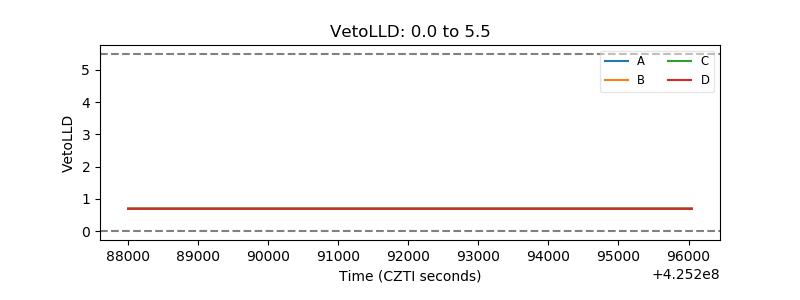 |
| Alpha Counter | 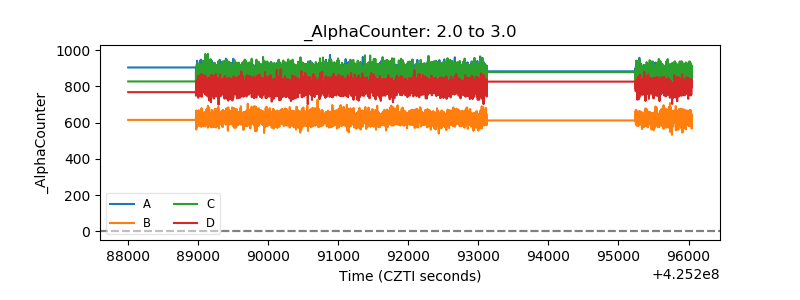 |
| _CPM_Rate | 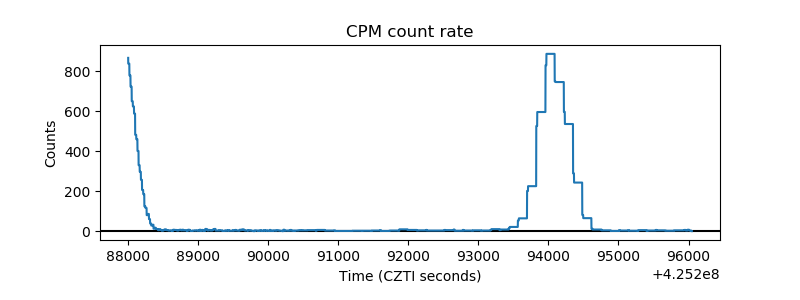 |
| CZT Counter | 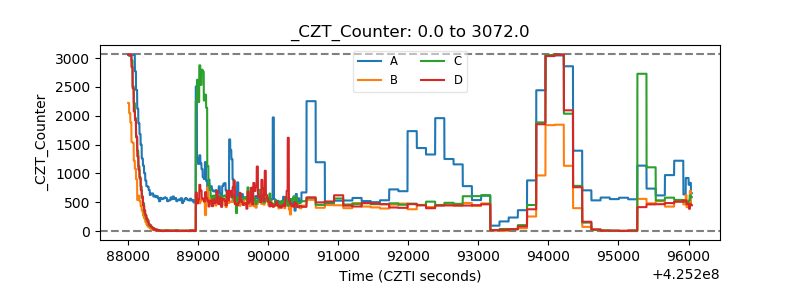 |
| +2.5 Volts monitor | 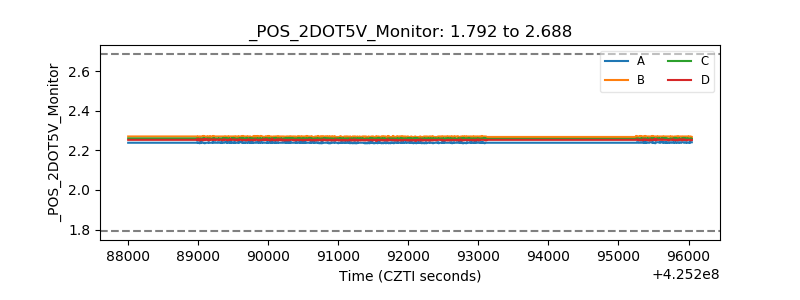 |
| +5 Volts monitor |  |
| _ROLL_ROT | 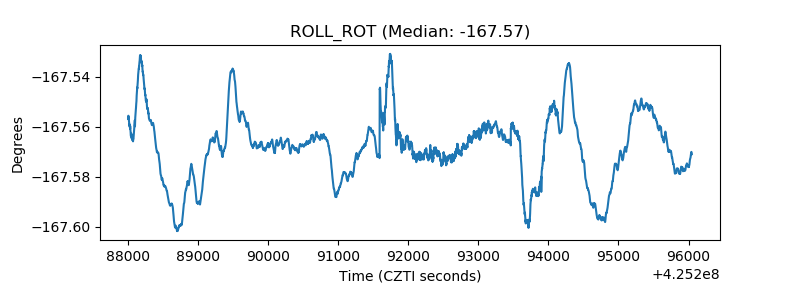 |
| _Roll_DEC | 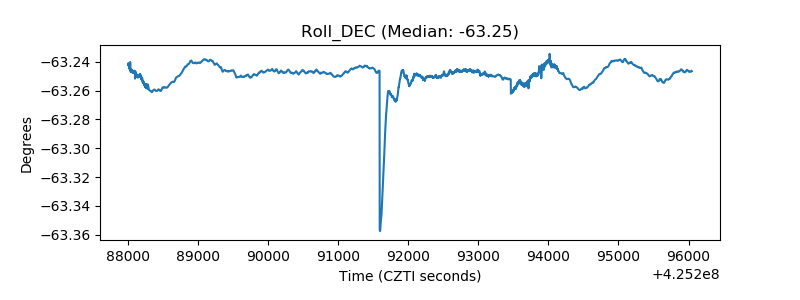 |
| _Roll_RA | 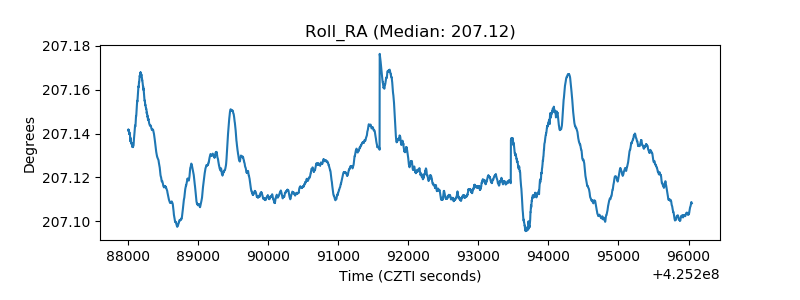 |
| Veto Counter | 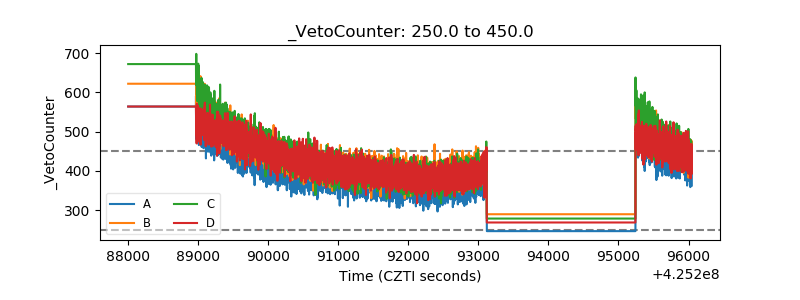 |