| Param | Original file | Final file |
|---|---|---|
| Filename | modeM0/AS1A12_099T04_9000005708_41838cztM0_level2.fits | modeM0/AS1A12_099T04_9000005708_41838cztM0_level2_quad_clean.evt |
| Size (bytes) | 349,300,800 | 84,778,560 |
| Size | 333.1 MB | 80.9 MB |
| Events in quadrant A | 4,412,810 | 552,976 |
| Events in quadrant B | 2,244,713 | 600,288 |
| Events in quadrant C | 2,970,103 | 547,081 |
| Events in quadrant D | 2,925,947 | 527,855 |
| Mode M0 | |||
|---|---|---|---|
| Quadrant | BADHDUFLAG | Total packets | Discarded packets |
| A | 0 | 16359 | 2 |
| B | 0 | 9902 | 2 |
| C | 0 | 11609 | 2 |
| D | 0 | 12032 | 2 |
| Mode SS | |||
|---|---|---|---|
| Quadrant | BADHDUFLAG | Total packets | Discarded packets |
| A | 0 | 98 | 0 |
| B | 0 | 98 | 0 |
| C | 0 | 98 | 0 |
| D | 0 | 98 | 0 |
| Mode M9 | |||
|---|---|---|---|
| Quadrant | BADHDUFLAG | Total packets | Discarded packets |
| A | 0 | 22 | 0 |
| B | 0 | 22 | 0 |
| C | 0 | 22 | 0 |
| D | 0 | 22 | 0 |
| Quadrant | Total seconds | Saturated seconds | Saturation percentage |
|---|---|---|---|
| A | 4832 | 395 | 8.174669% |
| B | 4832 | 18 | 0.372517% |
| C | 4833 | 240 | 4.965860% |
| D | 4833 | 69 | 1.427685% |
Noise dominated data is calculated using 1-second bins in cleaned event files. If a bin has >2000 counts, and if more than 50% of those come from <1% of pixels, then it is considered to be noise-dominated and hence unusable.
| Quadrant | # 1 sec bins | Bins with >0 counts | Bins with >2000 counts | High rate bins dominated by noise | Noise dominated (total time) | Noise dominated (detector-on time) | Marked lightcurve |
|---|---|---|---|---|---|---|---|
| A | 6985 | 4833 | 368 | 368 | 5.27% | 7.61% | 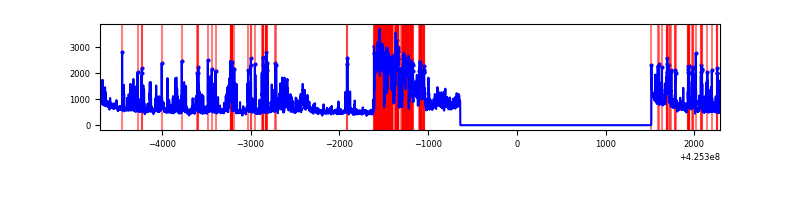 |
| B | 6985 | 4833 | 7 | 7 | 0.10% | 0.14% | 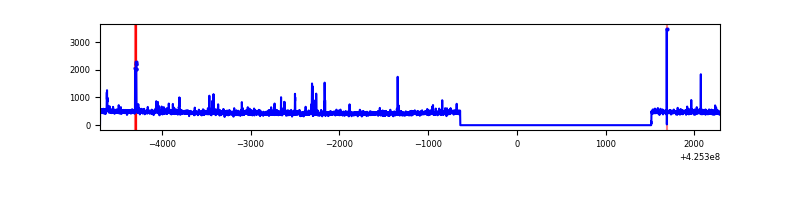 |
| C | 6986 | 4834 | 227 | 227 | 3.25% | 4.70% |  |
| D | 6986 | 4834 | 72 | 72 | 1.03% | 1.49% | 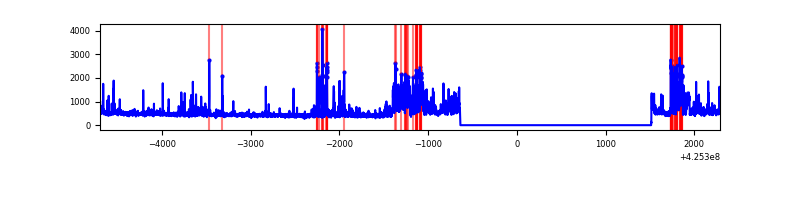 |
Top three noisy pixels from each quadrant. If the there are fewer than three noisy pixels in the level2.evt file, extra rows are filled as -1
| Pixel properties | Quadrant properties | ||||||
|---|---|---|---|---|---|---|---|
| Quadrant | DetID | PixID | Counts | Sigma | Mean | Median | Sigma |
| A | 14 | 24 | 1827762 | 16729.46 | 534 | 523 | 109.2 |
| A | 10 | 83 | 466775 | 4268.81 | 534 | 523 | 109.2 |
| A | 2 | 79 | 40846 | 369.18 | 534 | 523 | 109.2 |
| B | 5 | 255 | 30432 | 288.27 | 545 | 530 | 103.7 |
| B | 3 | 112 | 27013 | 255.31 | 545 | 530 | 103.7 |
| B | 0 | 183 | 17221 | 160.91 | 545 | 530 | 103.7 |
| C | 0 | 10 | 768977 | 6460.87 | 512 | 515 | 118.9 |
| C | 15 | 214 | 192524 | 1614.32 | 512 | 515 | 118.9 |
| C | 14 | 254 | 11291 | 90.6 | 512 | 515 | 118.9 |
| D | 12 | 79 | 476321 | 3725.63 | 532 | 519 | 127.7 |
| D | 13 | 249 | 152444 | 1189.6 | 532 | 519 | 127.7 |
| D | 12 | 233 | 67658 | 525.71 | 532 | 519 | 127.7 |
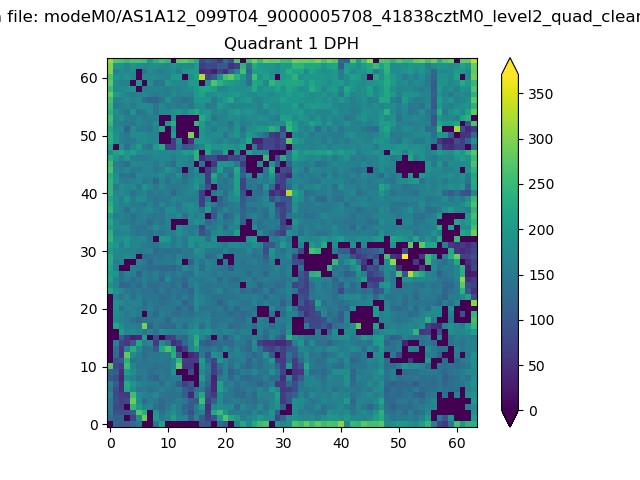
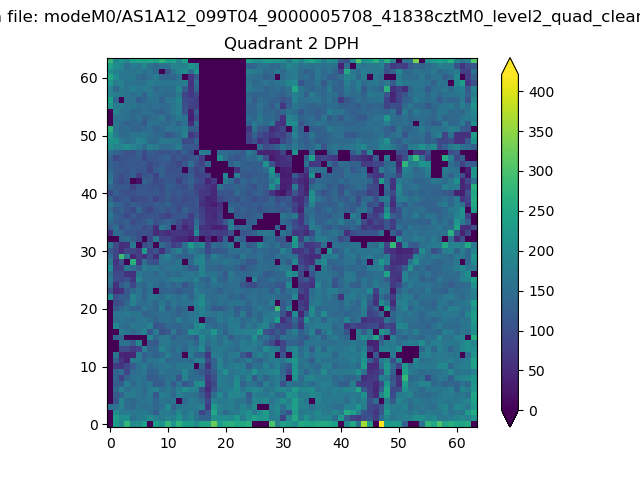
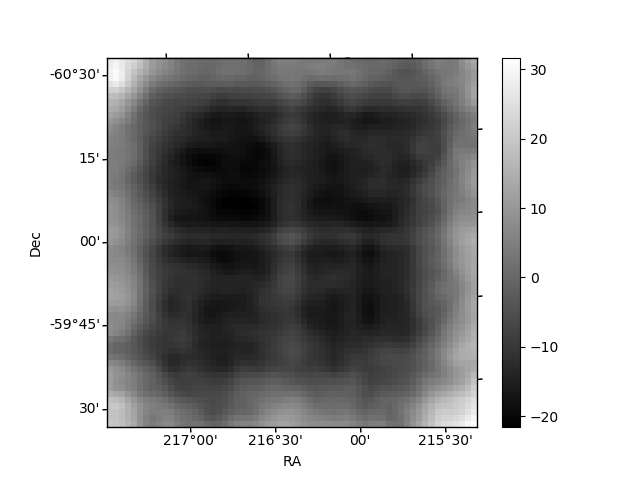
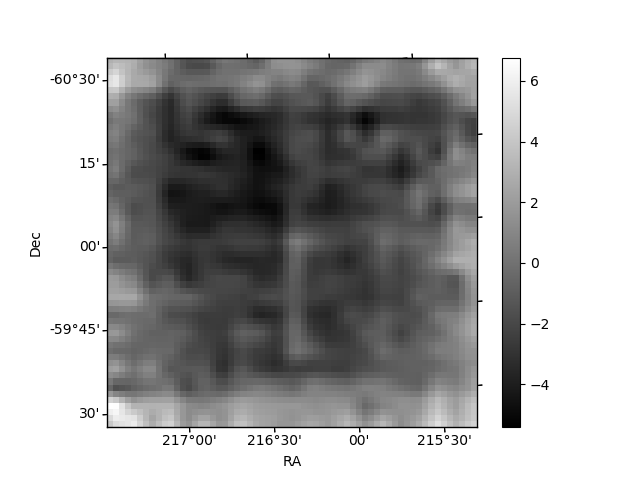
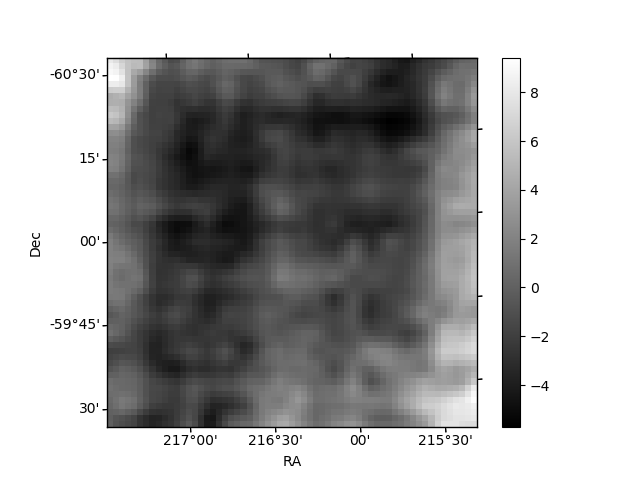
Histogram calculated using DETX and DETY for each event in the final _common_clean file
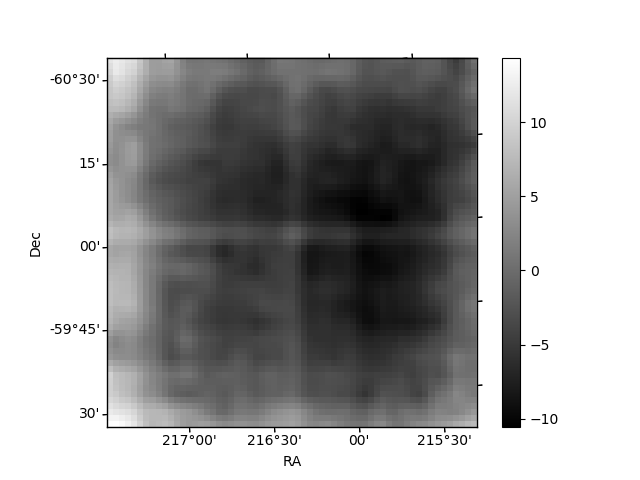
| Quadrant A | 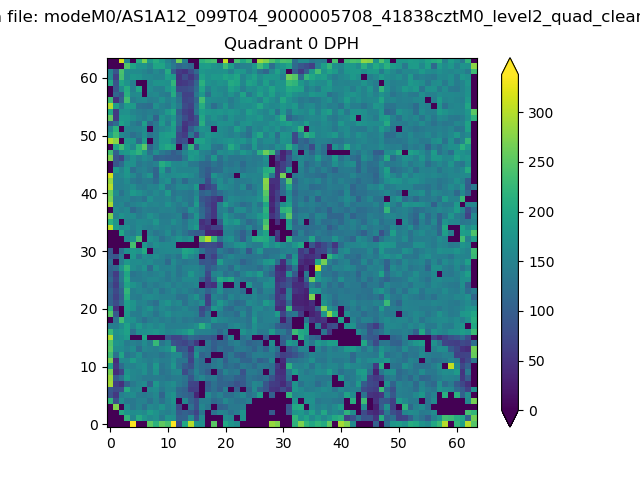 |
 |
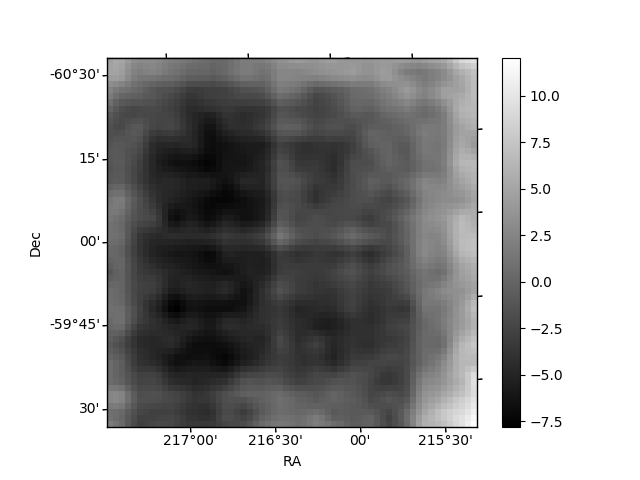
Quadrant B |
|---|---|---|---|
| Quadrant D | 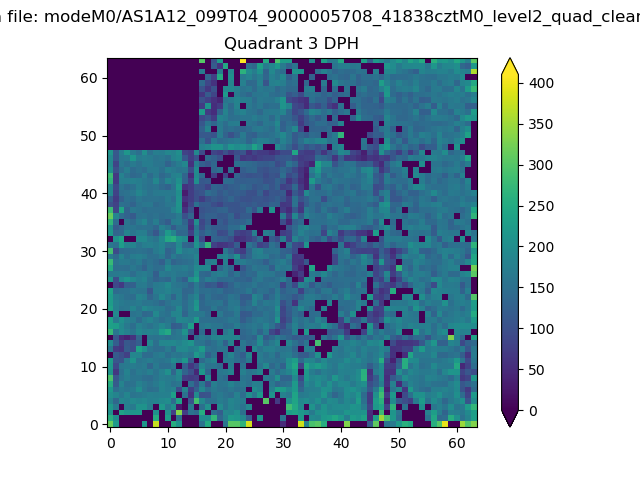 |
 |
Quadrant C |
| Plot type | Count rate plots | Images |
|---|---|---|
| Comparison with Poisson distribution Blue bars denote a histogram of data divided into 1 sec bins. Red curve is a Poisson curve with rate = median count rate of data. |
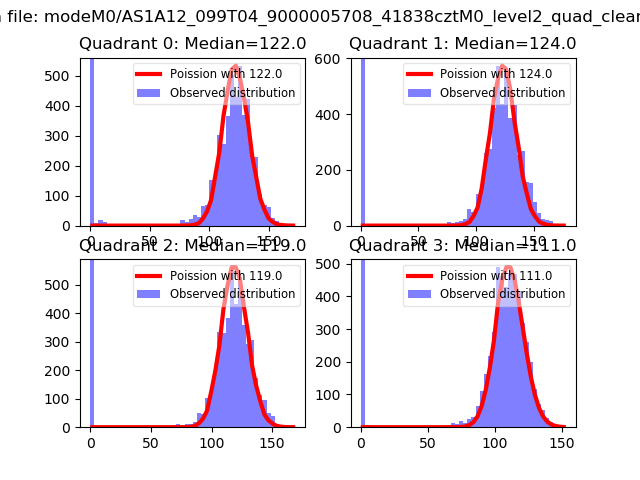 |
 |
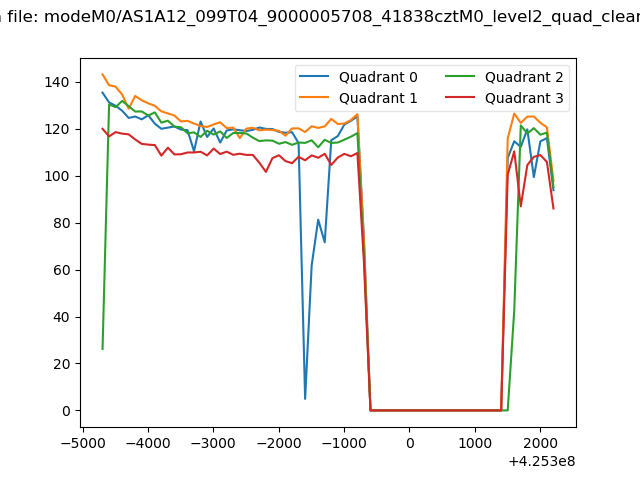
| Quadrant-wise count rates Data is divided into 100 sec bins |
 |
|
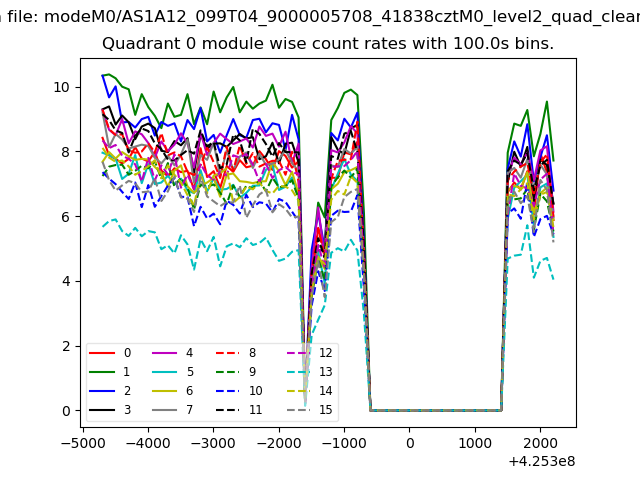
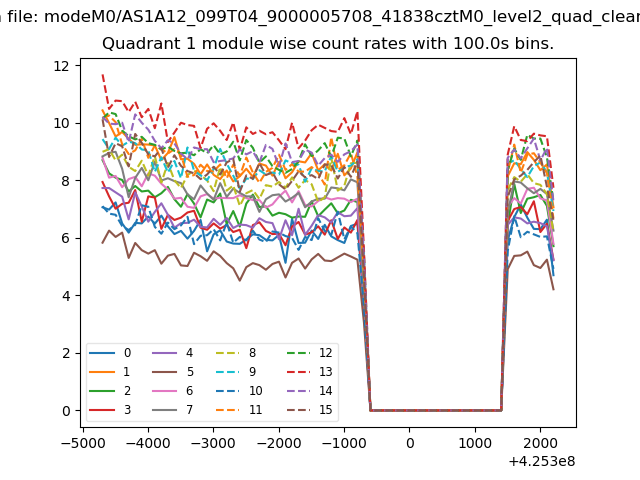
| Module-wise count rates for Quadrant A Data is divided into 100 sec bins |
 |
 |
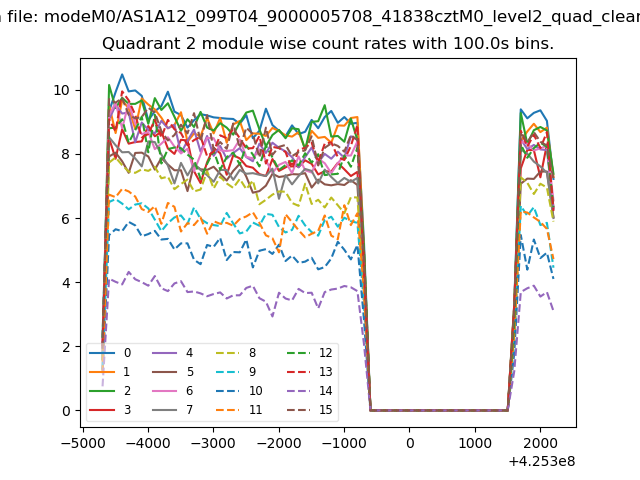
| Module-wise count rates for Quadrant B Data is divided into 100 sec bins |
 |
 |
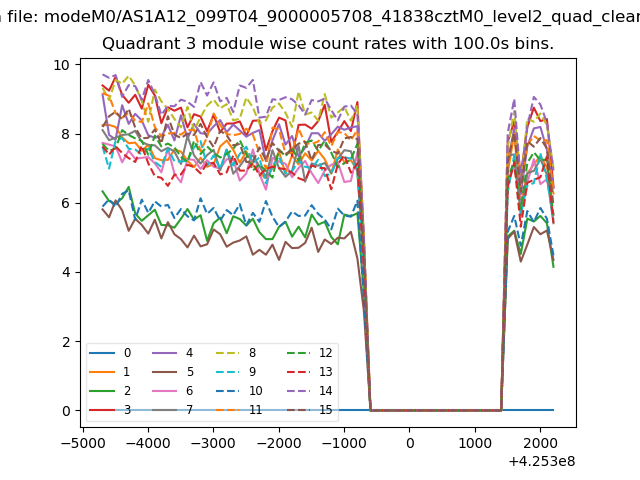
| Module-wise count rates for Quadrant C Data is divided into 100 sec bins |
 |
 |
| Module-wise count rates for Quadrant D Data is divided into 100 sec bins |
 |
 |
| Parameter | Plot |
|---|---|
| CZT HV Monitor | 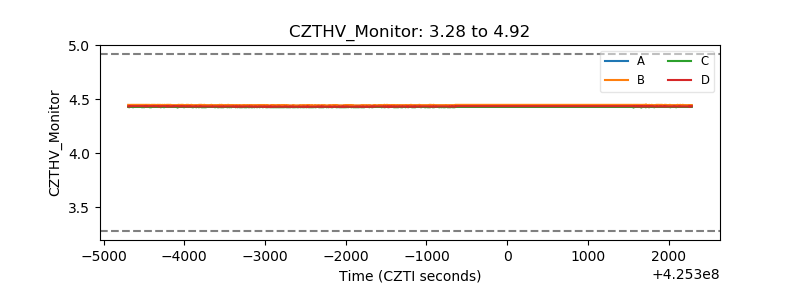 |
| D_VDD | 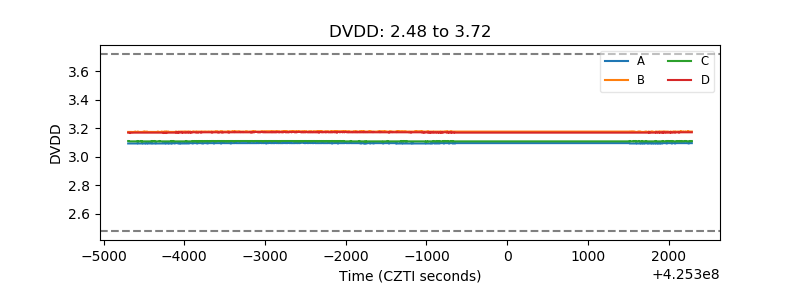 |
| Temperature 1 | 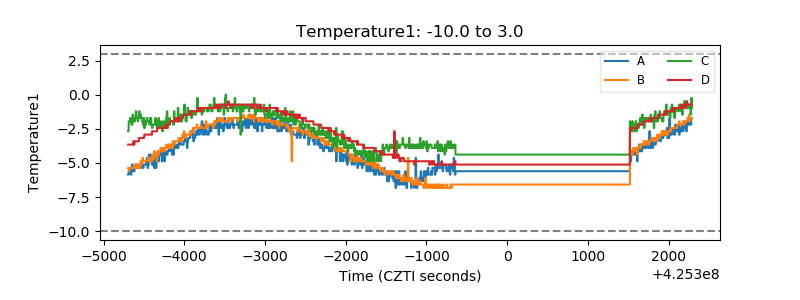 |
| Veto HV Monitor | 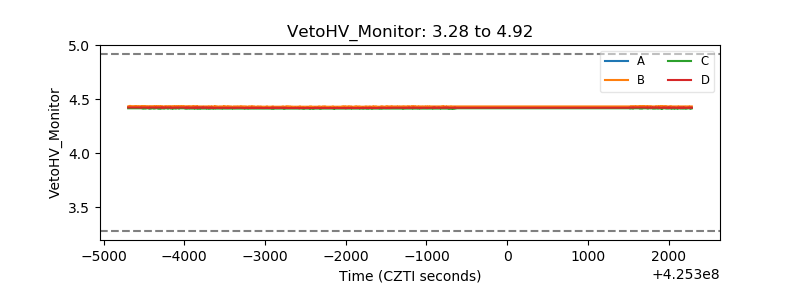 |
| Veto LLD | 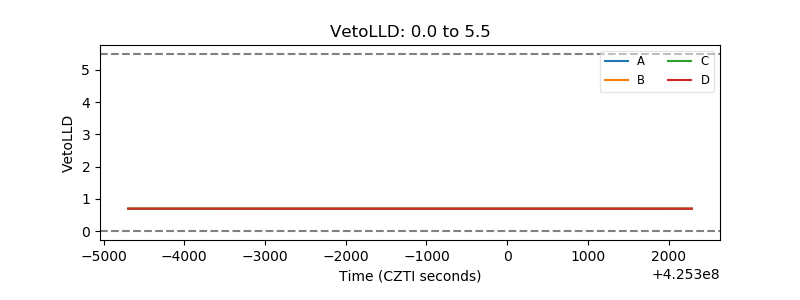 |
| Alpha Counter | 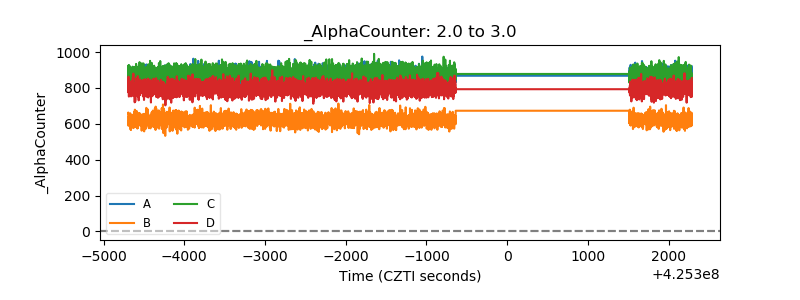 |
| _CPM_Rate | 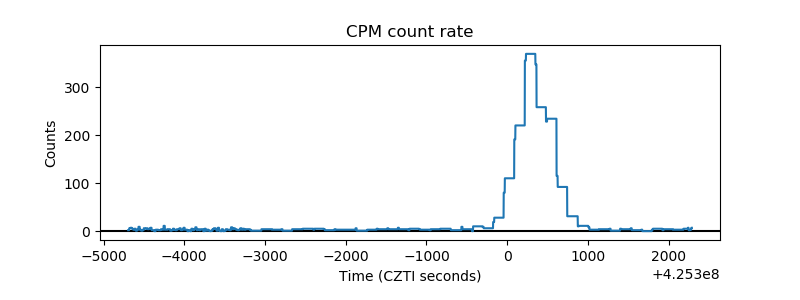 |
| CZT Counter | 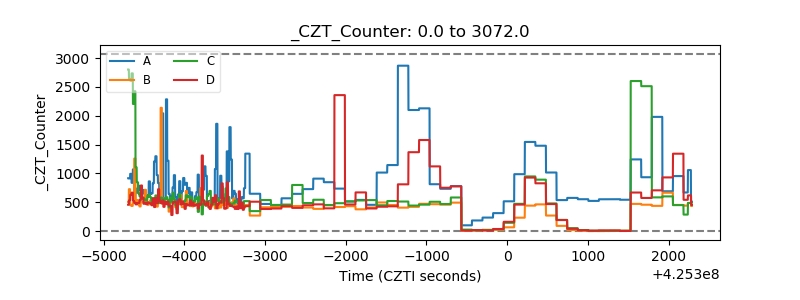 |
| +2.5 Volts monitor | 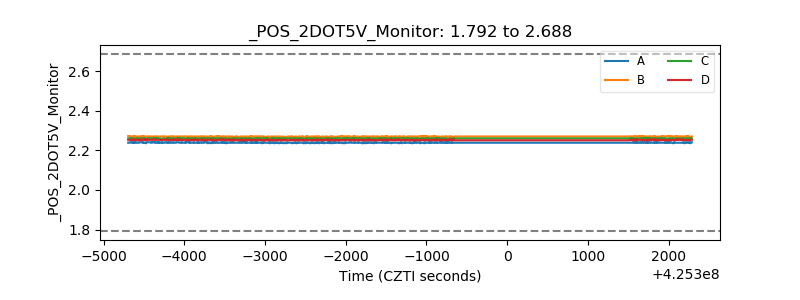 |
| +5 Volts monitor | 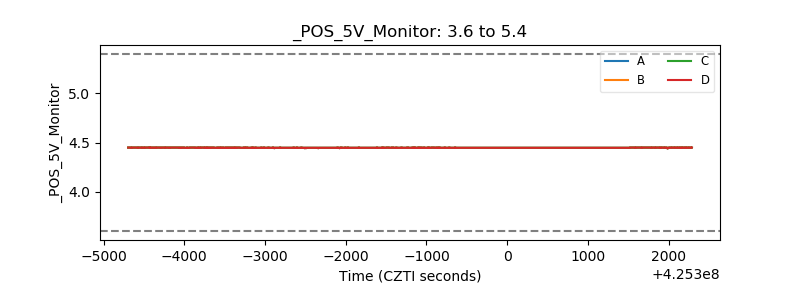 |
| _ROLL_ROT | 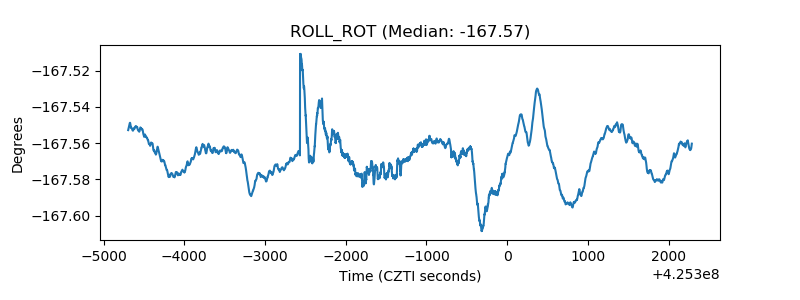 |
| _Roll_DEC |  |
| _Roll_RA | 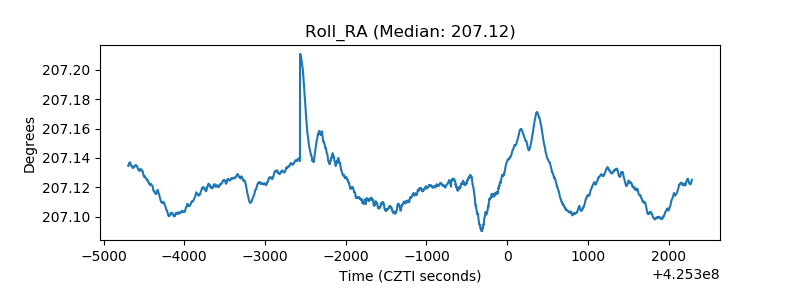 |
| Veto Counter | 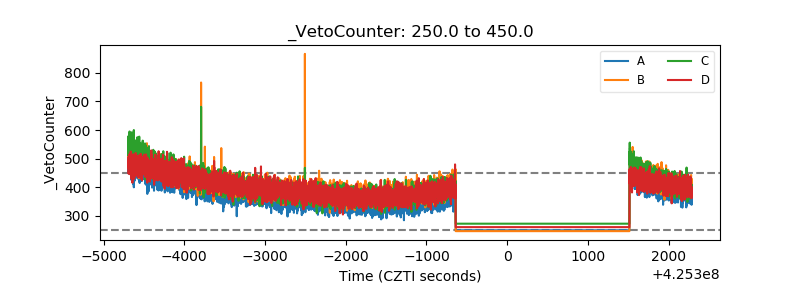 |