| Param | Original file | Final file |
|---|---|---|
| Filename | modeM0/AS1A12_099T04_9000005708_41839cztM0_level2.fits | modeM0/AS1A12_099T04_9000005708_41839cztM0_level2_quad_clean.evt |
| Size (bytes) | 406,572,480 | 86,181,120 |
| Size | 387.7 MB | 82.2 MB |
| Events in quadrant A | 5,513,103 | 521,949 |
| Events in quadrant B | 2,361,303 | 618,661 |
| Events in quadrant C | 3,629,228 | 555,582 |
| Events in quadrant D | 3,134,673 | 543,196 |
| Mode M0 | |||
|---|---|---|---|
| Quadrant | BADHDUFLAG | Total packets | Discarded packets |
| A | 0 | 19861 | 2 |
| B | 0 | 10737 | 2 |
| C | 0 | 14024 | 2 |
| D | 0 | 13041 | 2 |
| Mode SS | |||
|---|---|---|---|
| Quadrant | BADHDUFLAG | Total packets | Discarded packets |
| A | 0 | 108 | 0 |
| B | 0 | 108 | 0 |
| C | 0 | 108 | 0 |
| D | 0 | 108 | 0 |
| Mode M9 | |||
|---|---|---|---|
| Quadrant | BADHDUFLAG | Total packets | Discarded packets |
| A | 0 | 22 | 0 |
| B | 0 | 22 | 0 |
| C | 0 | 23 | 0 |
| D | 0 | 23 | 0 |
| Quadrant | Total seconds | Saturated seconds | Saturation percentage |
|---|---|---|---|
| A | 5286 | 906 | 17.139614% |
| B | 5286 | 8 | 0.151343% |
| C | 5286 | 330 | 6.242906% |
| D | 5286 | 135 | 2.553916% |
Noise dominated data is calculated using 1-second bins in cleaned event files. If a bin has >2000 counts, and if more than 50% of those come from <1% of pixels, then it is considered to be noise-dominated and hence unusable.
| Quadrant | # 1 sec bins | Bins with >0 counts | Bins with >2000 counts | High rate bins dominated by noise | Noise dominated (total time) | Noise dominated (detector-on time) | Marked lightcurve |
|---|---|---|---|---|---|---|---|
| A | 7350 | 5287 | 797 | 797 | 10.84% | 15.07% | 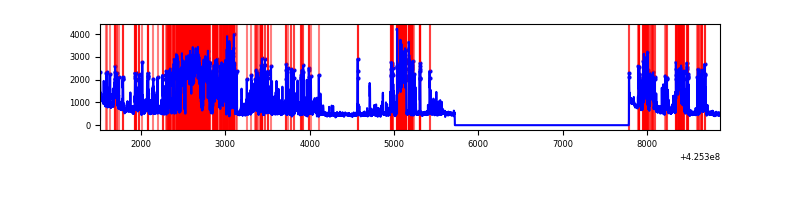 |
| B | 7350 | 5287 | 1 | 1 | 0.01% | 0.02% | 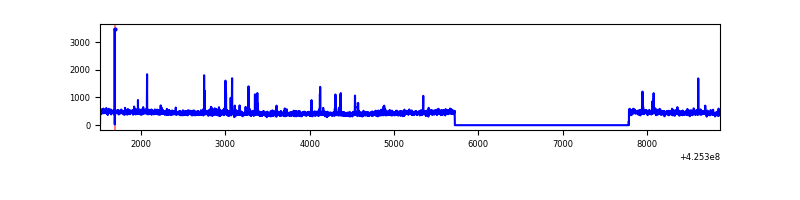 |
| C | 7350 | 5287 | 328 | 328 | 4.46% | 6.20% | 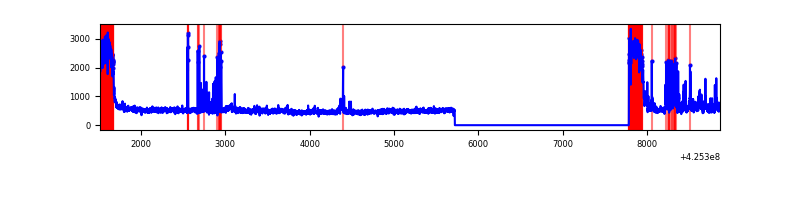 |
| D | 7350 | 5287 | 107 | 107 | 1.46% | 2.02% | 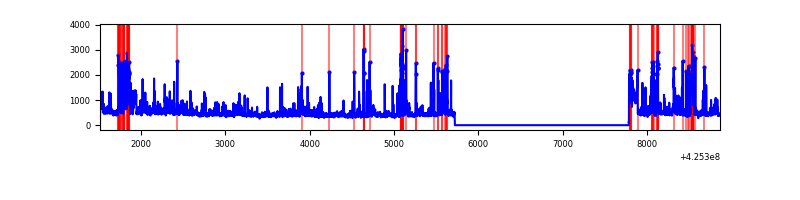 |
Top three noisy pixels from each quadrant. If the there are fewer than three noisy pixels in the level2.evt file, extra rows are filled as -1
| Pixel properties | Quadrant properties | ||||||
|---|---|---|---|---|---|---|---|
| Quadrant | DetID | PixID | Counts | Sigma | Mean | Median | Sigma |
| A | 14 | 24 | 2881382 | 26007.64 | 535 | 525 | 110.8 |
| A | 10 | 83 | 527968 | 4761.62 | 535 | 525 | 110.8 |
| A | 2 | 79 | 29208 | 258.94 | 535 | 525 | 110.8 |
| B | 0 | 183 | 40879 | 370.13 | 572 | 558 | 108.9 |
| B | 0 | 186 | 27941 | 251.36 | 572 | 558 | 108.9 |
| B | 15 | 35 | 23720 | 212.62 | 572 | 558 | 108.9 |
| C | 0 | 10 | 997048 | 8099.97 | 529 | 532 | 123.0 |
| C | 14 | 254 | 354043 | 2873.44 | 529 | 532 | 123.0 |
| C | 15 | 214 | 207049 | 1678.63 | 529 | 532 | 123.0 |
| D | 13 | 249 | 431966 | 3181.49 | 557 | 541 | 135.6 |
| D | 12 | 79 | 158229 | 1162.85 | 557 | 541 | 135.6 |
| D | 2 | 120 | 83875 | 614.54 | 557 | 541 | 135.6 |
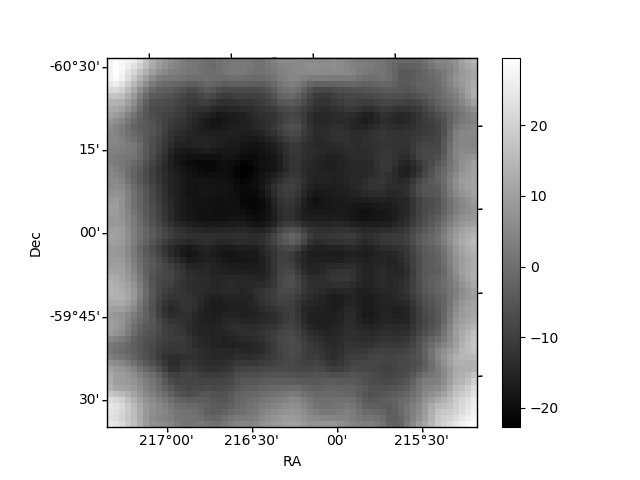
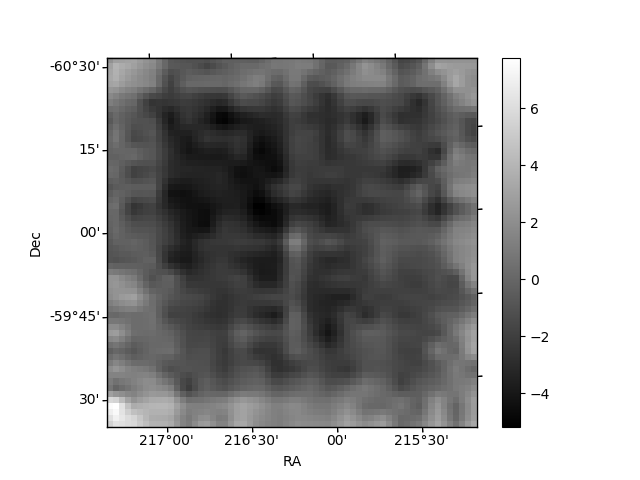
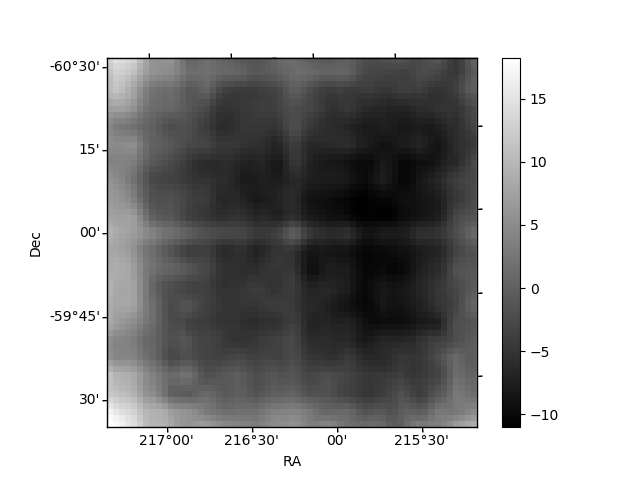
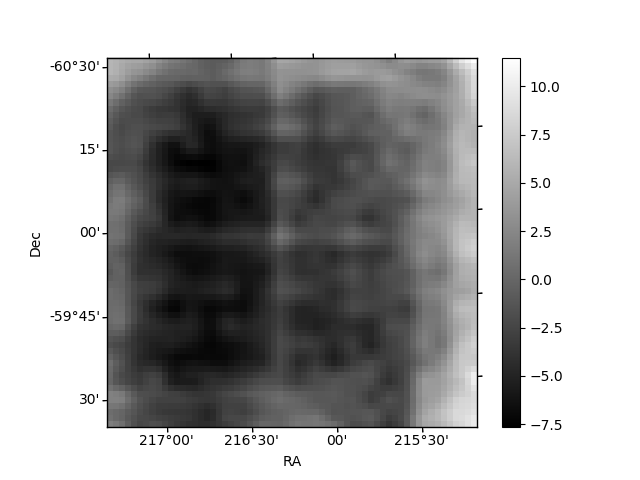
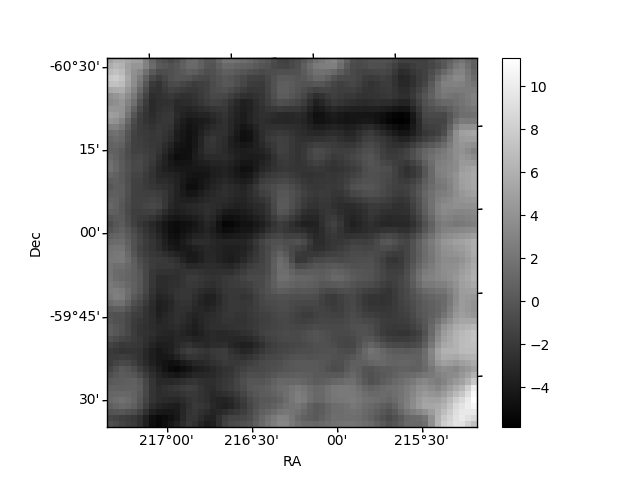
Histogram calculated using DETX and DETY for each event in the final _common_clean file
| Quadrant A | 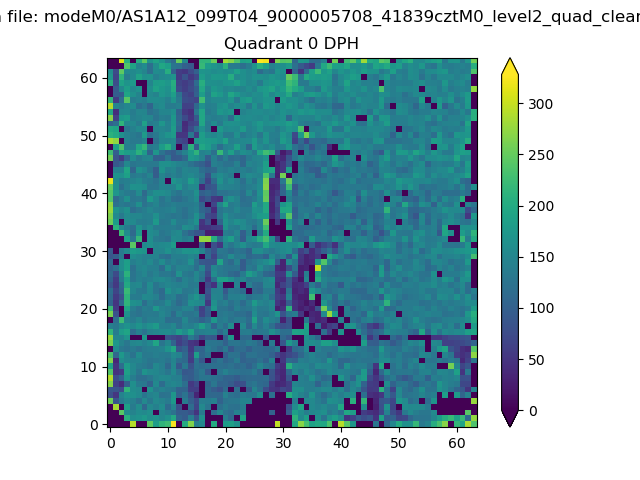 |
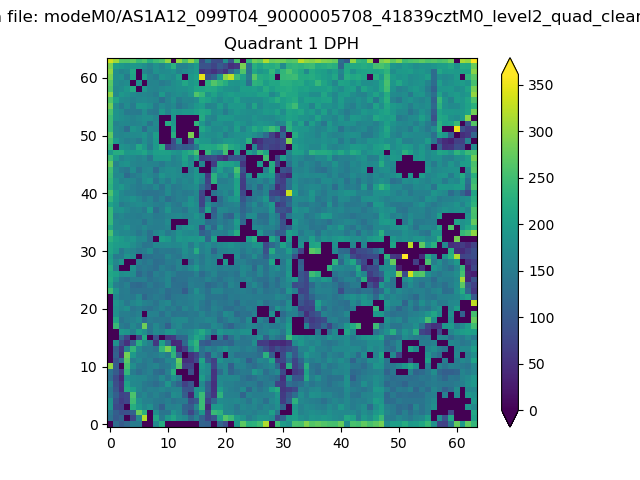 |
Quadrant B |
|---|---|---|---|
| Quadrant D | 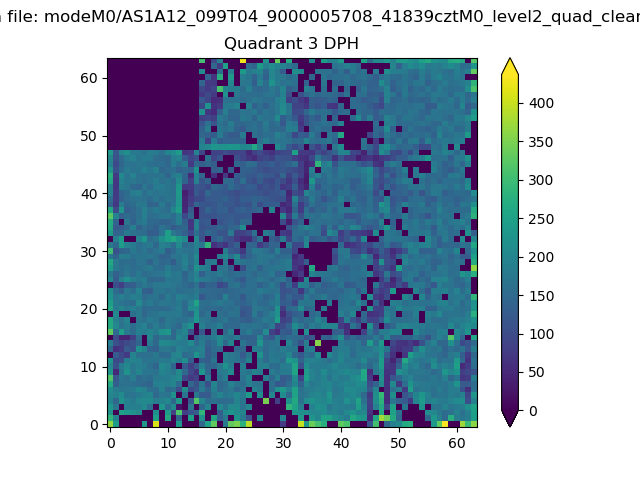 |
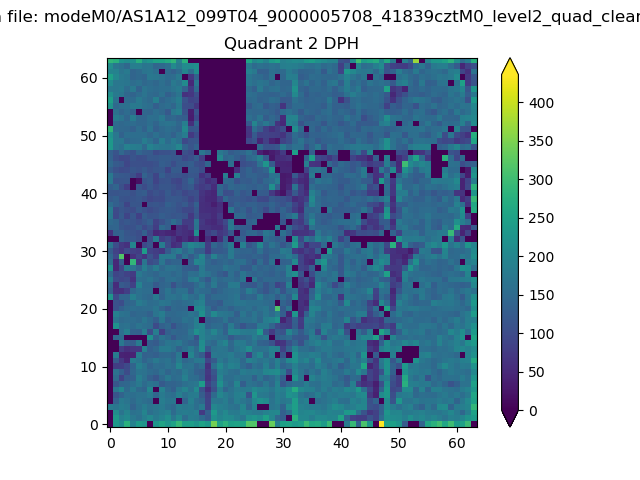 |
Quadrant C |
| Plot type | Count rate plots | Images |
|---|---|---|
| Comparison with Poisson distribution Blue bars denote a histogram of data divided into 1 sec bins. Red curve is a Poisson curve with rate = median count rate of data. |
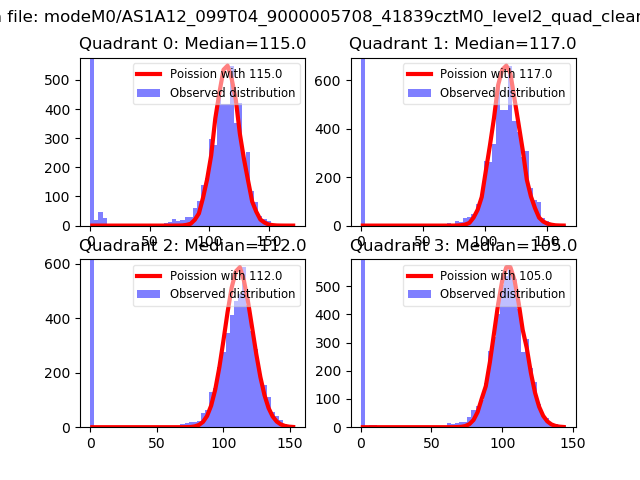 |
 |
| Quadrant-wise count rates Data is divided into 100 sec bins |
 |
|
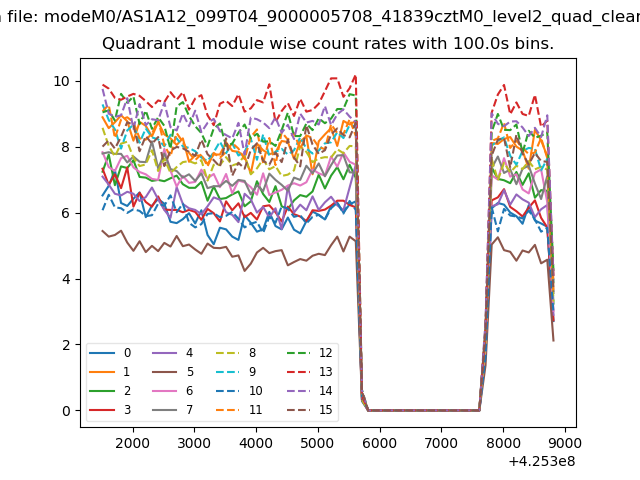
| Module-wise count rates for Quadrant A Data is divided into 100 sec bins |
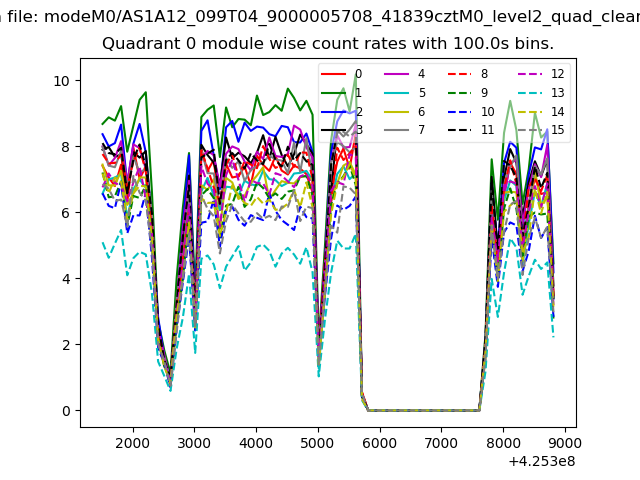 |
 |
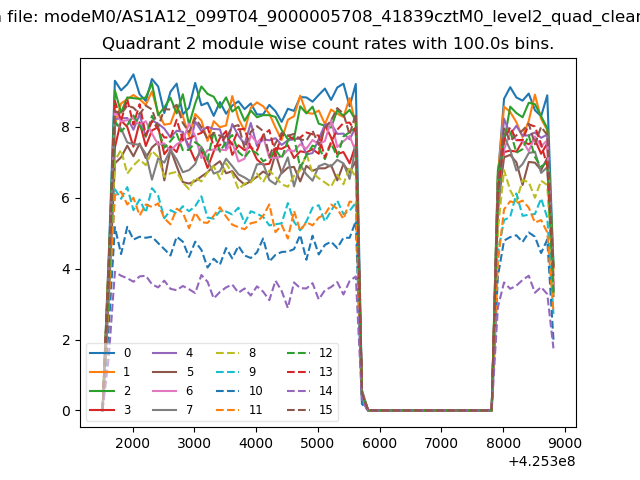
| Module-wise count rates for Quadrant B Data is divided into 100 sec bins |
 |
 |
| Module-wise count rates for Quadrant C Data is divided into 100 sec bins |
 |
 |
| Module-wise count rates for Quadrant D Data is divided into 100 sec bins |
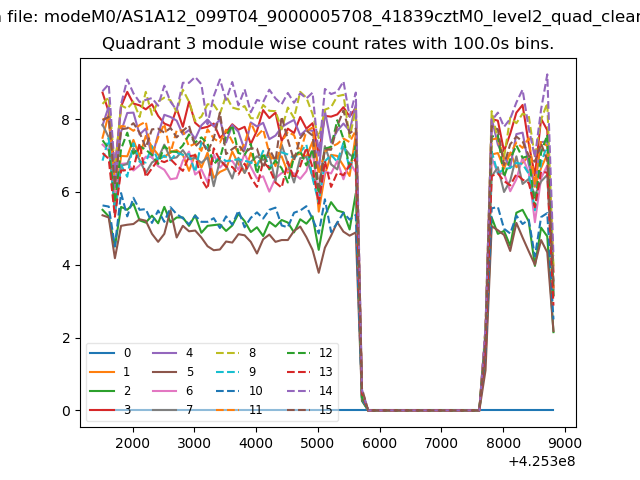 |
 |
| Parameter | Plot |
|---|---|
| CZT HV Monitor | 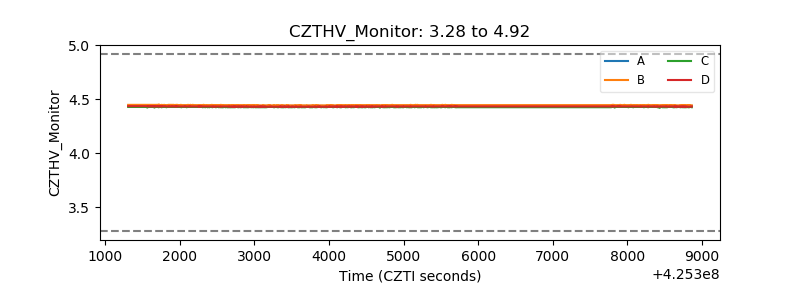 |
| D_VDD | 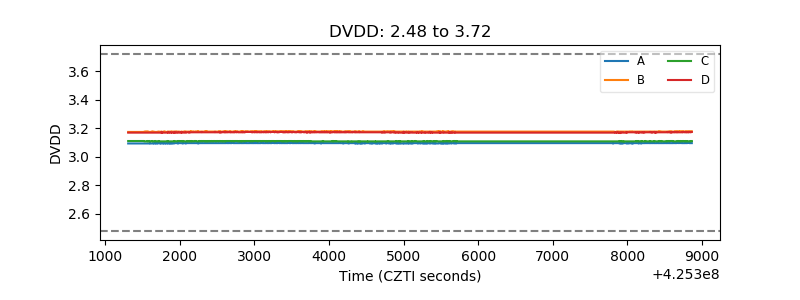 |
| Temperature 1 | 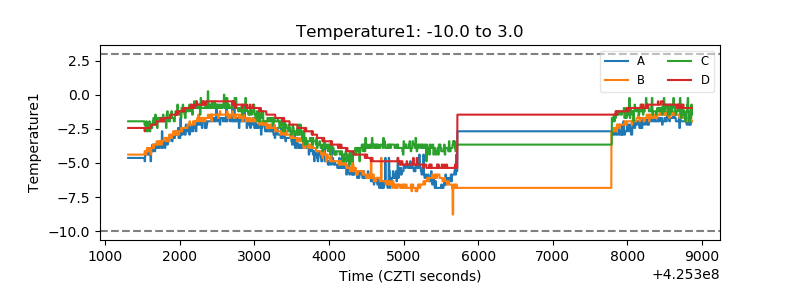 |
| Veto HV Monitor | 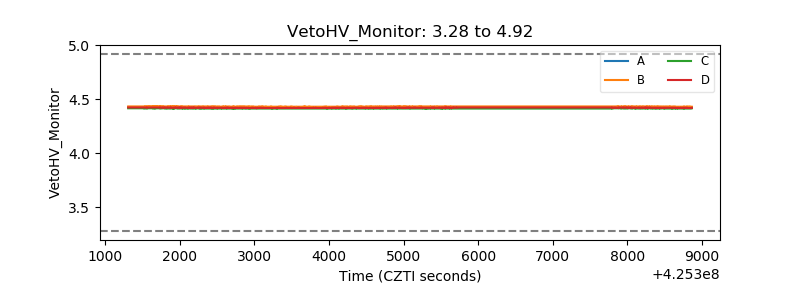 |
| Veto LLD | 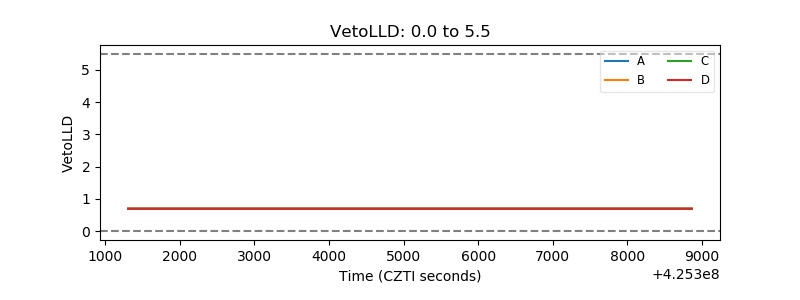 |
| Alpha Counter | 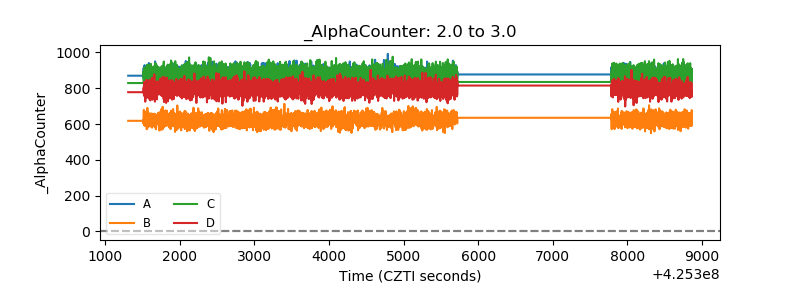 |
| _CPM_Rate | 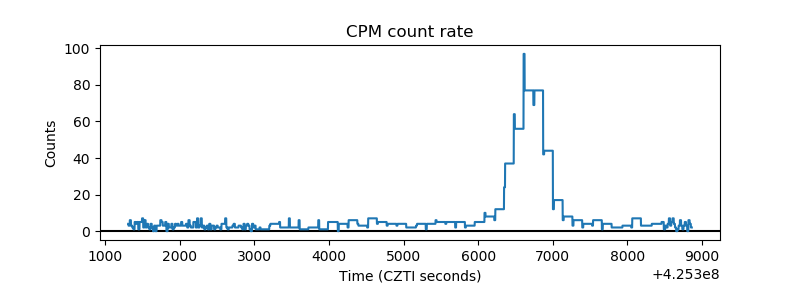 |
| CZT Counter | 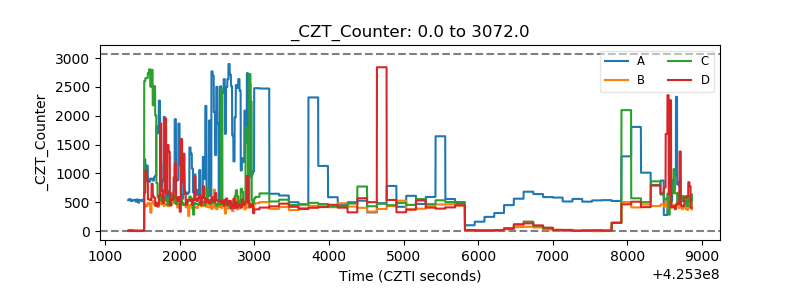 |
| +2.5 Volts monitor | 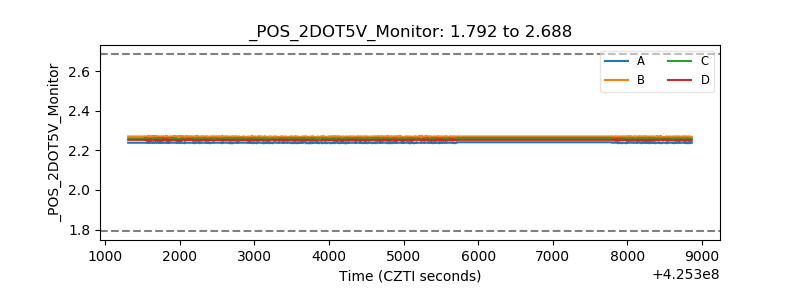 |
| +5 Volts monitor | 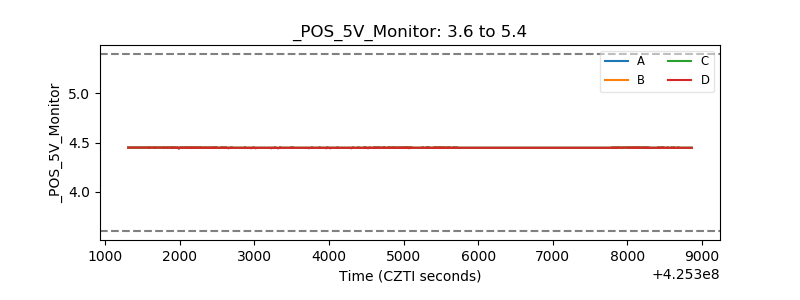 |
| _ROLL_ROT | 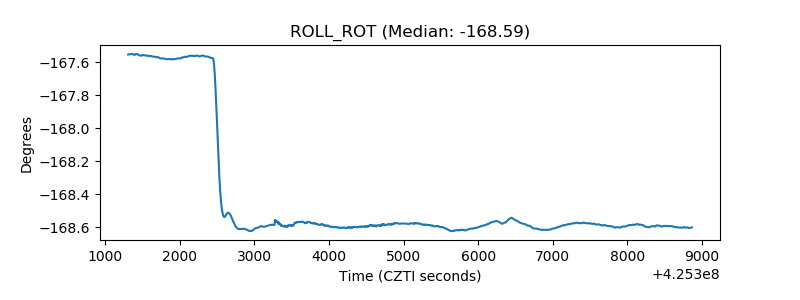 |
| _Roll_DEC | 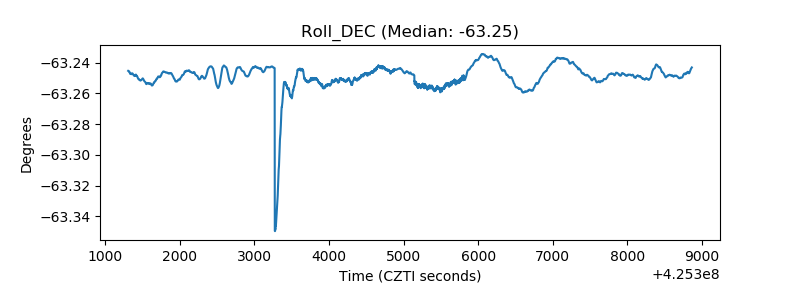 |
| _Roll_RA | 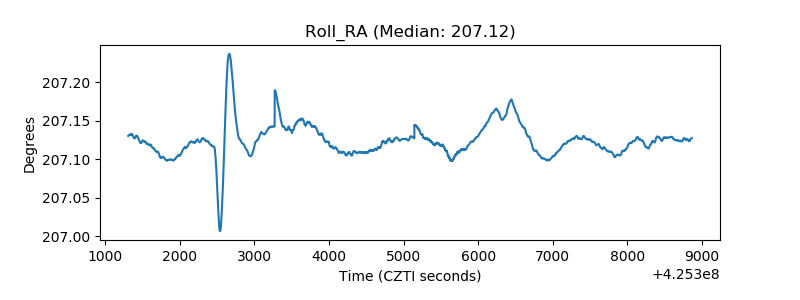 |
| Veto Counter | 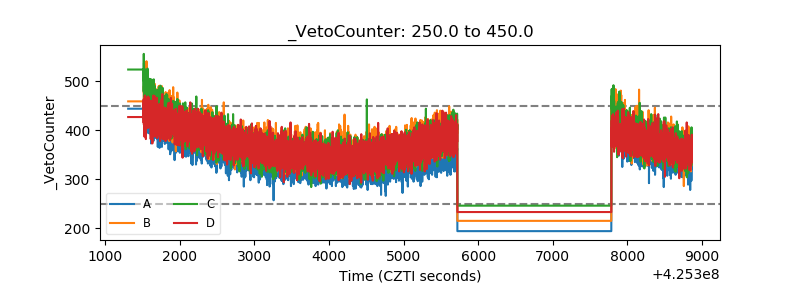 |