| Param | Original file | Final file |
|---|---|---|
| Filename | modeM0/AS1A12_099T04_9000005708_41840cztM0_level2.fits | modeM0/AS1A12_099T04_9000005708_41840cztM0_level2_quad_clean.evt |
| Size (bytes) | 357,062,400 | 87,514,560 |
| Size | 340.5 MB | 83.5 MB |
| Events in quadrant A | 3,912,010 | 578,591 |
| Events in quadrant B | 2,347,772 | 602,746 |
| Events in quadrant C | 3,342,632 | 561,127 |
| Events in quadrant D | 3,199,498 | 534,070 |
| Mode M0 | |||
|---|---|---|---|
| Quadrant | BADHDUFLAG | Total packets | Discarded packets |
| A | 0 | 15046 | 1 |
| B | 0 | 10836 | 1 |
| C | 0 | 13334 | 1 |
| D | 0 | 13302 | 1 |
| Mode SS | |||
|---|---|---|---|
| Quadrant | BADHDUFLAG | Total packets | Discarded packets |
| A | 0 | 108 | 0 |
| B | 0 | 108 | 0 |
| C | 0 | 108 | 0 |
| D | 0 | 108 | 0 |
| Mode M9 | |||
|---|---|---|---|
| Quadrant | BADHDUFLAG | Total packets | Discarded packets |
| A | 0 | 18 | 0 |
| B | 0 | 18 | 0 |
| C | 0 | 18 | 0 |
| D | 0 | 18 | 0 |
| Quadrant | Total seconds | Saturated seconds | Saturation percentage |
|---|---|---|---|
| A | 5334 | 272 | 5.099363% |
| B | 5334 | 9 | 0.168729% |
| C | 5334 | 143 | 2.680915% |
| D | 5335 | 88 | 1.649485% |
Noise dominated data is calculated using 1-second bins in cleaned event files. If a bin has >2000 counts, and if more than 50% of those come from <1% of pixels, then it is considered to be noise-dominated and hence unusable.
| Quadrant | # 1 sec bins | Bins with >0 counts | Bins with >2000 counts | High rate bins dominated by noise | Noise dominated (total time) | Noise dominated (detector-on time) | Marked lightcurve |
|---|---|---|---|---|---|---|---|
| A | 7067 | 5335 | 201 | 201 | 2.84% | 3.77% | 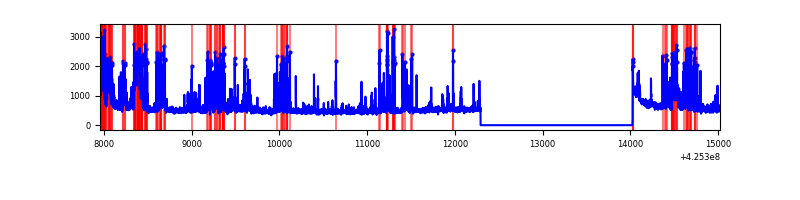 |
| B | 7067 | 5335 | 4 | 4 | 0.06% | 0.07% | 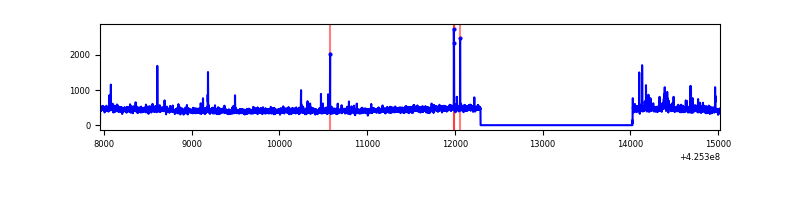 |
| C | 7067 | 5335 | 154 | 154 | 2.18% | 2.89% | 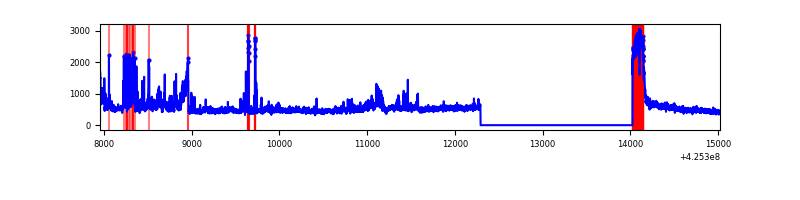 |
| D | 7068 | 5336 | 86 | 86 | 1.22% | 1.61% | 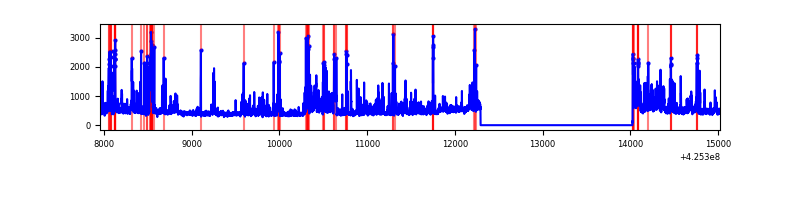 |
Top three noisy pixels from each quadrant. If the there are fewer than three noisy pixels in the level2.evt file, extra rows are filled as -1
| Pixel properties | Quadrant properties | ||||||
|---|---|---|---|---|---|---|---|
| Quadrant | DetID | PixID | Counts | Sigma | Mean | Median | Sigma |
| A | 14 | 24 | 1161022 | 9902.8 | 565 | 554 | 117.2 |
| A | 10 | 83 | 496269 | 4230.16 | 565 | 554 | 117.2 |
| A | 2 | 79 | 60542 | 511.9 | 565 | 554 | 117.2 |
| B | 0 | 183 | 46659 | 419.41 | 566 | 551 | 109.9 |
| B | 15 | 35 | 20816 | 184.34 | 566 | 551 | 109.9 |
| B | 0 | 186 | 19727 | 174.43 | 566 | 551 | 109.9 |
| C | 0 | 10 | 575269 | 4605.94 | 535 | 538 | 124.8 |
| C | 14 | 254 | 402986 | 3225.25 | 535 | 538 | 124.8 |
| C | 15 | 214 | 210327 | 1681.26 | 535 | 538 | 124.8 |
| D | 5 | 222 | 461978 | 3461.03 | 550 | 535 | 133.3 |
| D | 13 | 249 | 280917 | 2102.99 | 550 | 535 | 133.3 |
| D | 12 | 79 | 95057 | 708.96 | 550 | 535 | 133.3 |
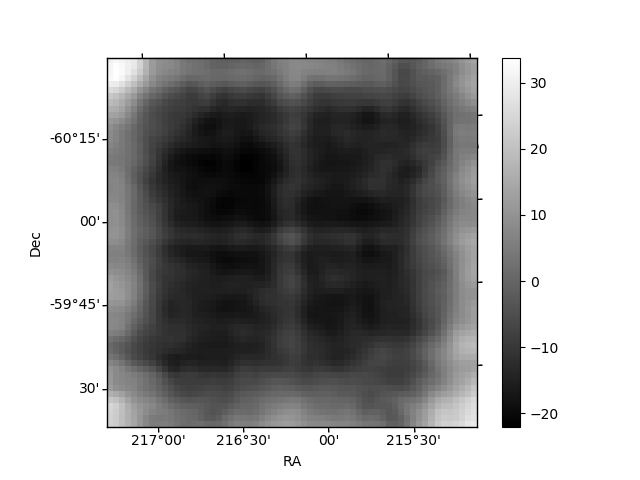
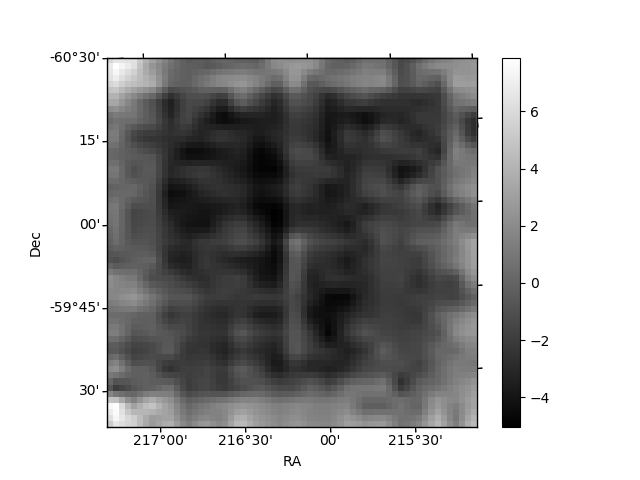
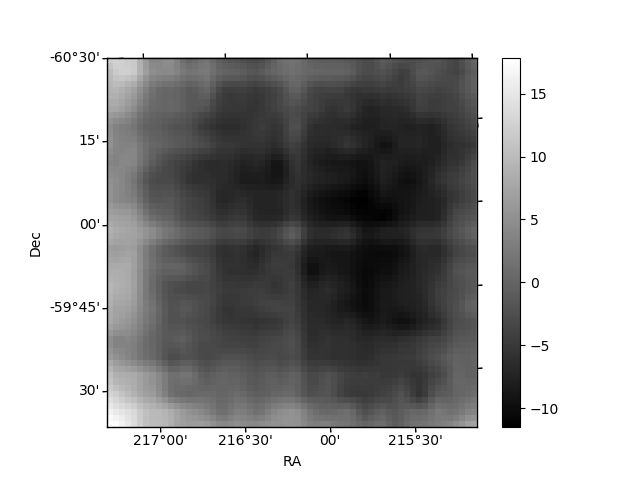
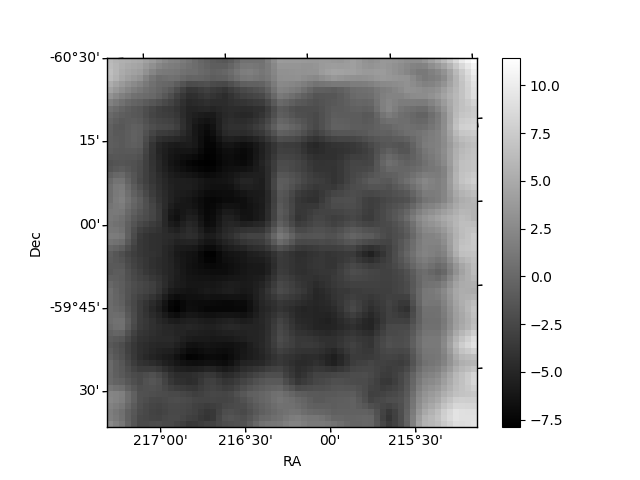
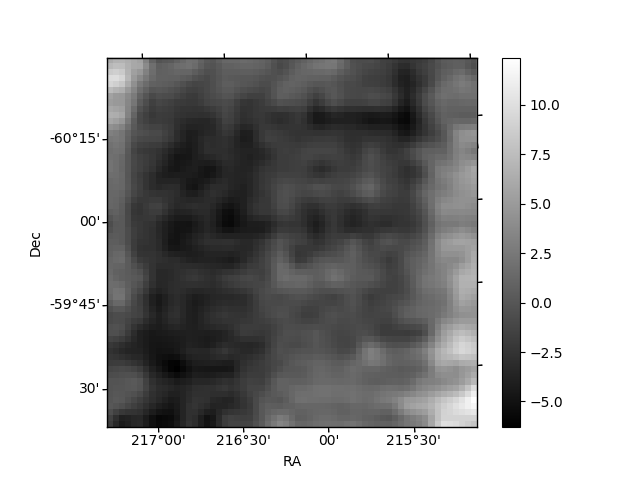
Histogram calculated using DETX and DETY for each event in the final _common_clean file
| Quadrant A | 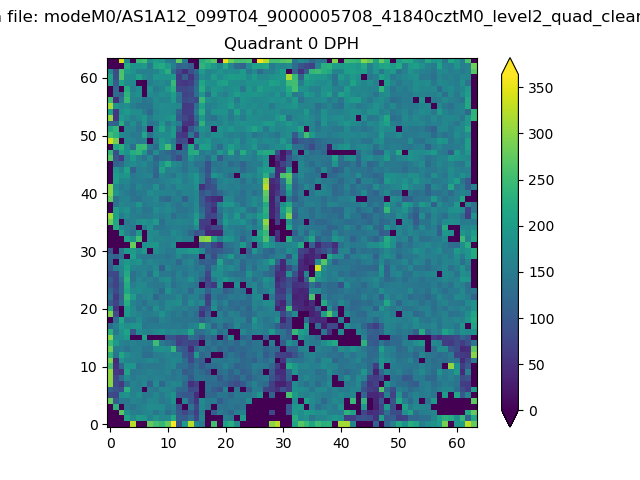 |
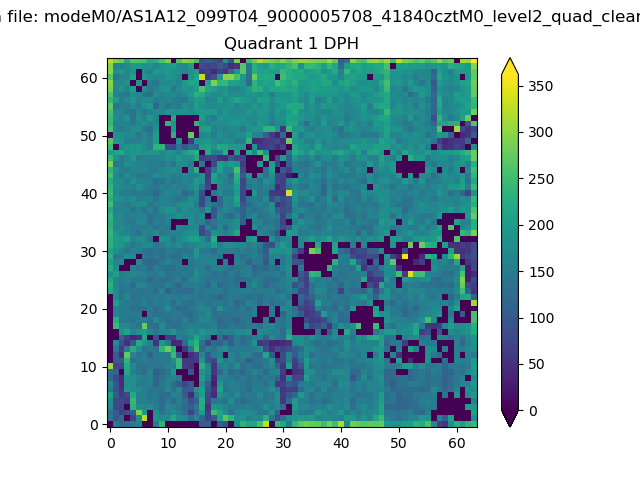 |
Quadrant B |
|---|---|---|---|
| Quadrant D | 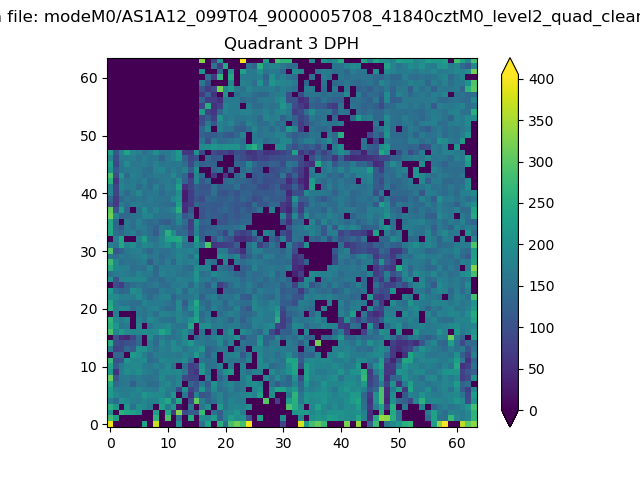 |
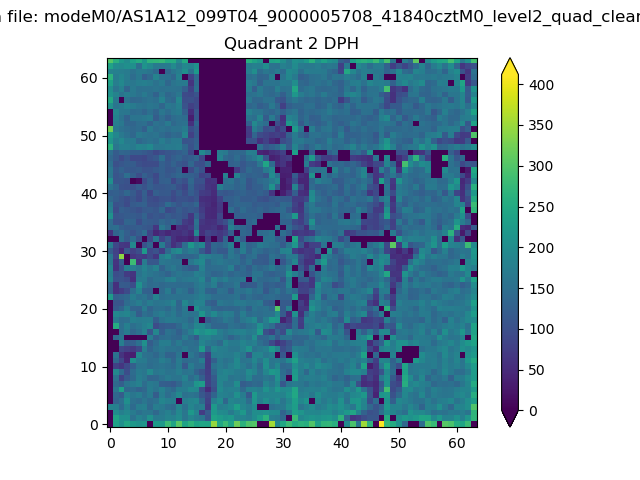 |
Quadrant C |
| Plot type | Count rate plots | Images |
|---|---|---|
| Comparison with Poisson distribution Blue bars denote a histogram of data divided into 1 sec bins. Red curve is a Poisson curve with rate = median count rate of data. |
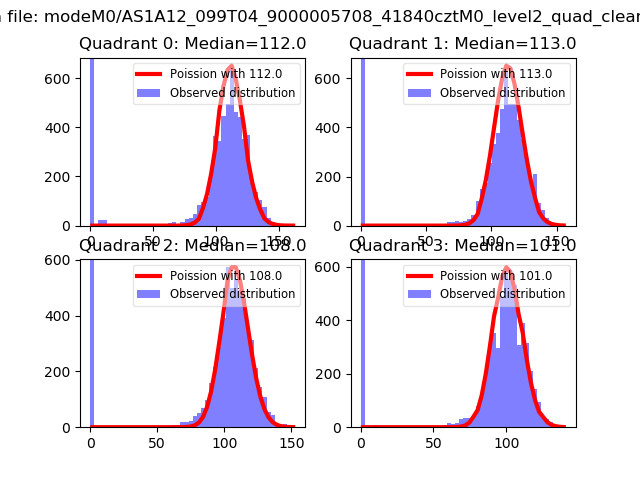 |
 |
| Quadrant-wise count rates Data is divided into 100 sec bins |
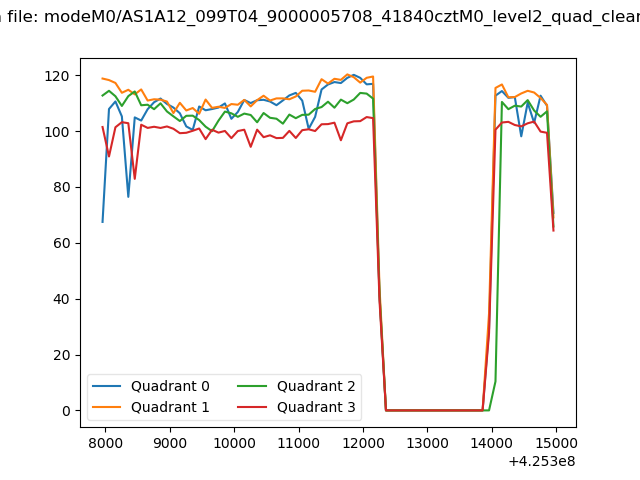 |
|
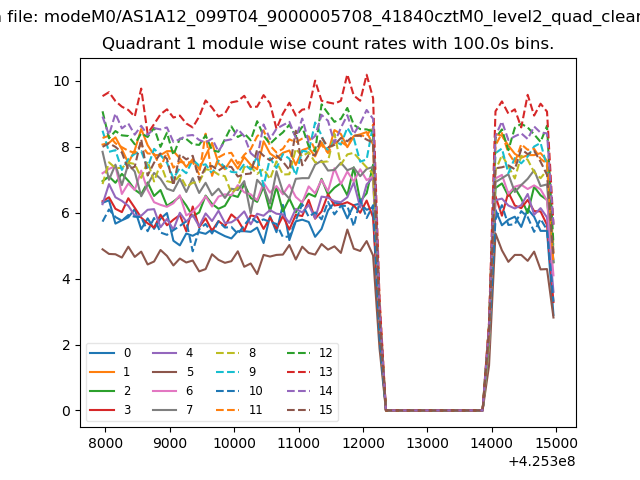
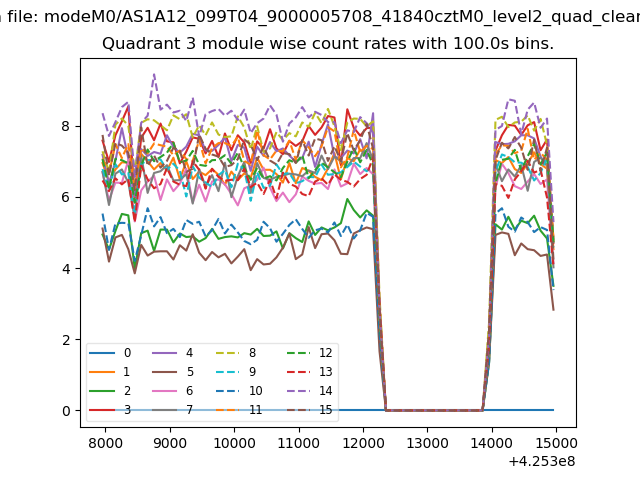
| Module-wise count rates for Quadrant A Data is divided into 100 sec bins |
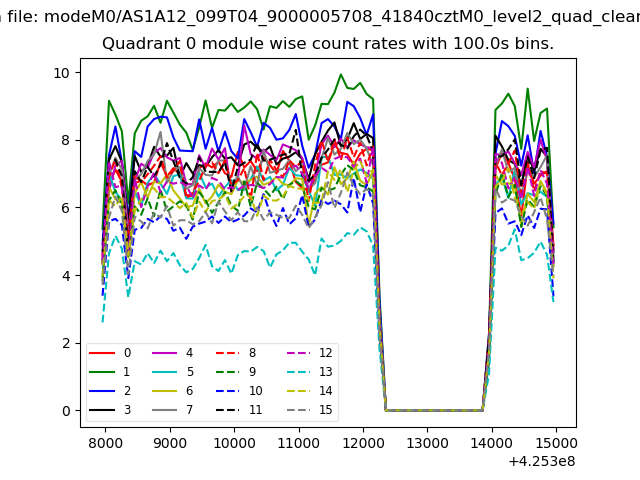 |
 |
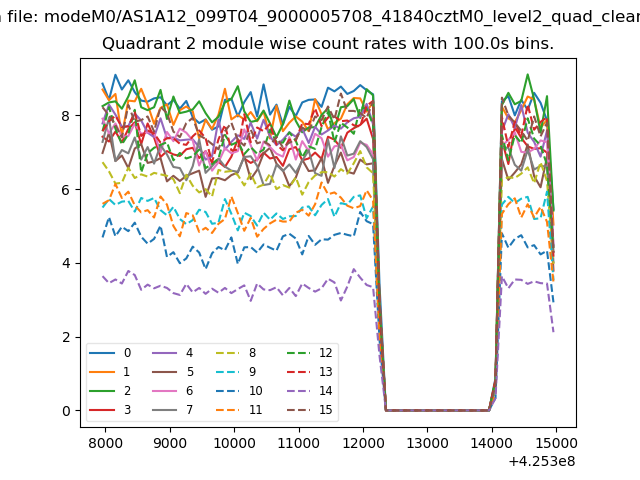
| Module-wise count rates for Quadrant B Data is divided into 100 sec bins |
 |
 |
| Module-wise count rates for Quadrant C Data is divided into 100 sec bins |
 |
 |
| Module-wise count rates for Quadrant D Data is divided into 100 sec bins |
 |
 |
| Parameter | Plot |
|---|---|
| CZT HV Monitor | 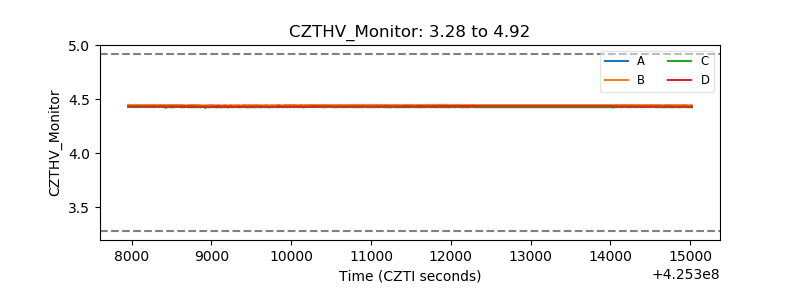 |
| D_VDD | 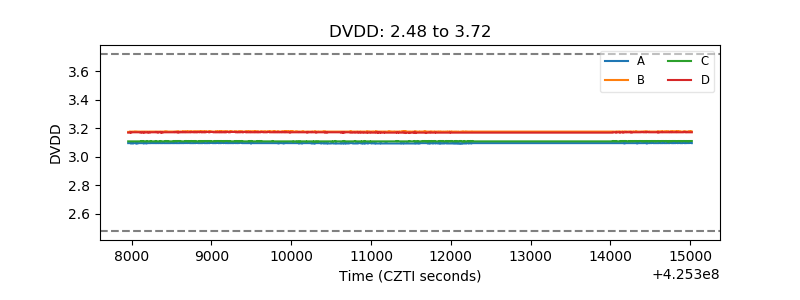 |
| Temperature 1 | 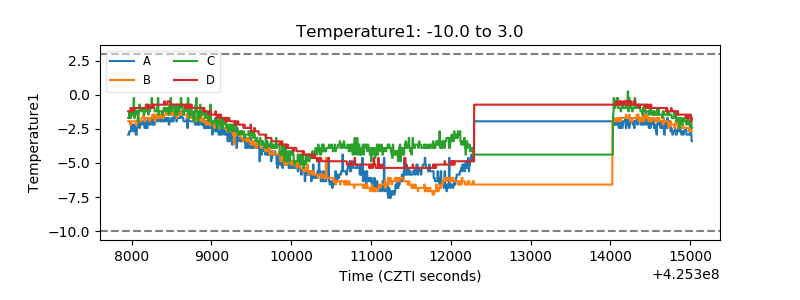 |
| Veto HV Monitor | 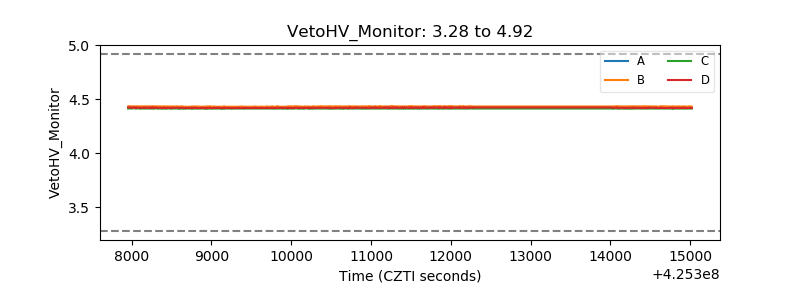 |
| Veto LLD |  |
| Alpha Counter | 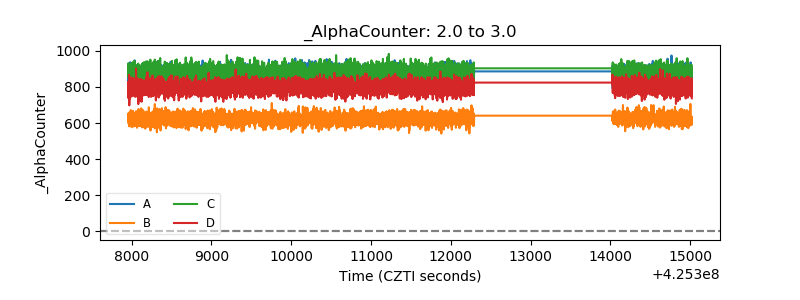 |
| _CPM_Rate | 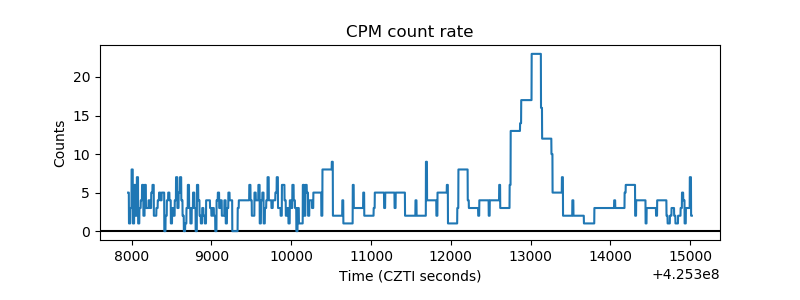 |
| CZT Counter | 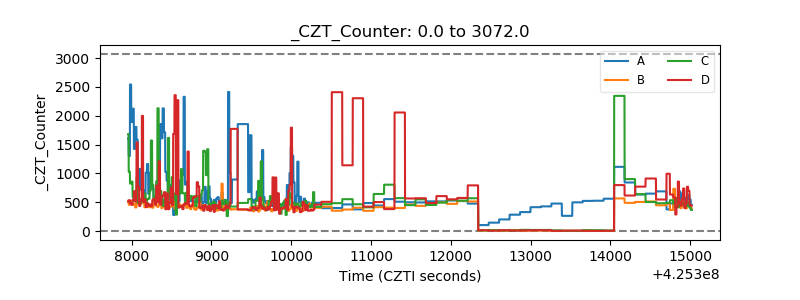 |
| +2.5 Volts monitor | 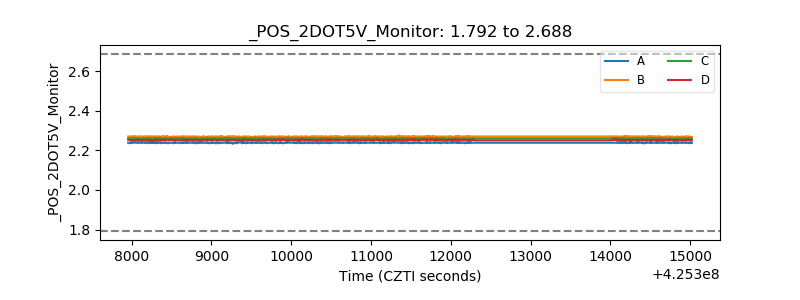 |
| +5 Volts monitor | 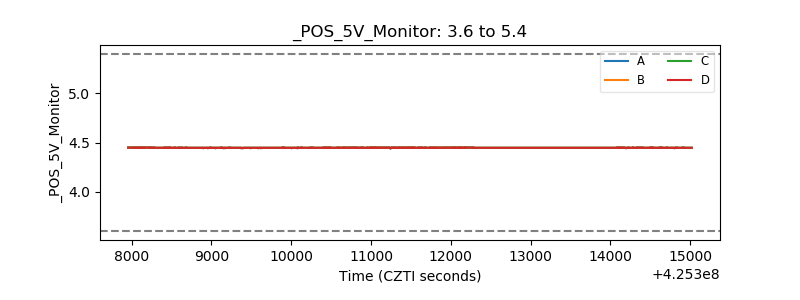 |
| _ROLL_ROT | 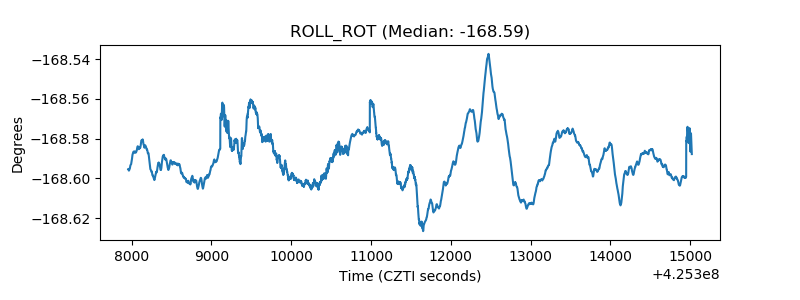 |
| _Roll_DEC | 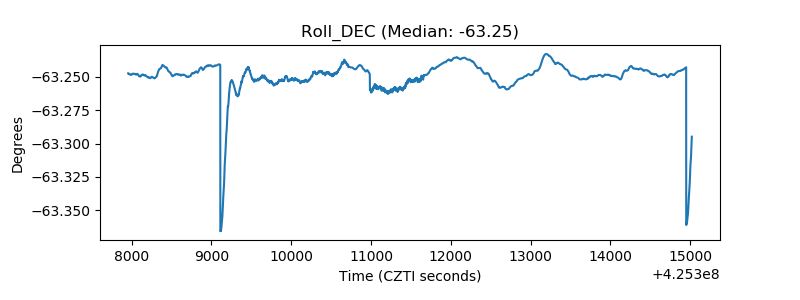 |
| _Roll_RA | 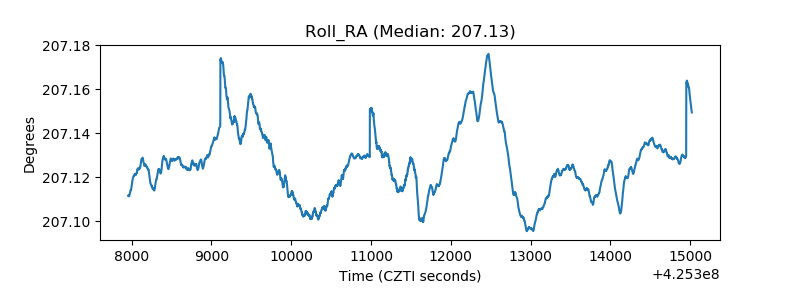 |
| Veto Counter | 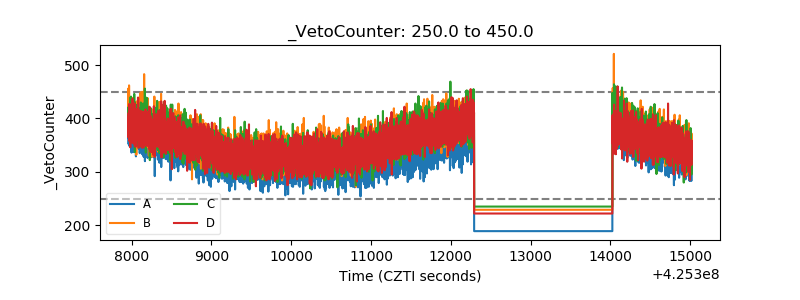 |