| Param | Original file | Final file |
|---|---|---|
| Filename | modeM0/AS1A12_099T04_9000005708_41841cztM0_level2.fits | modeM0/AS1A12_099T04_9000005708_41841cztM0_level2_quad_clean.evt |
| Size (bytes) | 381,409,920 | 95,379,840 |
| Size | 363.7 MB | 91.0 MB |
| Events in quadrant A | 4,378,753 | 635,642 |
| Events in quadrant B | 2,612,774 | 658,363 |
| Events in quadrant C | 3,355,537 | 599,579 |
| Events in quadrant D | 3,313,673 | 583,270 |
| Mode M0 | |||
|---|---|---|---|
| Quadrant | BADHDUFLAG | Total packets | Discarded packets |
| A | 0 | 16804 | 3 |
| B | 0 | 11963 | 2 |
| C | 0 | 13765 | 2 |
| D | 0 | 14095 | 2 |
| Mode SS | |||
|---|---|---|---|
| Quadrant | BADHDUFLAG | Total packets | Discarded packets |
| A | 0 | 120 | 0 |
| B | 0 | 120 | 0 |
| C | 0 | 120 | 0 |
| D | 0 | 120 | 0 |
| Mode M9 | |||
|---|---|---|---|
| Quadrant | BADHDUFLAG | Total packets | Discarded packets |
| A | 0 | 15 | 0 |
| B | 0 | 15 | 0 |
| C | 0 | 15 | 0 |
| D | 0 | 16 | 0 |
| Quadrant | Total seconds | Saturated seconds | Saturation percentage |
|---|---|---|---|
| A | 5883 | 263 | 4.470508% |
| B | 5883 | 14 | 0.237974% |
| C | 5883 | 239 | 4.062553% |
| D | 5883 | 84 | 1.427843% |
Noise dominated data is calculated using 1-second bins in cleaned event files. If a bin has >2000 counts, and if more than 50% of those come from <1% of pixels, then it is considered to be noise-dominated and hence unusable.
| Quadrant | # 1 sec bins | Bins with >0 counts | Bins with >2000 counts | High rate bins dominated by noise | Noise dominated (total time) | Noise dominated (detector-on time) | Marked lightcurve |
|---|---|---|---|---|---|---|---|
| A | 7316 | 5884 | 186 | 186 | 2.54% | 3.16% | 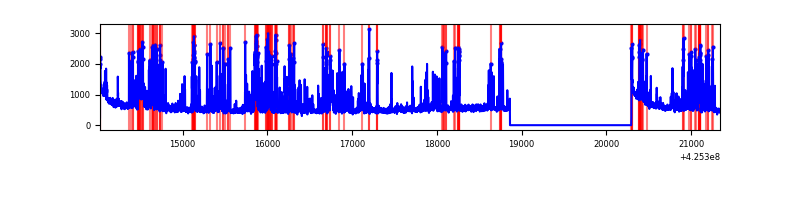 |
| B | 7316 | 5884 | 2 | 2 | 0.03% | 0.03% | 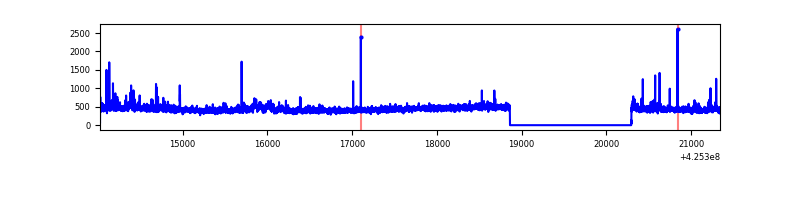 |
| C | 7316 | 5884 | 235 | 235 | 3.21% | 3.99% | 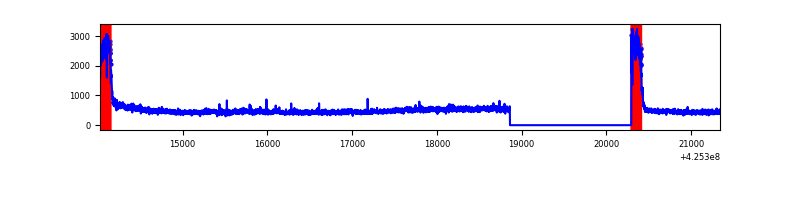 |
| D | 7316 | 5884 | 80 | 80 | 1.09% | 1.36% | 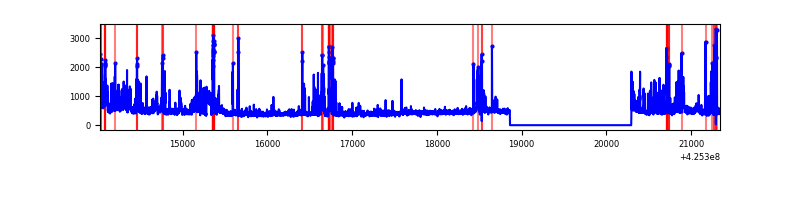 |
Top three noisy pixels from each quadrant. If the there are fewer than three noisy pixels in the level2.evt file, extra rows are filled as -1
| Pixel properties | Quadrant properties | ||||||
|---|---|---|---|---|---|---|---|
| Quadrant | DetID | PixID | Counts | Sigma | Mean | Median | Sigma |
| A | 14 | 24 | 1124204 | 8813.82 | 624 | 611 | 127.5 |
| A | 10 | 83 | 597810 | 4684.62 | 624 | 611 | 127.5 |
| A | 2 | 79 | 231655 | 1812.38 | 624 | 611 | 127.5 |
| B | 0 | 156 | 49294 | 397.61 | 627 | 609 | 122.4 |
| B | 15 | 35 | 24655 | 196.39 | 627 | 609 | 122.4 |
| B | 4 | 141 | 22663 | 180.12 | 627 | 609 | 122.4 |
| C | 0 | 10 | 817764 | 5975.08 | 588 | 592 | 136.8 |
| C | 15 | 214 | 231085 | 1685.34 | 588 | 592 | 136.8 |
| C | 14 | 254 | 6258 | 41.43 | 588 | 592 | 136.8 |
| D | 5 | 222 | 343041 | 2296.46 | 609 | 592 | 149.1 |
| D | 13 | 249 | 250136 | 1673.44 | 609 | 592 | 149.1 |
| D | 12 | 79 | 142479 | 951.49 | 609 | 592 | 149.1 |
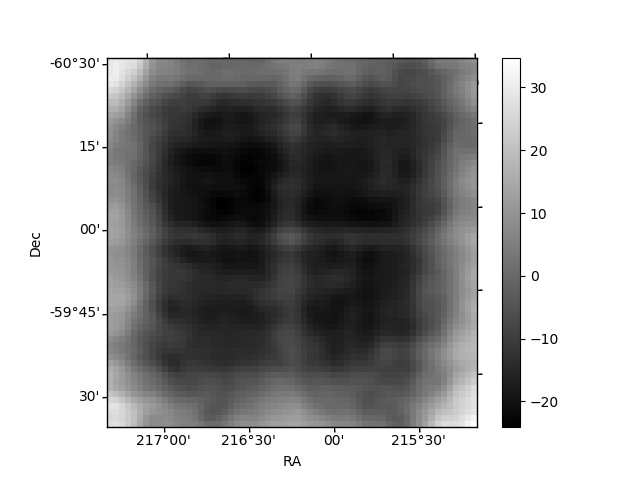
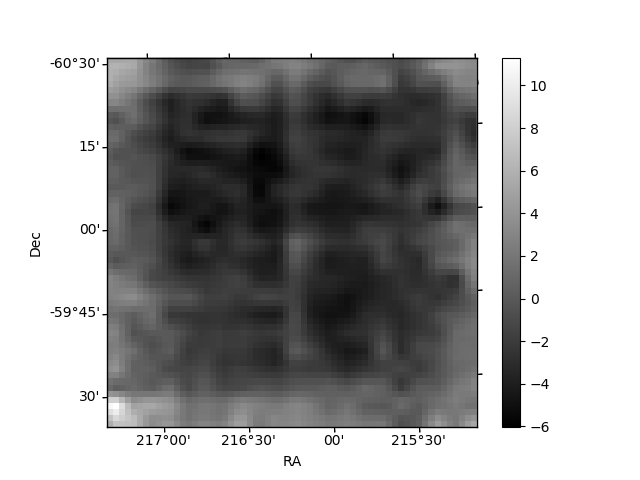
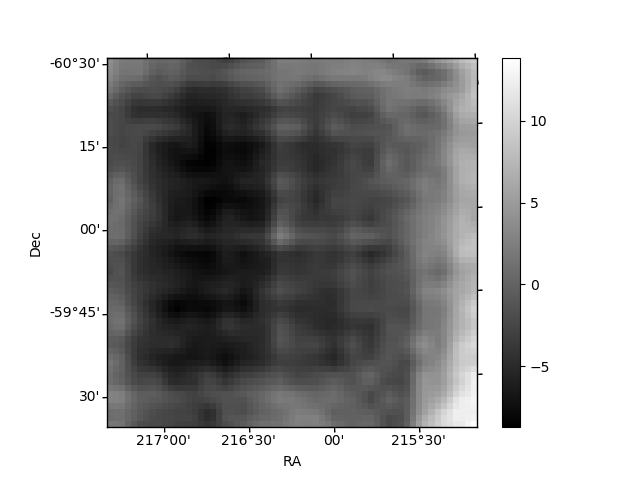
Histogram calculated using DETX and DETY for each event in the final _common_clean file
| Quadrant A | 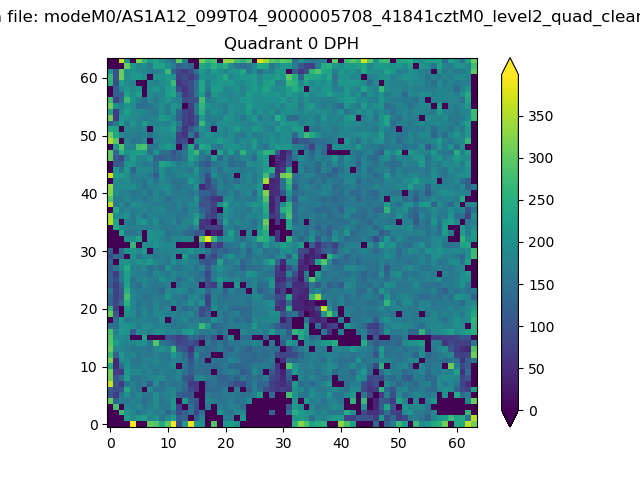 |
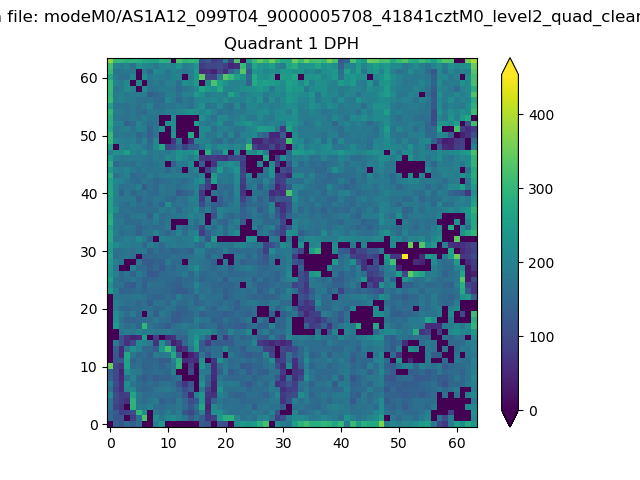 |
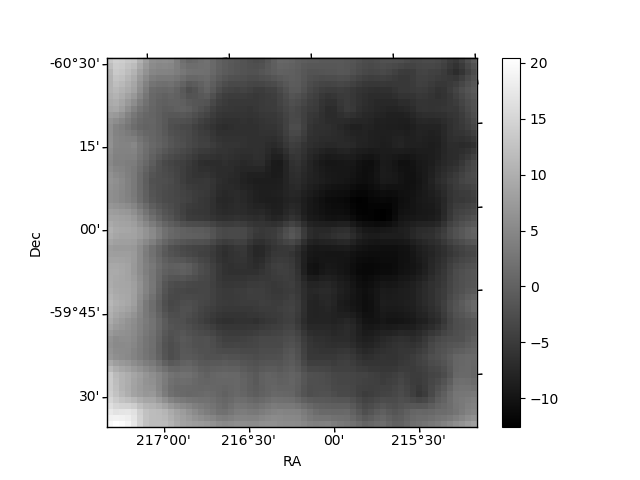
Quadrant B |
|---|---|---|---|
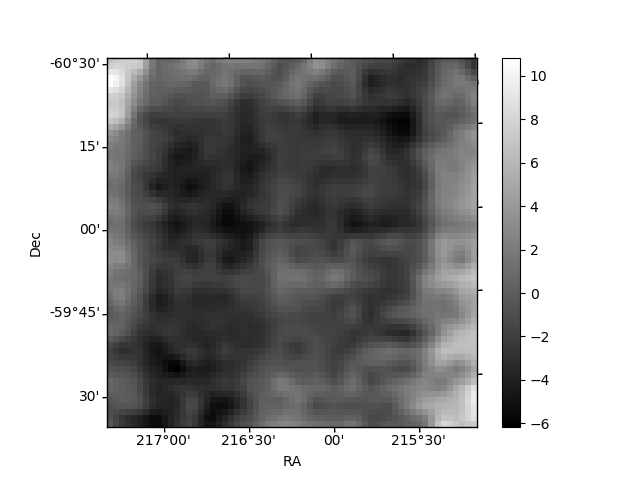
| Quadrant D | 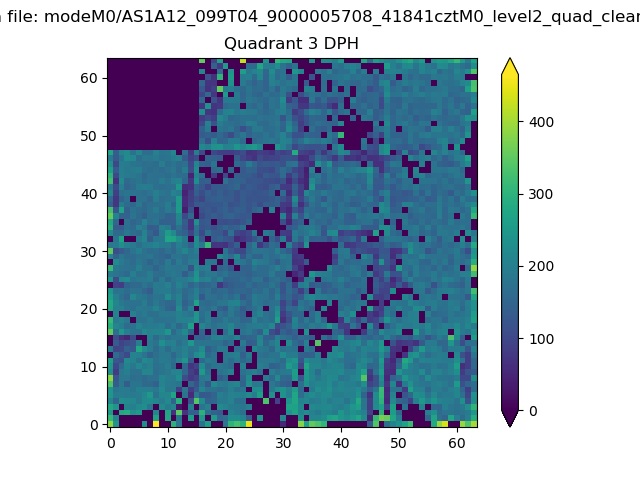 |
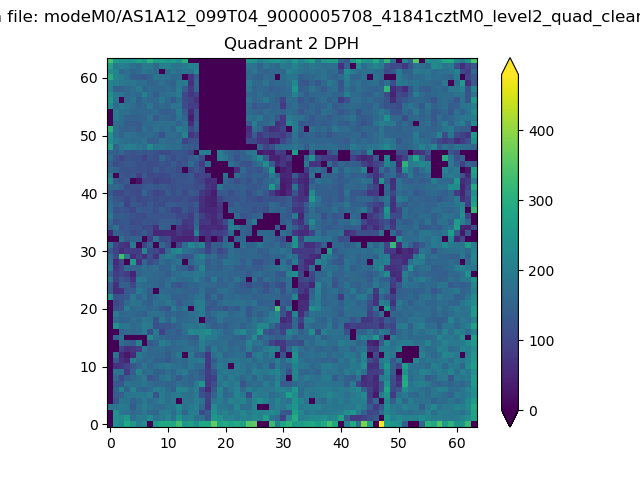 |
Quadrant C |
| Plot type | Count rate plots | Images |
|---|---|---|
| Comparison with Poisson distribution Blue bars denote a histogram of data divided into 1 sec bins. Red curve is a Poisson curve with rate = median count rate of data. |
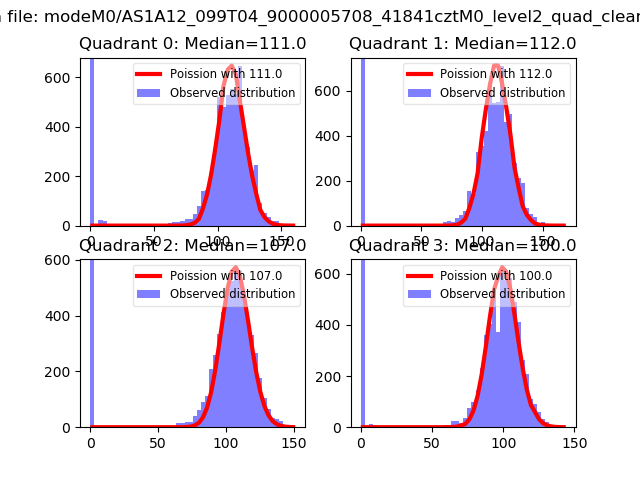 |
 |
| Quadrant-wise count rates Data is divided into 100 sec bins |
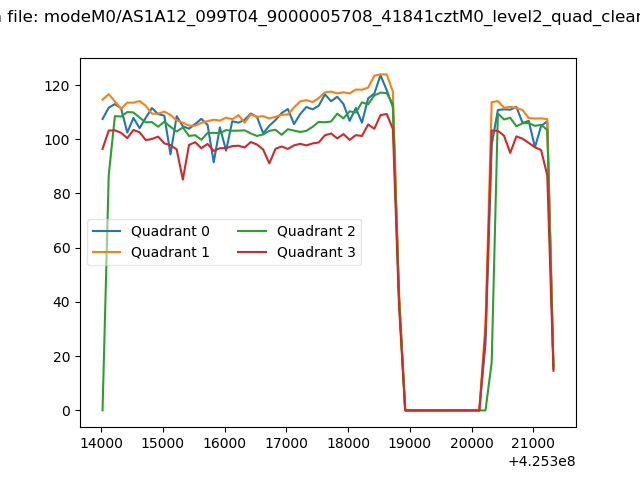 |
|
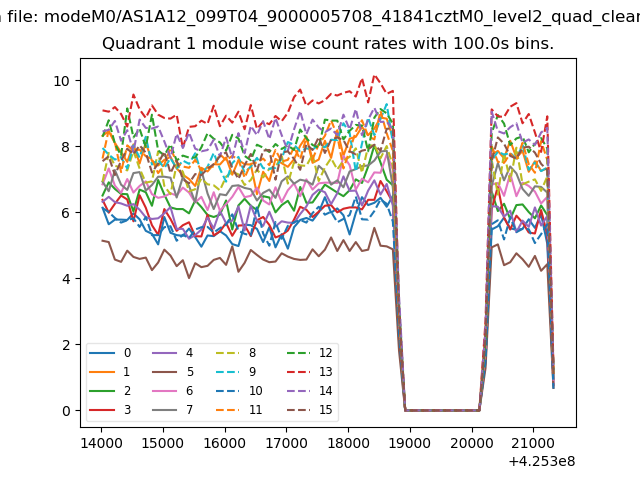
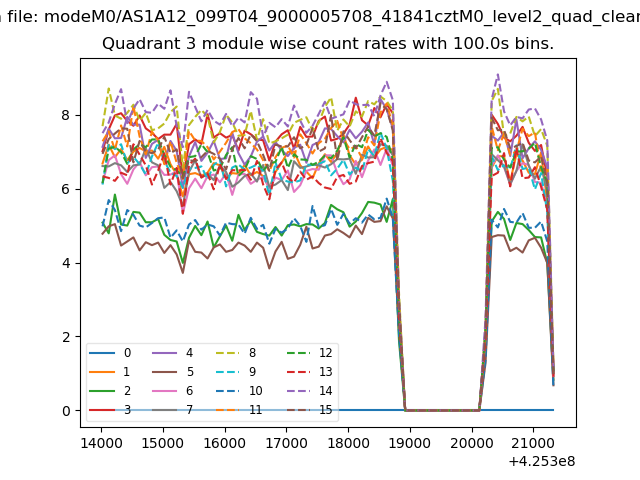
| Module-wise count rates for Quadrant A Data is divided into 100 sec bins |
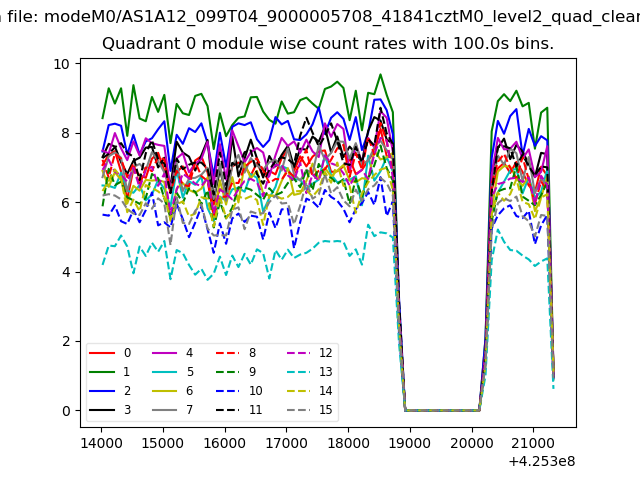 |
 |
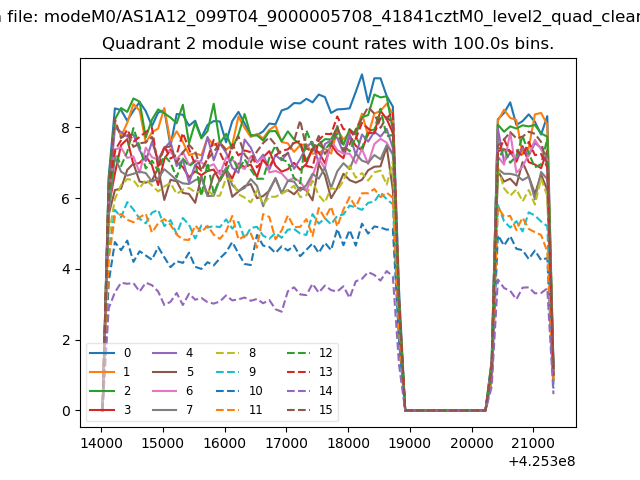
| Module-wise count rates for Quadrant B Data is divided into 100 sec bins |
 |
 |
| Module-wise count rates for Quadrant C Data is divided into 100 sec bins |
 |
 |
| Module-wise count rates for Quadrant D Data is divided into 100 sec bins |
 |
 |
| Parameter | Plot |
|---|---|
| CZT HV Monitor | 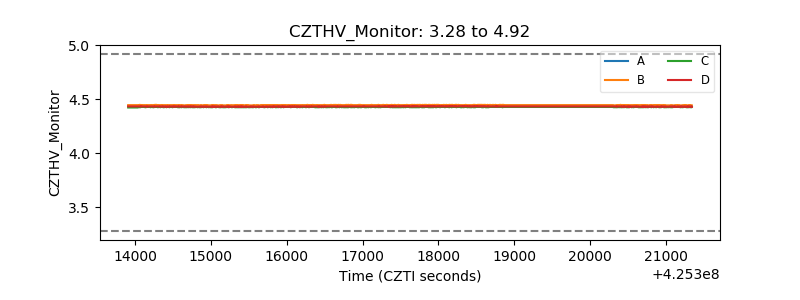 |
| D_VDD |  |
| Temperature 1 | 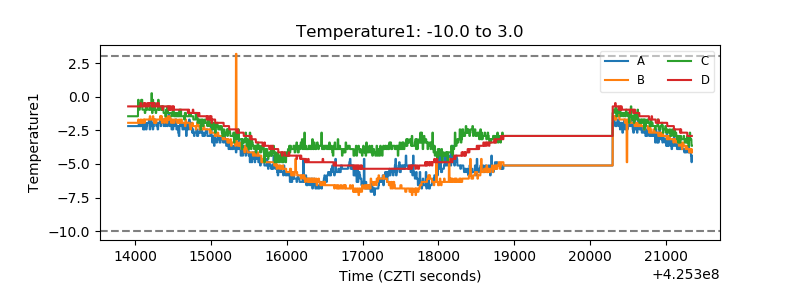 |
| Veto HV Monitor | 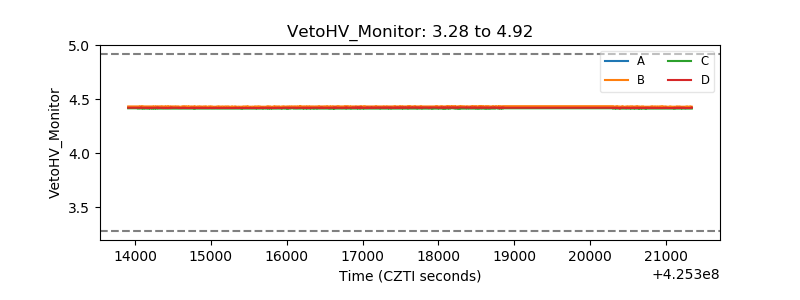 |
| Veto LLD | 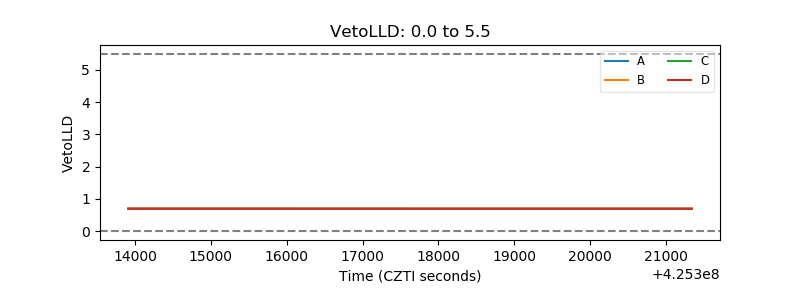 |
| Alpha Counter | 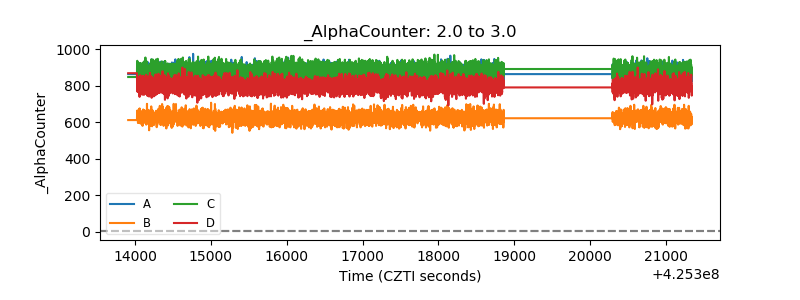 |
| _CPM_Rate | 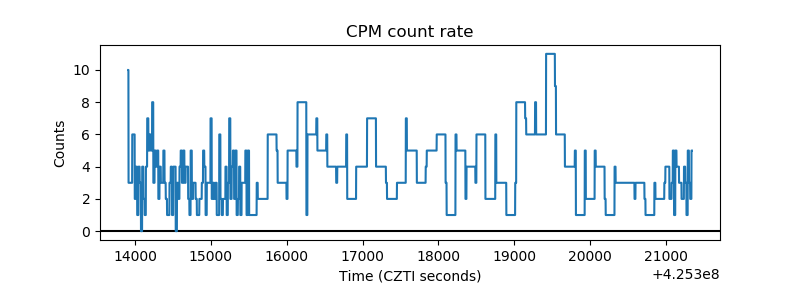 |
| CZT Counter | 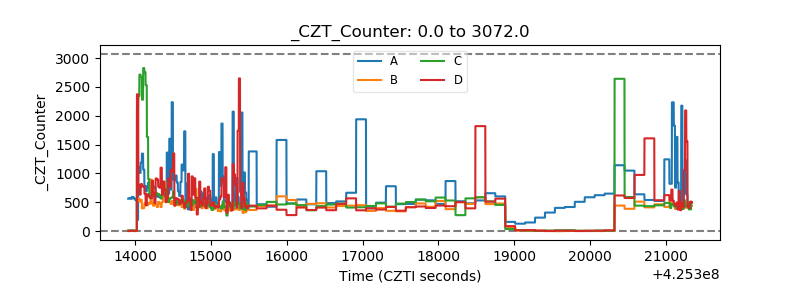 |
| +2.5 Volts monitor | 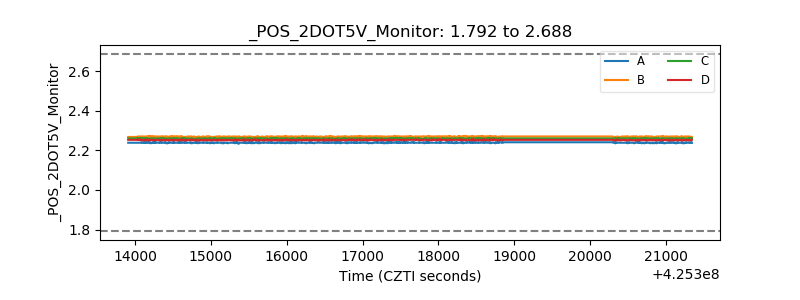 |
| +5 Volts monitor | 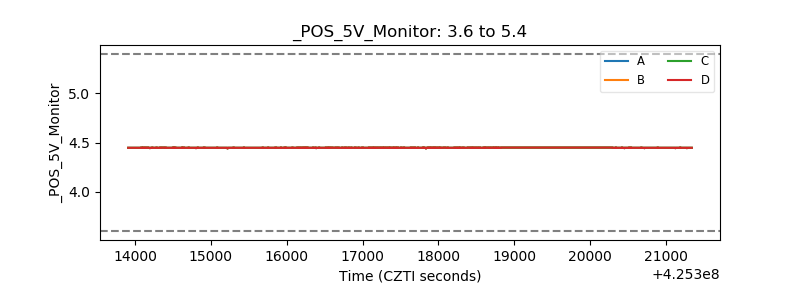 |
| _ROLL_ROT | 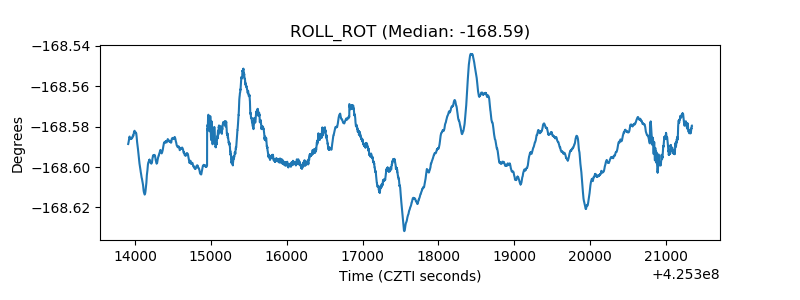 |
| _Roll_DEC | 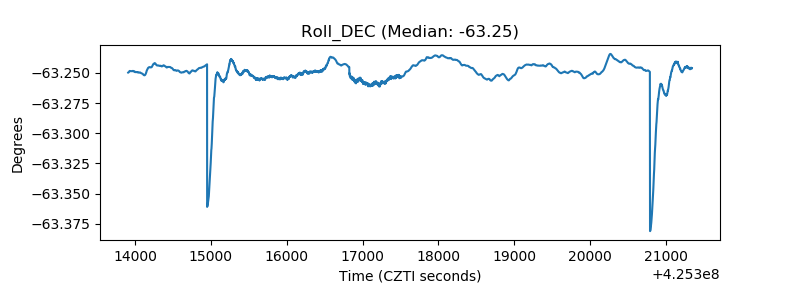 |
| _Roll_RA | 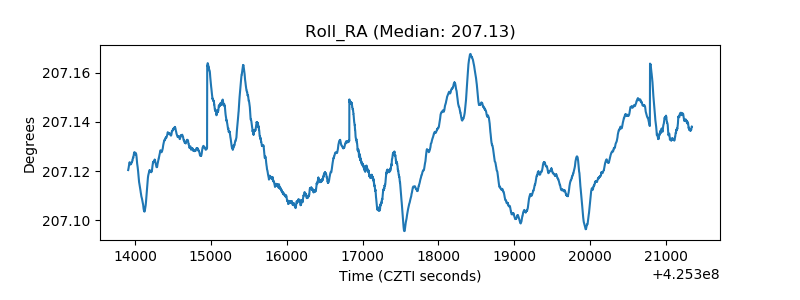 |
| Veto Counter | 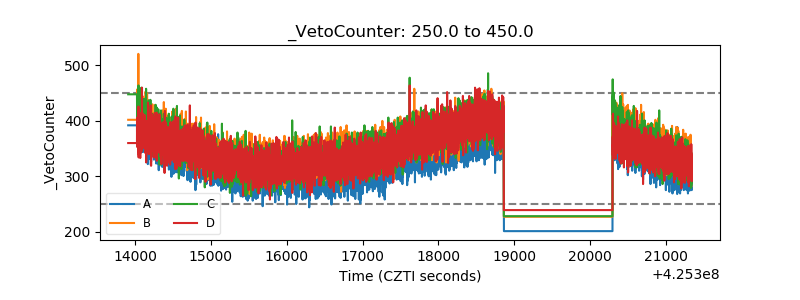 |