| Param | Original file | Final file |
|---|---|---|
| Filename | modeM0/AS1A12_099T04_9000005708_41842cztM0_level2.fits | modeM0/AS1A12_099T04_9000005708_41842cztM0_level2_quad_clean.evt |
| Size (bytes) | 371,027,520 | 94,354,560 |
| Size | 353.8 MB | 90.0 MB |
| Events in quadrant A | 4,321,299 | 629,225 |
| Events in quadrant B | 2,642,049 | 650,131 |
| Events in quadrant C | 3,236,478 | 593,728 |
| Events in quadrant D | 3,079,015 | 574,735 |
| Mode M0 | |||
|---|---|---|---|
| Quadrant | BADHDUFLAG | Total packets | Discarded packets |
| A | 0 | 16671 | 2 |
| B | 0 | 12017 | 2 |
| C | 0 | 13470 | 2 |
| D | 0 | 13387 | 2 |
| Mode SS | |||
|---|---|---|---|
| Quadrant | BADHDUFLAG | Total packets | Discarded packets |
| A | 0 | 120 | 0 |
| B | 0 | 120 | 0 |
| C | 0 | 120 | 0 |
| D | 0 | 120 | 0 |
| Mode M9 | |||
|---|---|---|---|
| Quadrant | BADHDUFLAG | Total packets | Discarded packets |
| A | 0 | 18 | 0 |
| B | 0 | 18 | 0 |
| C | 0 | 19 | 0 |
| D | 0 | 19 | 0 |
| Quadrant | Total seconds | Saturated seconds | Saturation percentage |
|---|---|---|---|
| A | 5850 | 255 | 4.358974% |
| B | 5850 | 24 | 0.410256% |
| C | 5850 | 226 | 3.863248% |
| D | 5849 | 67 | 1.145495% |
Noise dominated data is calculated using 1-second bins in cleaned event files. If a bin has >2000 counts, and if more than 50% of those come from <1% of pixels, then it is considered to be noise-dominated and hence unusable.
| Quadrant | # 1 sec bins | Bins with >0 counts | Bins with >2000 counts | High rate bins dominated by noise | Noise dominated (total time) | Noise dominated (detector-on time) | Marked lightcurve |
|---|---|---|---|---|---|---|---|
| A | 7163 | 5851 | 163 | 163 | 2.28% | 2.79% | 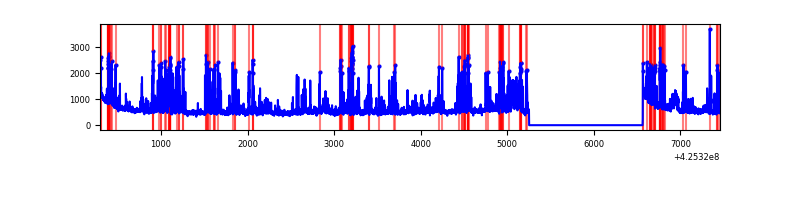 |
| B | 7163 | 5851 | 13 | 13 | 0.18% | 0.22% | 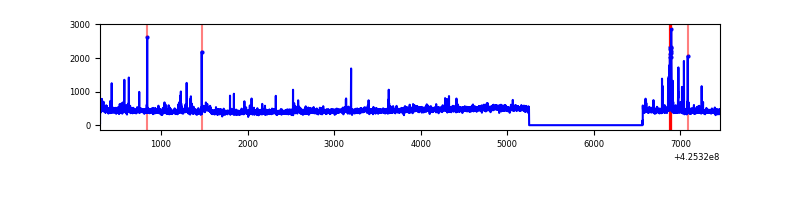 |
| C | 7163 | 5851 | 219 | 219 | 3.06% | 3.74% | 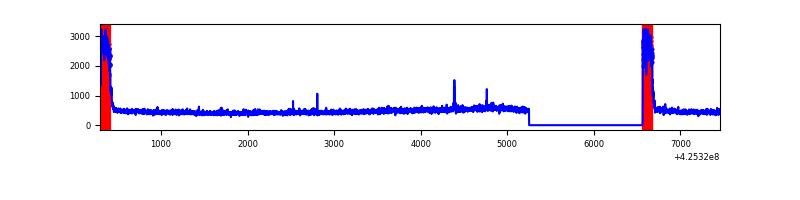 |
| D | 7162 | 5850 | 60 | 60 | 0.84% | 1.03% | 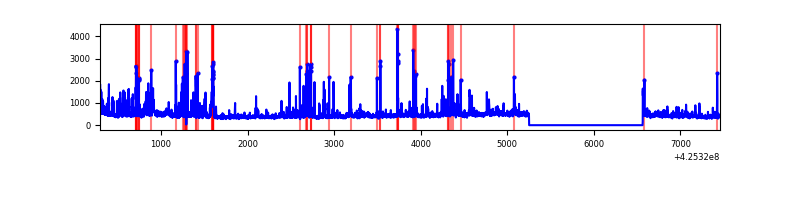 |
Top three noisy pixels from each quadrant. If the there are fewer than three noisy pixels in the level2.evt file, extra rows are filled as -1
| Pixel properties | Quadrant properties | ||||||
|---|---|---|---|---|---|---|---|
| Quadrant | DetID | PixID | Counts | Sigma | Mean | Median | Sigma |
| A | 14 | 24 | 1178431 | 9184.84 | 622 | 609 | 128.2 |
| A | 10 | 83 | 581620 | 4530.81 | 622 | 609 | 128.2 |
| A | 2 | 79 | 137013 | 1063.7 | 622 | 609 | 128.2 |
| B | 4 | 141 | 87463 | 717.01 | 626 | 608 | 121.1 |
| B | 0 | 156 | 37943 | 308.21 | 626 | 608 | 121.1 |
| B | 0 | 183 | 19337 | 154.61 | 626 | 608 | 121.1 |
| C | 0 | 10 | 684506 | 4931.67 | 593 | 596 | 138.7 |
| C | 15 | 214 | 230975 | 1661.26 | 593 | 596 | 138.7 |
| C | 14 | 254 | 8438 | 56.55 | 593 | 596 | 138.7 |
| D | 13 | 249 | 213541 | 1449.14 | 606 | 589 | 147.0 |
| D | 12 | 6 | 181342 | 1230.03 | 606 | 589 | 147.0 |
| D | 12 | 250 | 120366 | 815.08 | 606 | 589 | 147.0 |
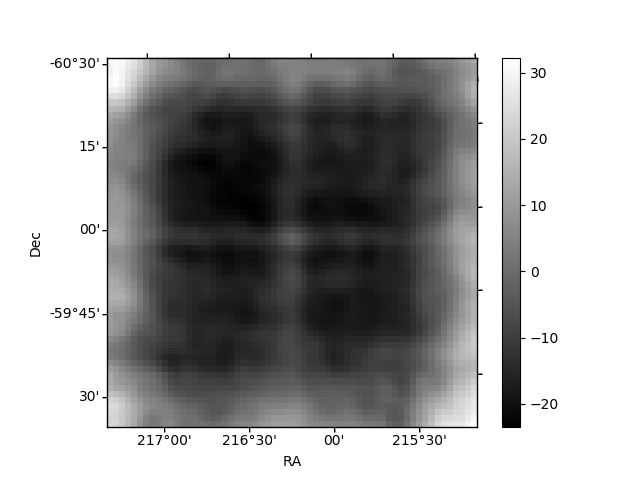
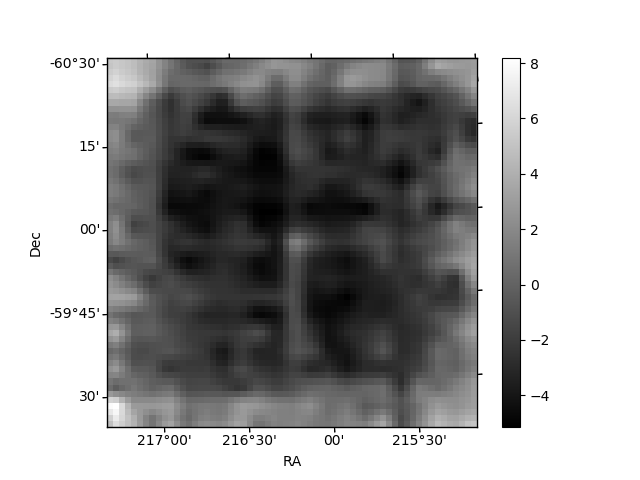
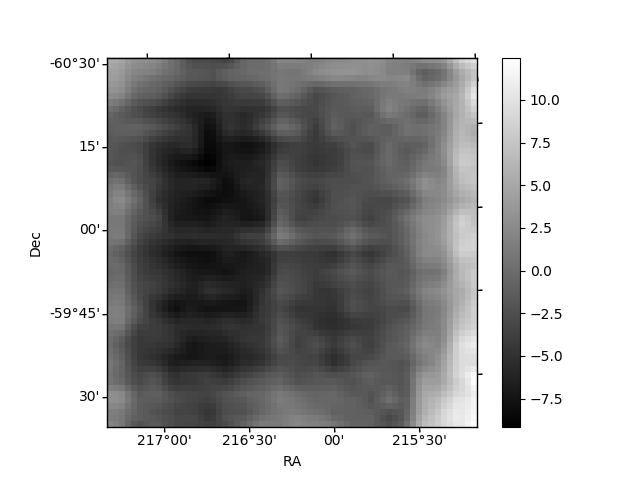
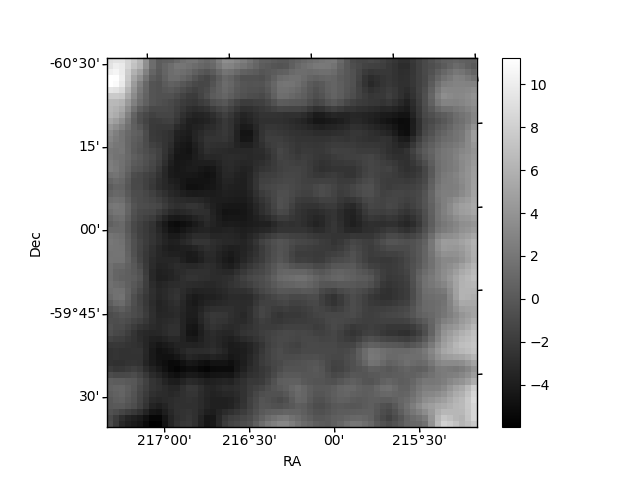
Histogram calculated using DETX and DETY for each event in the final _common_clean file
| Quadrant A | 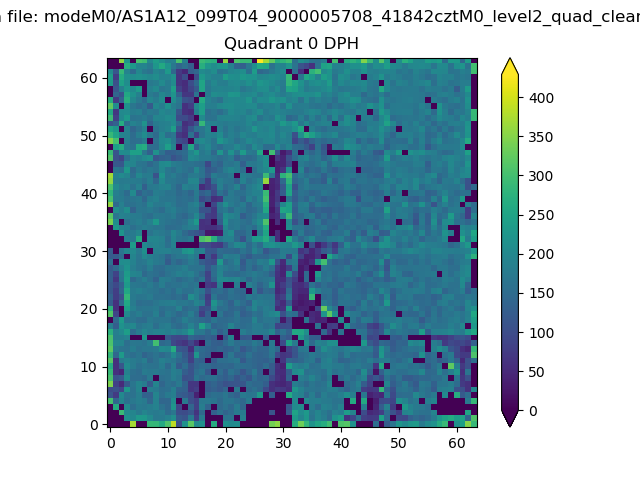 |
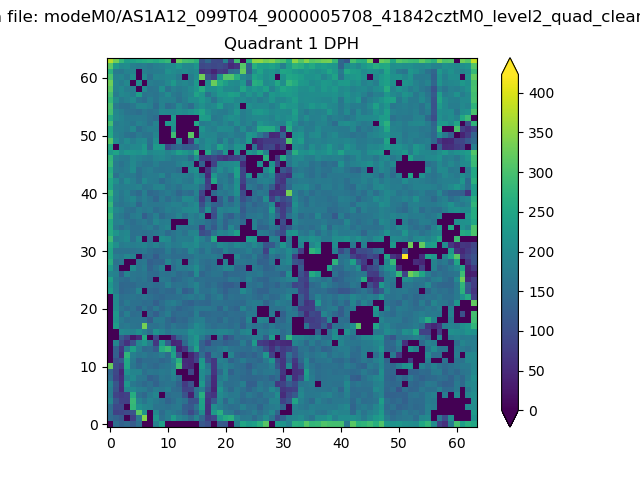 |
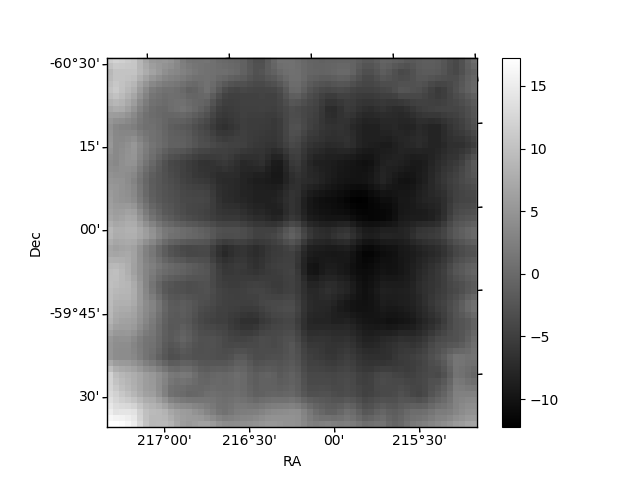
Quadrant B |
|---|---|---|---|
| Quadrant D | 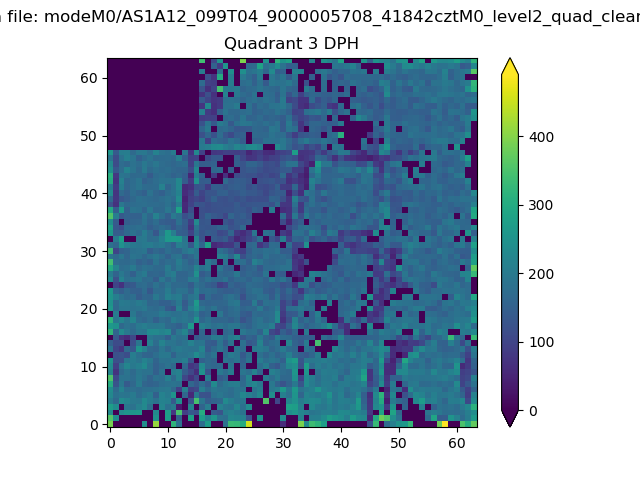 |
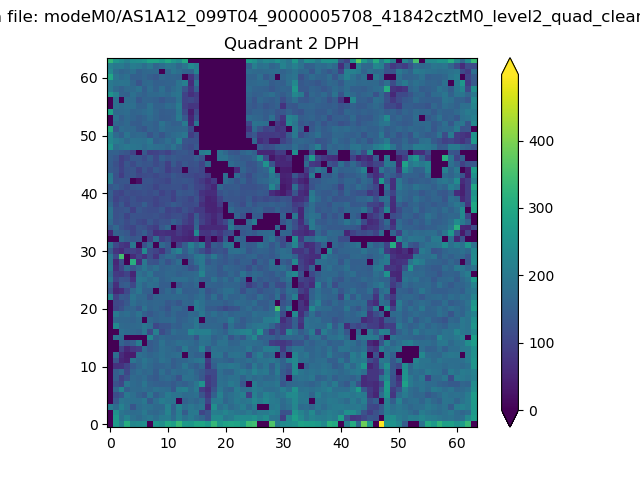 |
Quadrant C |
| Plot type | Count rate plots | Images |
|---|---|---|
| Comparison with Poisson distribution Blue bars denote a histogram of data divided into 1 sec bins. Red curve is a Poisson curve with rate = median count rate of data. |
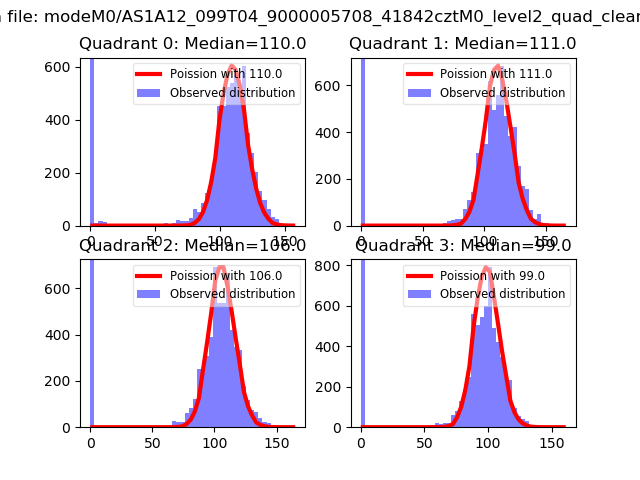 |
 |
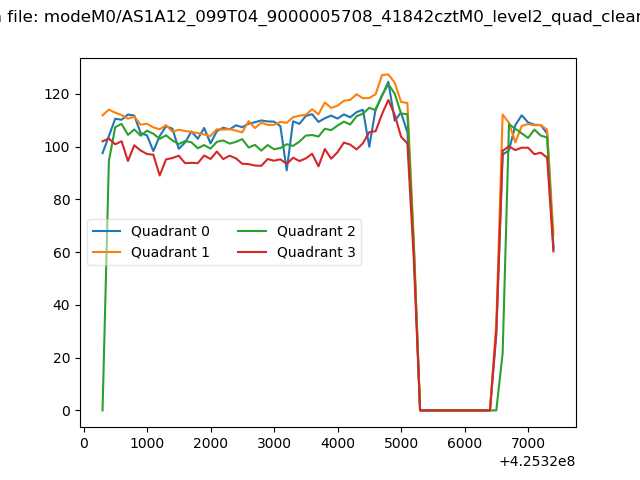
| Quadrant-wise count rates Data is divided into 100 sec bins |
 |
|
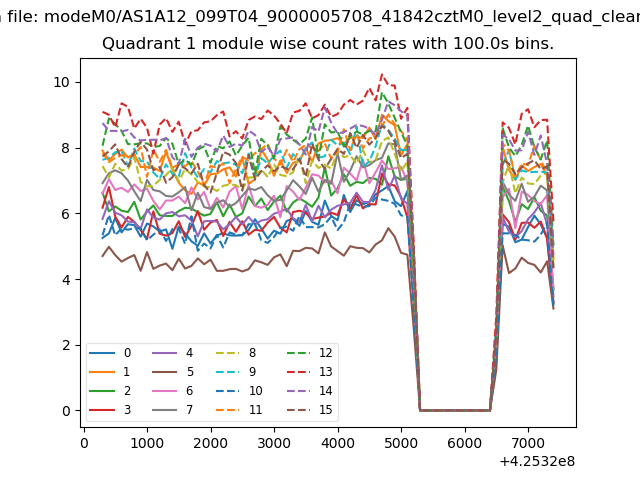
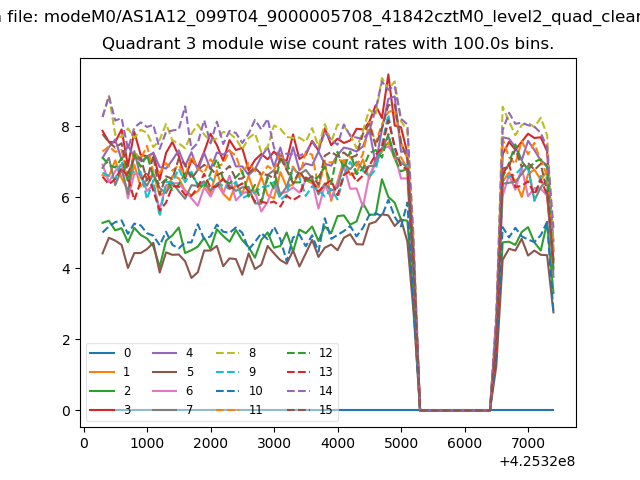
| Module-wise count rates for Quadrant A Data is divided into 100 sec bins |
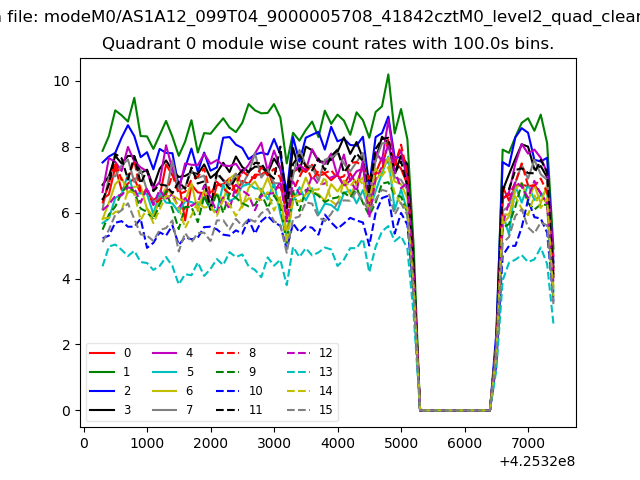 |
 |
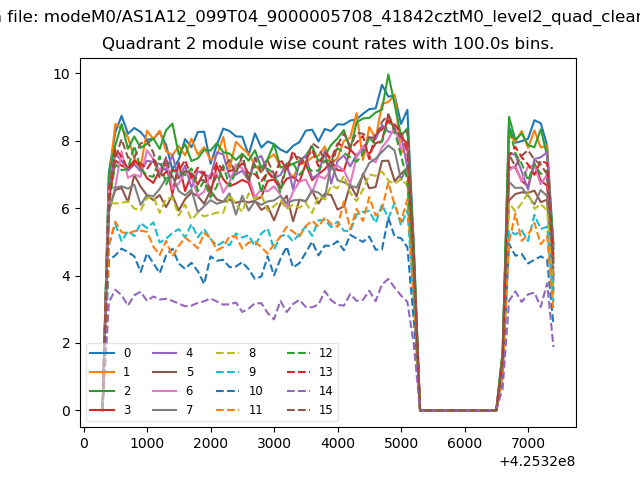
| Module-wise count rates for Quadrant B Data is divided into 100 sec bins |
 |
 |
| Module-wise count rates for Quadrant C Data is divided into 100 sec bins |
 |
 |
| Module-wise count rates for Quadrant D Data is divided into 100 sec bins |
 |
 |
| Parameter | Plot |
|---|---|
| CZT HV Monitor | 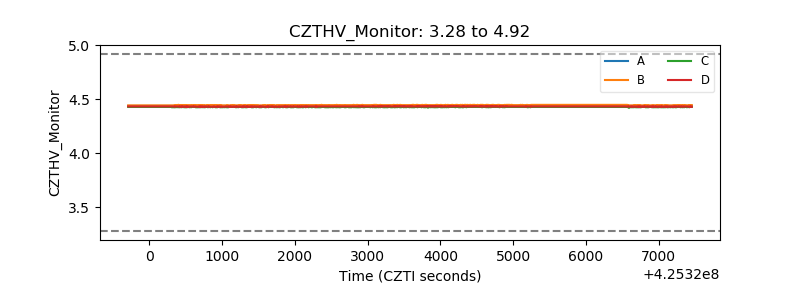 |
| D_VDD |  |
| Temperature 1 | 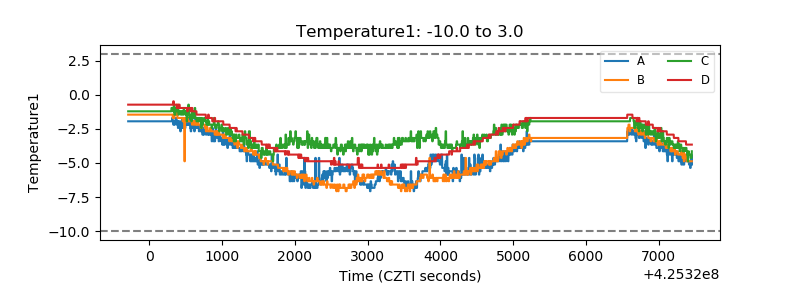 |
| Veto HV Monitor | 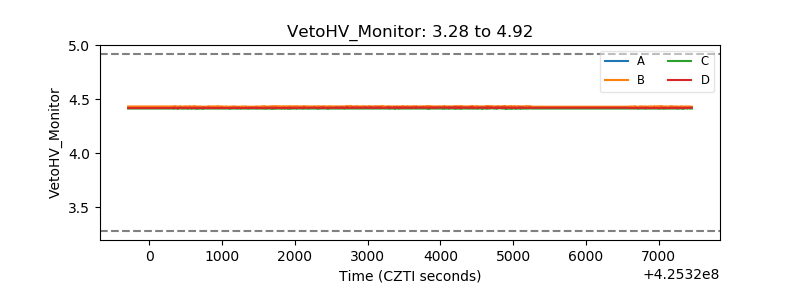 |
| Veto LLD | 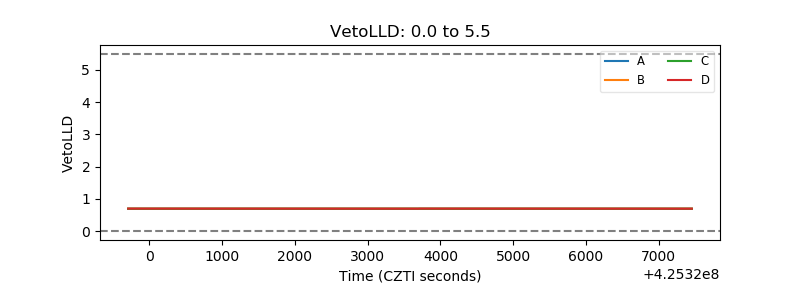 |
| Alpha Counter | 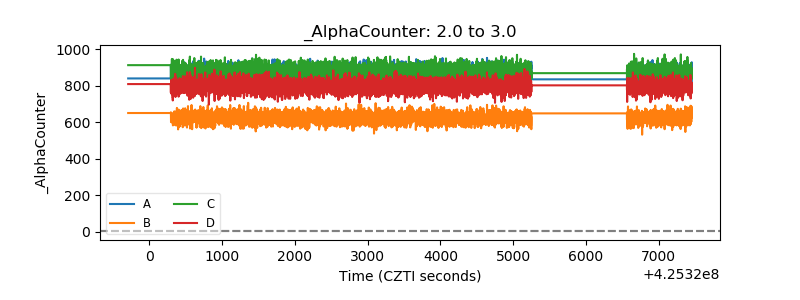 |
| _CPM_Rate | 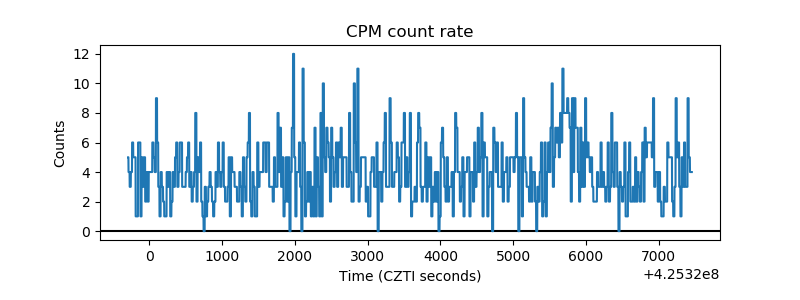 |
| CZT Counter | 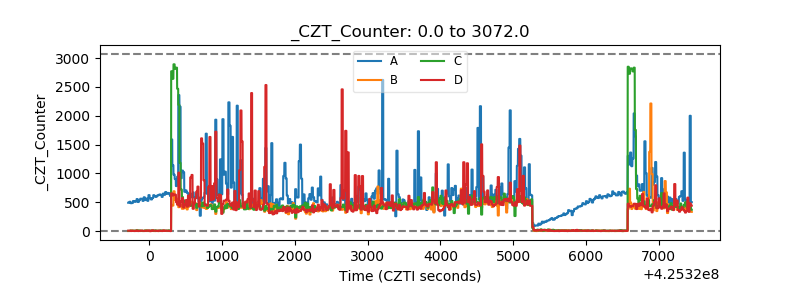 |
| +2.5 Volts monitor | 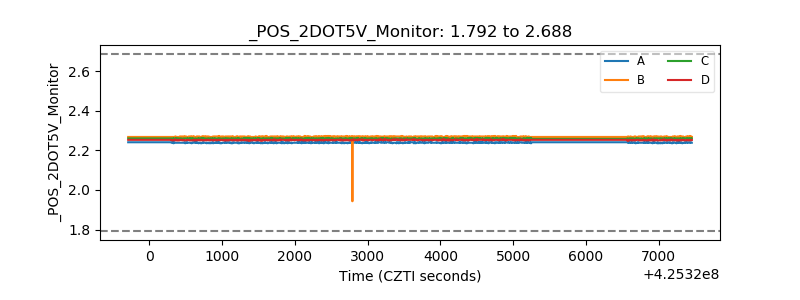 |
| +5 Volts monitor | 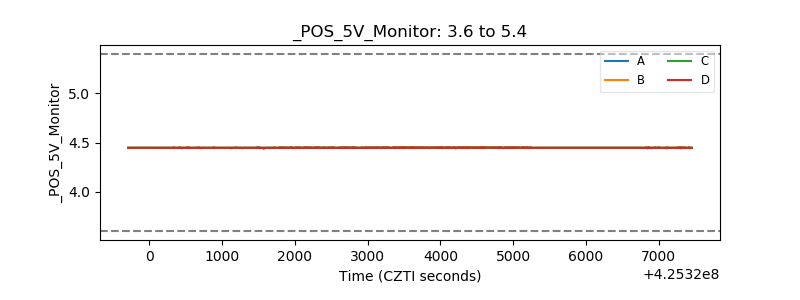 |
| _ROLL_ROT | 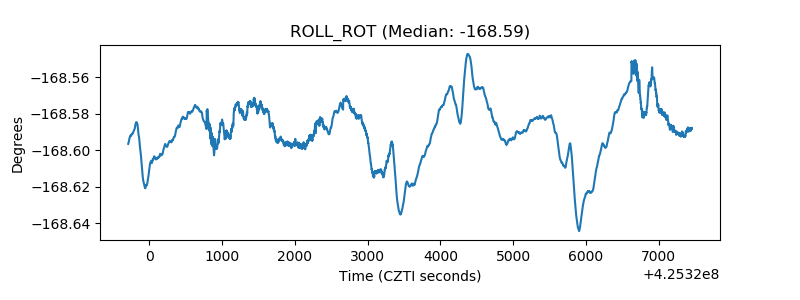 |
| _Roll_DEC | 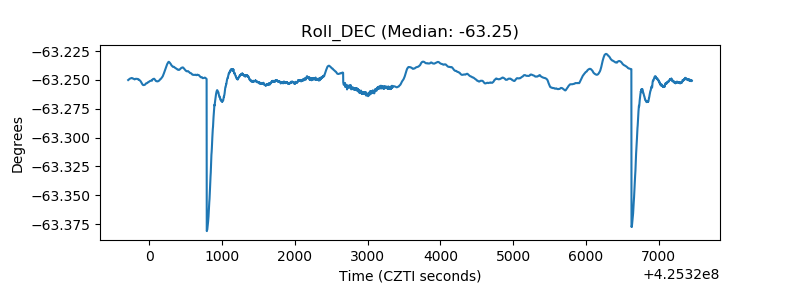 |
| _Roll_RA | 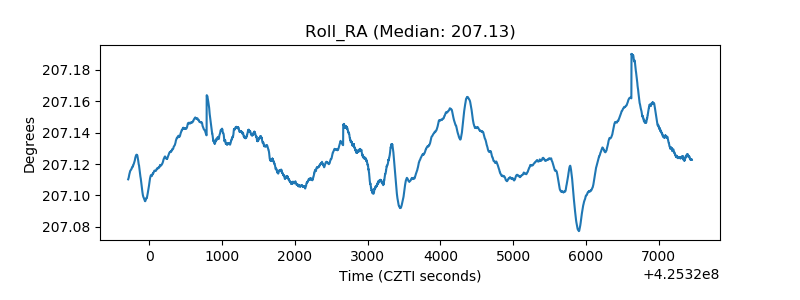 |
| Veto Counter | 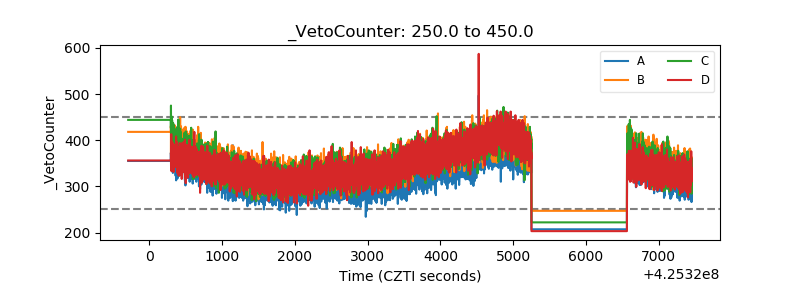 |