| Param | Original file | Final file |
|---|---|---|
| Filename | modeM0/AS1A12_099T04_9000005708_41845cztM0_level2.fits | modeM0/AS1A12_099T04_9000005708_41845cztM0_level2_quad_clean.evt |
| Size (bytes) | 1,025,035,200 | 247,366,080 |
| Size | 977.5 MB | 235.9 MB |
| Events in quadrant A | 12,261,489 | 1,617,202 |
| Events in quadrant B | 7,008,045 | 1,716,377 |
| Events in quadrant C | 8,394,940 | 1,584,980 |
| Events in quadrant D | 9,067,704 | 1,492,049 |
| Mode M0 | |||
|---|---|---|---|
| Quadrant | BADHDUFLAG | Total packets | Discarded packets |
| A | 0 | 46939 | 4 |
| B | 0 | 32112 | 4 |
| C | 0 | 35045 | 4 |
| D | 0 | 38504 | 4 |
| Mode SS | |||
|---|---|---|---|
| Quadrant | BADHDUFLAG | Total packets | Discarded packets |
| A | 0 | 318 | 0 |
| B | 0 | 318 | 0 |
| C | 0 | 318 | 0 |
| D | 0 | 318 | 0 |
| Mode M9 | |||
|---|---|---|---|
| Quadrant | BADHDUFLAG | Total packets | Discarded packets |
| A | 0 | 53 | 0 |
| B | 0 | 53 | 0 |
| C | 0 | 54 | 0 |
| D | 0 | 54 | 0 |
| Quadrant | Total seconds | Saturated seconds | Saturation percentage |
|---|---|---|---|
| A | 15640 | 922 | 5.895141% |
| B | 15640 | 72 | 0.460358% |
| C | 15639 | 458 | 2.928576% |
| D | 15639 | 465 | 2.973336% |
Noise dominated data is calculated using 1-second bins in cleaned event files. If a bin has >2000 counts, and if more than 50% of those come from <1% of pixels, then it is considered to be noise-dominated and hence unusable.
| Quadrant | # 1 sec bins | Bins with >0 counts | Bins with >2000 counts | High rate bins dominated by noise | Noise dominated (total time) | Noise dominated (detector-on time) | Marked lightcurve |
|---|---|---|---|---|---|---|---|
| A | 19818 | 15643 | 653 | 653 | 3.29% | 4.17% | 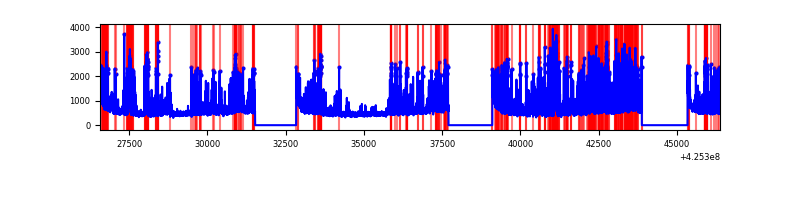 |
| B | 19818 | 15643 | 47 | 47 | 0.24% | 0.30% | 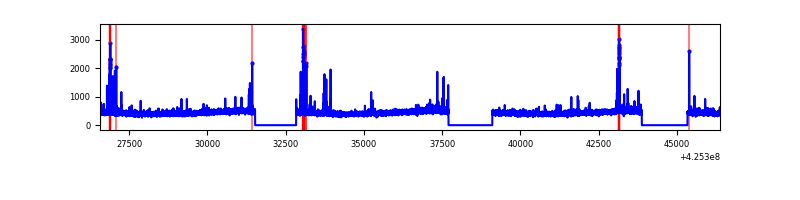 |
| C | 19817 | 15642 | 456 | 456 | 2.30% | 2.92% | 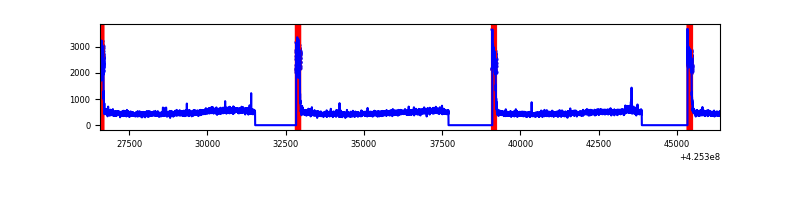 |
| D | 19817 | 15642 | 453 | 453 | 2.29% | 2.90% | 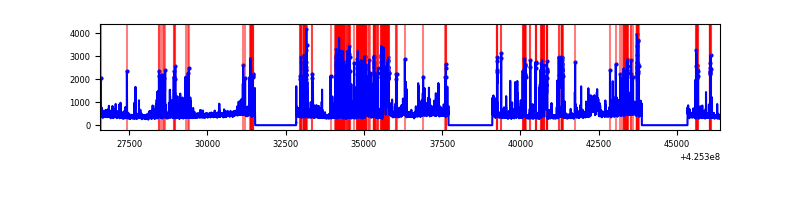 |
Top three noisy pixels from each quadrant. If the there are fewer than three noisy pixels in the level2.evt file, extra rows are filled as -1
| Pixel properties | Quadrant properties | ||||||
|---|---|---|---|---|---|---|---|
| Quadrant | DetID | PixID | Counts | Sigma | Mean | Median | Sigma |
| A | 14 | 24 | 3243085 | 9523.39 | 1661 | 1625 | 340.4 |
| A | 10 | 83 | 1378701 | 4045.84 | 1661 | 1625 | 340.4 |
| A | 2 | 79 | 1195295 | 3506.99 | 1661 | 1625 | 340.4 |
| B | 3 | 112 | 83062 | 253.11 | 1683 | 1635 | 321.7 |
| B | 4 | 141 | 69610 | 211.29 | 1683 | 1635 | 321.7 |
| B | 0 | 183 | 66077 | 200.31 | 1683 | 1635 | 321.7 |
| C | 0 | 10 | 1446638 | 3851.74 | 1620 | 1627 | 375.2 |
| C | 15 | 214 | 612086 | 1627.21 | 1620 | 1627 | 375.2 |
| C | 8 | 79 | 12269 | 28.37 | 1620 | 1627 | 375.2 |
| D | 12 | 6 | 978244 | 2476.32 | 1630 | 1585 | 394.4 |
| D | 13 | 249 | 671024 | 1697.36 | 1630 | 1585 | 394.4 |
| D | 5 | 222 | 537707 | 1359.34 | 1630 | 1585 | 394.4 |
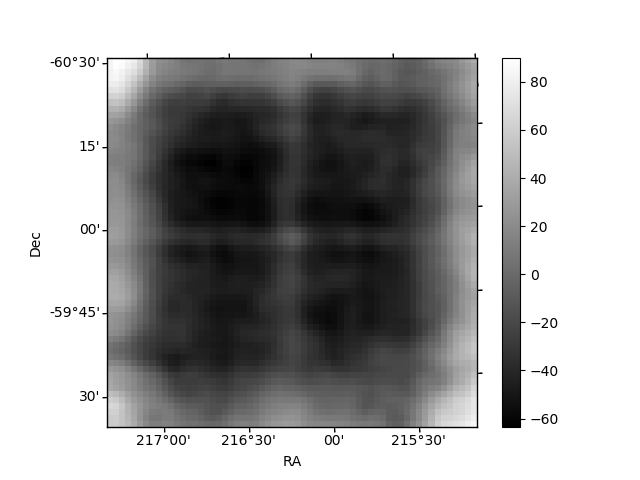
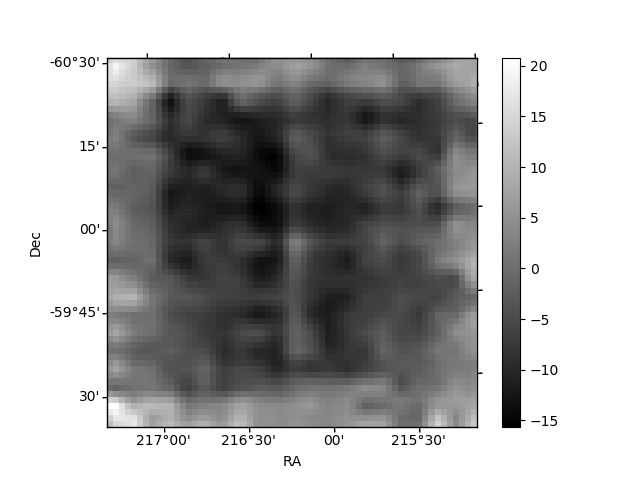
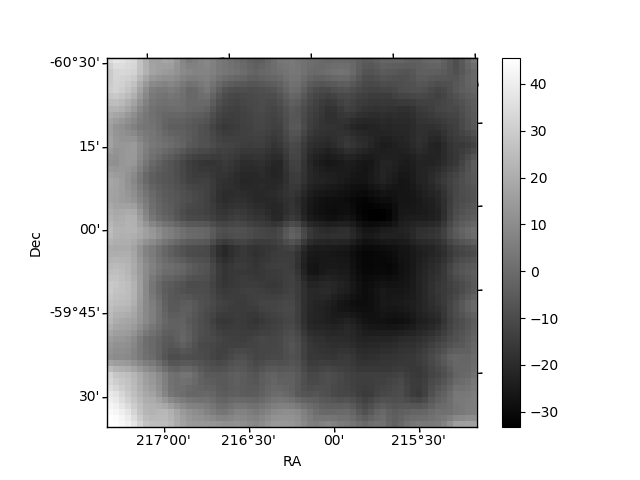
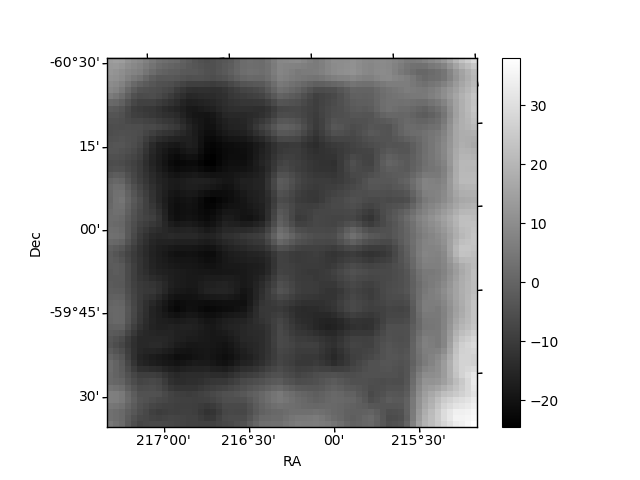
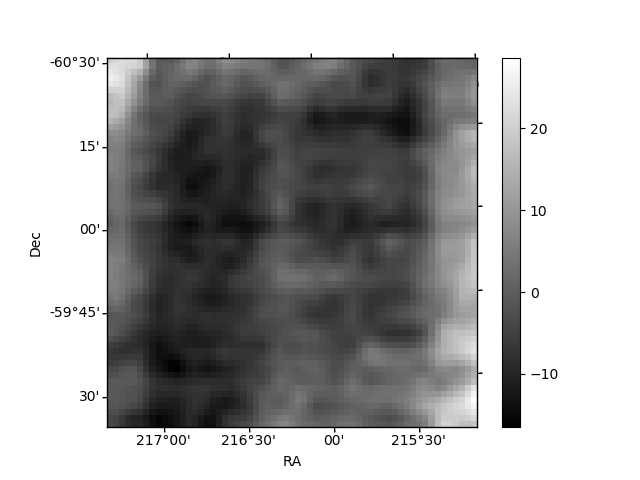
Histogram calculated using DETX and DETY for each event in the final _common_clean file
| Quadrant A | 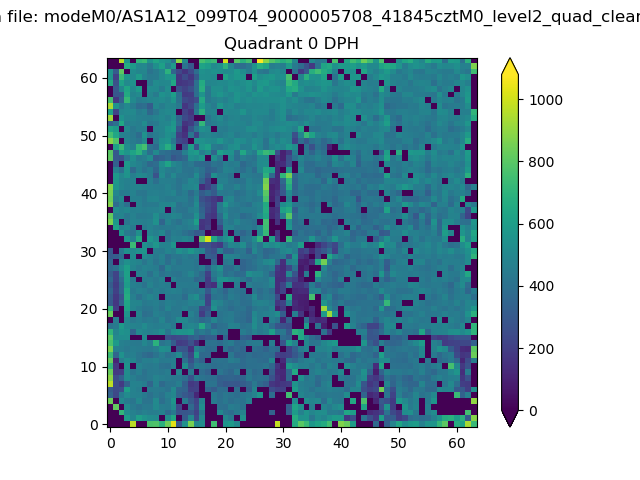 |
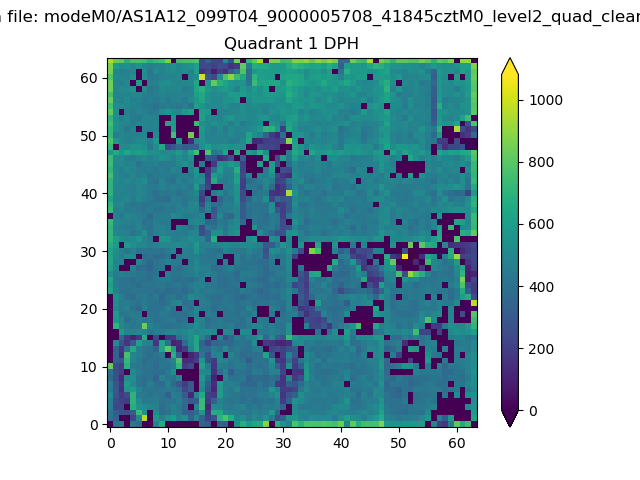 |
Quadrant B |
|---|---|---|---|
| Quadrant D | 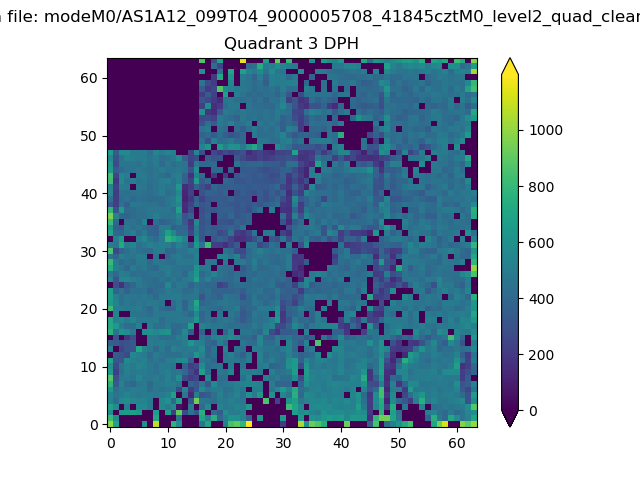 |
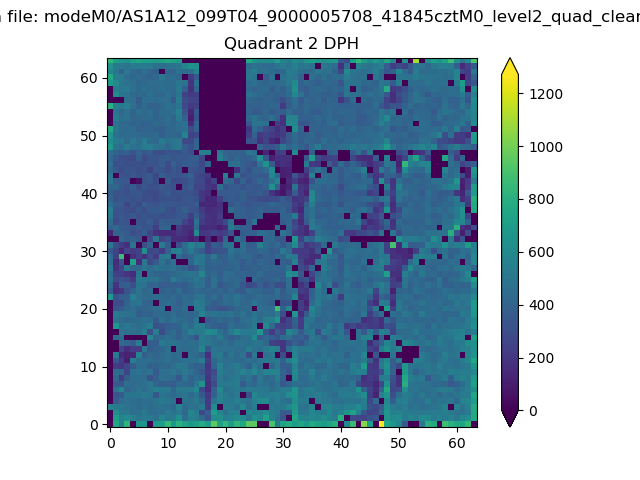 |
Quadrant C |
| Plot type | Count rate plots | Images |
|---|---|---|
| Comparison with Poisson distribution Blue bars denote a histogram of data divided into 1 sec bins. Red curve is a Poisson curve with rate = median count rate of data. |
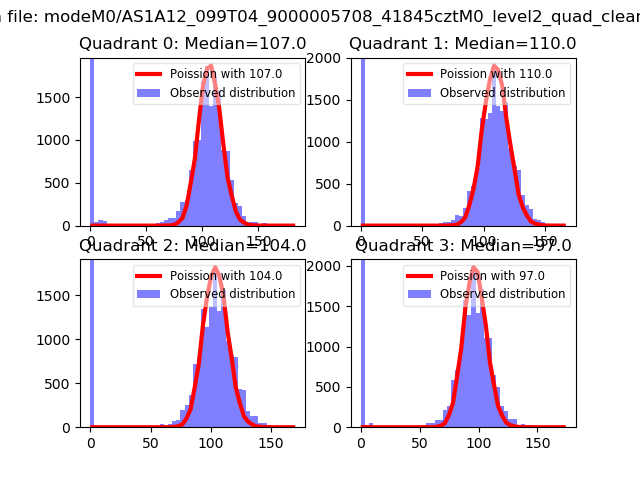 |
 |
| Quadrant-wise count rates Data is divided into 100 sec bins |
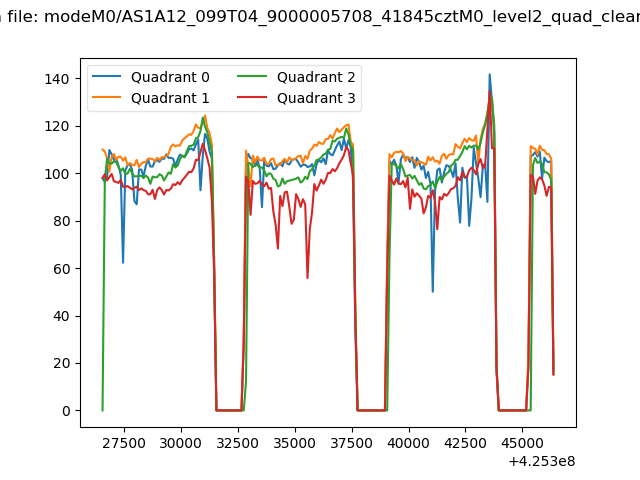 |
|
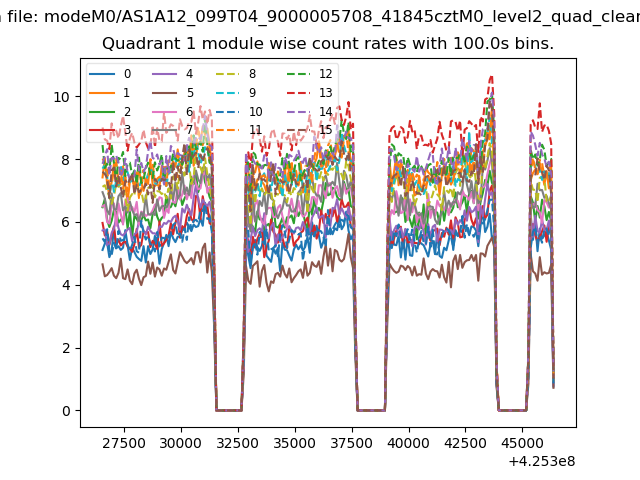
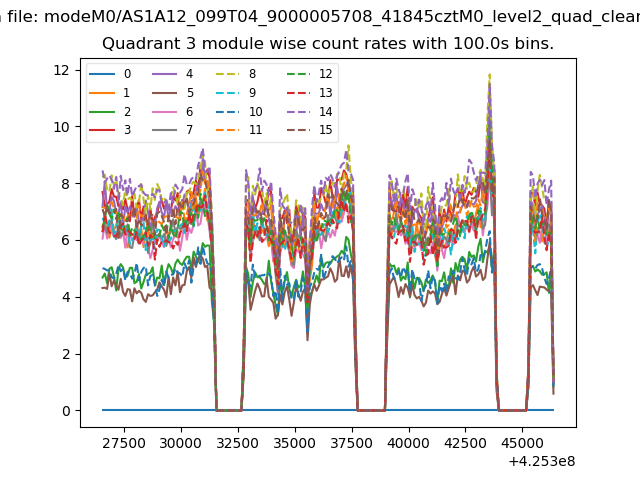
| Module-wise count rates for Quadrant A Data is divided into 100 sec bins |
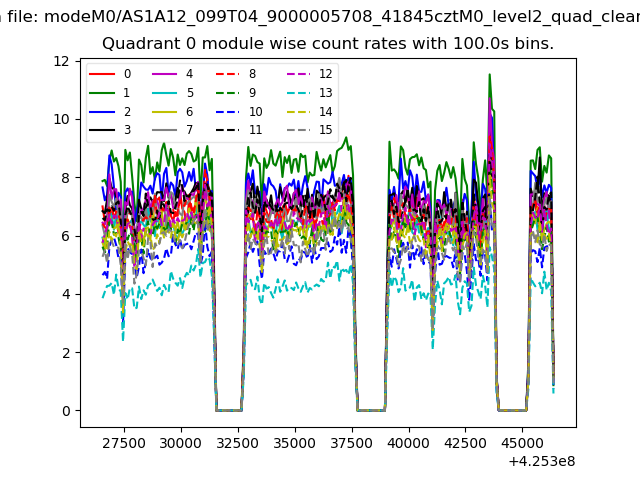 |
 |
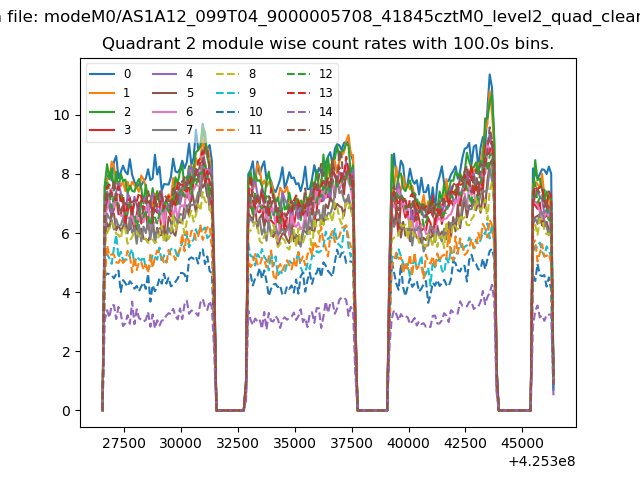
| Module-wise count rates for Quadrant B Data is divided into 100 sec bins |
 |
 |
| Module-wise count rates for Quadrant C Data is divided into 100 sec bins |
 |
 |
| Module-wise count rates for Quadrant D Data is divided into 100 sec bins |
 |
 |
| Parameter | Plot |
|---|---|
| CZT HV Monitor | 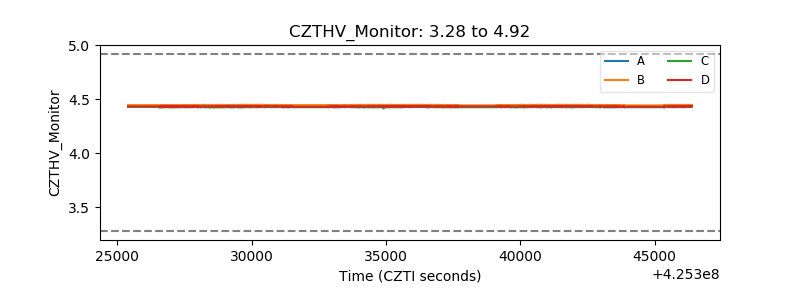 |
| D_VDD | 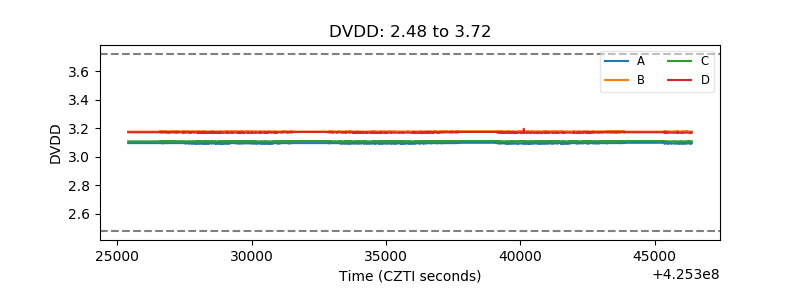 |
| Temperature 1 | 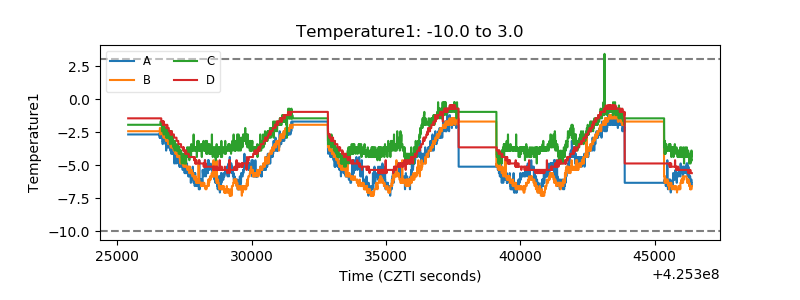 |
| Veto HV Monitor |  |
| Veto LLD | 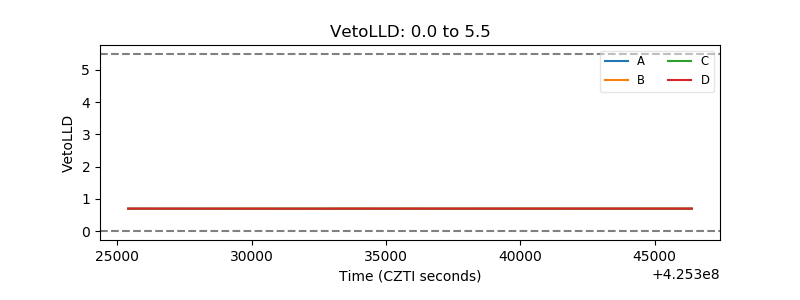 |
| Alpha Counter | 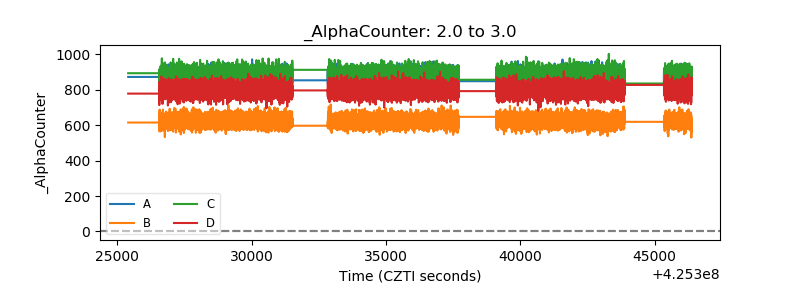 |
| _CPM_Rate | 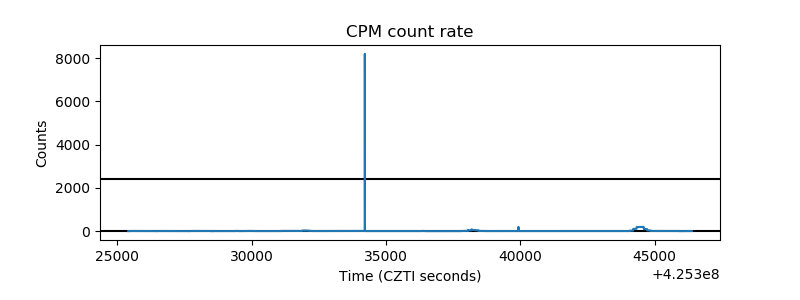 |
| CZT Counter | 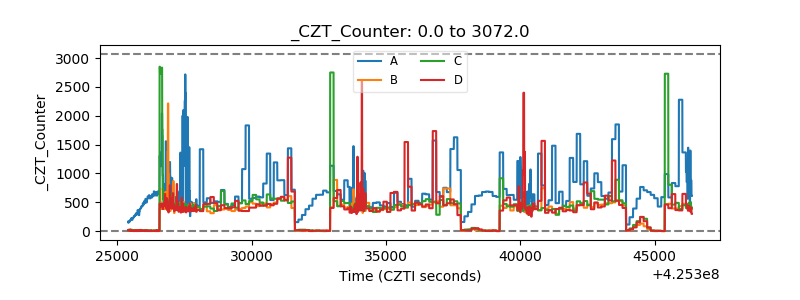 |
| +2.5 Volts monitor | 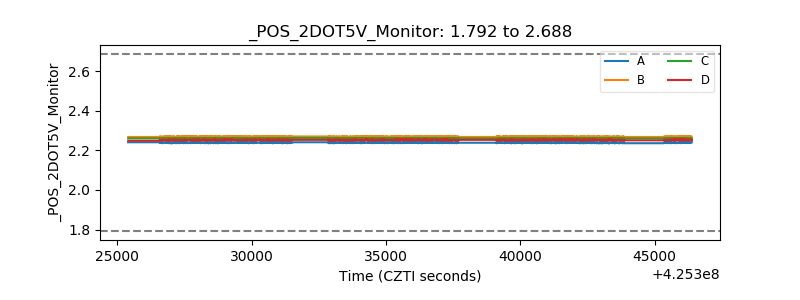 |
| +5 Volts monitor |  |
| _ROLL_ROT | 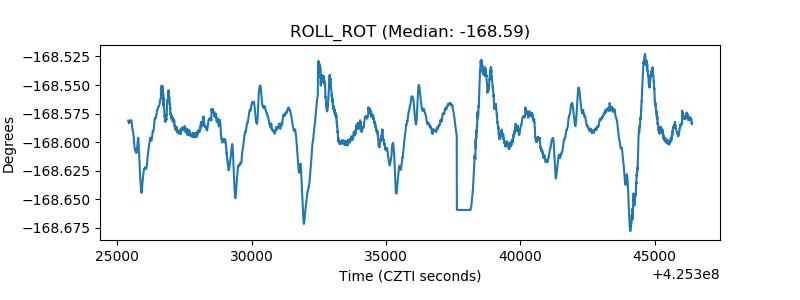 |
| _Roll_DEC | 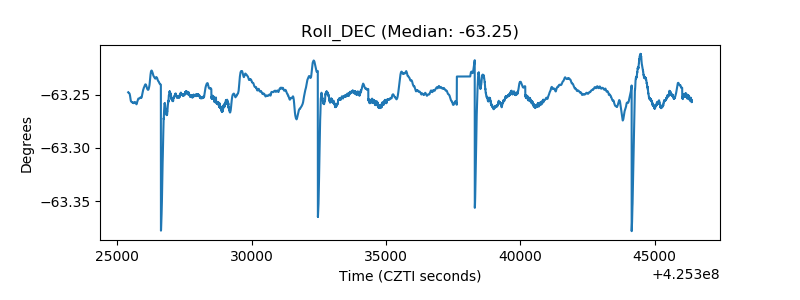 |
| _Roll_RA | 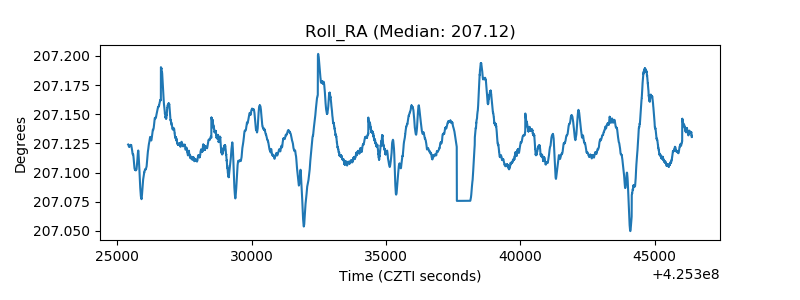 |
| Veto Counter | 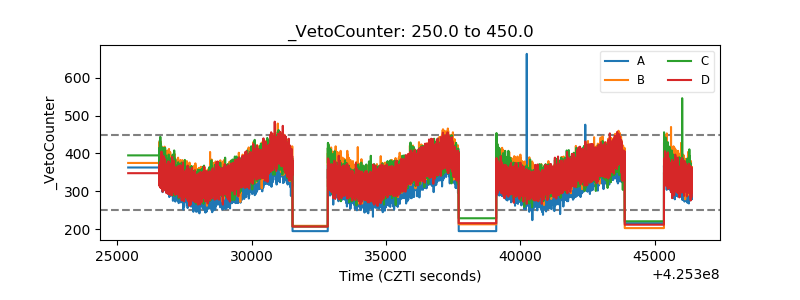 |