| Param | Original file | Final file |
|---|---|---|
| Filename | modeM0/AS1A12_099T04_9000005708_41846cztM0_level2.fits | modeM0/AS1A12_099T04_9000005708_41846cztM0_level2_quad_clean.evt |
| Size (bytes) | 406,356,480 | 97,505,280 |
| Size | 387.5 MB | 93.0 MB |
| Events in quadrant A | 5,272,270 | 643,813 |
| Events in quadrant B | 2,702,708 | 681,165 |
| Events in quadrant C | 3,342,595 | 619,091 |
| Events in quadrant D | 3,255,405 | 587,610 |
| Mode M0 | |||
|---|---|---|---|
| Quadrant | BADHDUFLAG | Total packets | Discarded packets |
| A | 0 | 19733 | 2 |
| B | 0 | 12368 | 2 |
| C | 0 | 13782 | 2 |
| D | 0 | 14298 | 3 |
| Mode SS | |||
|---|---|---|---|
| Quadrant | BADHDUFLAG | Total packets | Discarded packets |
| A | 0 | 122 | 0 |
| B | 0 | 122 | 0 |
| C | 0 | 122 | 0 |
| D | 0 | 122 | 0 |
| Mode M9 | |||
|---|---|---|---|
| Quadrant | BADHDUFLAG | Total packets | Discarded packets |
| A | 0 | 32 | 0 |
| B | 0 | 32 | 0 |
| C | 0 | 32 | 0 |
| D | 0 | 32 | 0 |
| Quadrant | Total seconds | Saturated seconds | Saturation percentage |
|---|---|---|---|
| A | 6028 | 429 | 7.116788% |
| B | 6028 | 17 | 0.282017% |
| C | 6029 | 223 | 3.698789% |
| D | 6028 | 181 | 3.002654% |
Noise dominated data is calculated using 1-second bins in cleaned event files. If a bin has >2000 counts, and if more than 50% of those come from <1% of pixels, then it is considered to be noise-dominated and hence unusable.
| Quadrant | # 1 sec bins | Bins with >0 counts | Bins with >2000 counts | High rate bins dominated by noise | Noise dominated (total time) | Noise dominated (detector-on time) | Marked lightcurve |
|---|---|---|---|---|---|---|---|
| A | 9104 | 6030 | 291 | 291 | 3.20% | 4.83% | 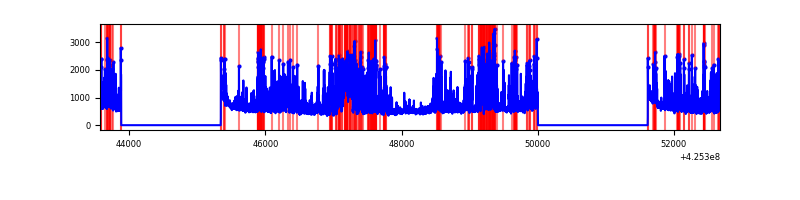 |
| B | 9104 | 6030 | 5 | 5 | 0.05% | 0.08% | 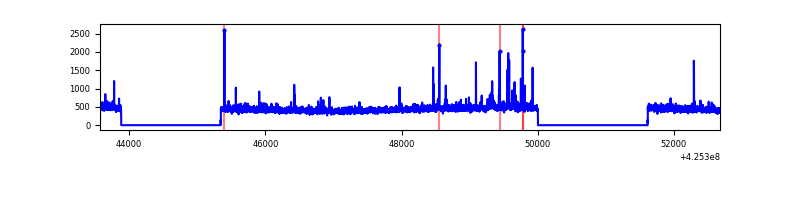 |
| C | 9105 | 6031 | 227 | 227 | 2.49% | 3.76% | 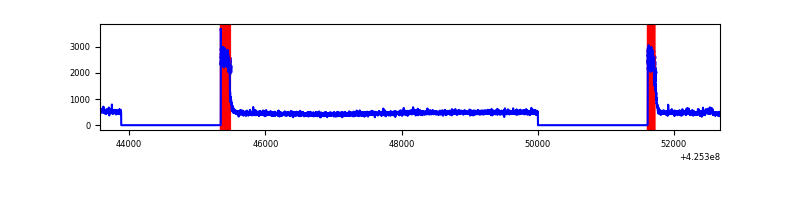 |
| D | 9104 | 6030 | 150 | 150 | 1.65% | 2.49% | 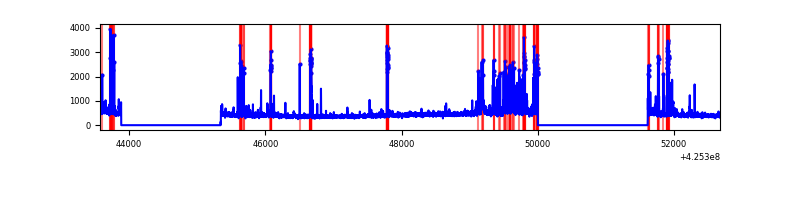 |
Top three noisy pixels from each quadrant. If the there are fewer than three noisy pixels in the level2.evt file, extra rows are filled as -1
| Pixel properties | Quadrant properties | ||||||
|---|---|---|---|---|---|---|---|
| Quadrant | DetID | PixID | Counts | Sigma | Mean | Median | Sigma |
| A | 14 | 24 | 1747544 | 13151.71 | 645 | 631 | 132.8 |
| A | 10 | 83 | 565877 | 4255.48 | 645 | 631 | 132.8 |
| A | 2 | 79 | 446222 | 3354.65 | 645 | 631 | 132.8 |
| B | 3 | 112 | 56277 | 439.77 | 655 | 637 | 126.5 |
| B | 15 | 35 | 37113 | 288.3 | 655 | 637 | 126.5 |
| B | 5 | 255 | 25371 | 195.49 | 655 | 637 | 126.5 |
| C | 0 | 10 | 631107 | 4282.86 | 629 | 632 | 147.2 |
| C | 15 | 214 | 239801 | 1624.69 | 629 | 632 | 147.2 |
| C | 0 | 207 | 19309 | 126.87 | 629 | 632 | 147.2 |
| D | 2 | 249 | 329081 | 2119.94 | 634 | 616 | 154.9 |
| D | 13 | 249 | 268878 | 1731.39 | 634 | 616 | 154.9 |
| D | 5 | 222 | 93550 | 599.8 | 634 | 616 | 154.9 |
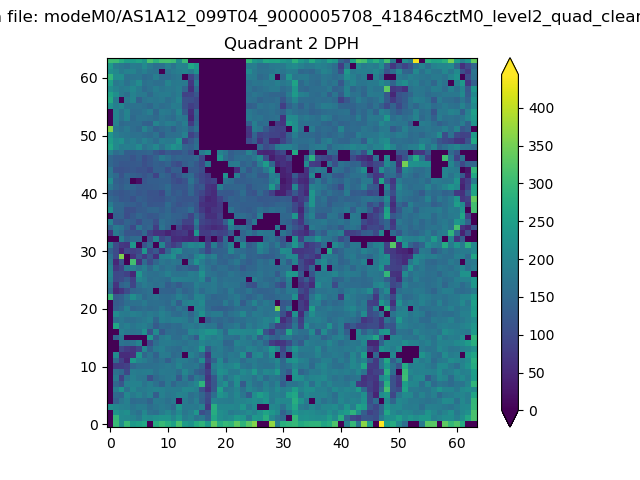
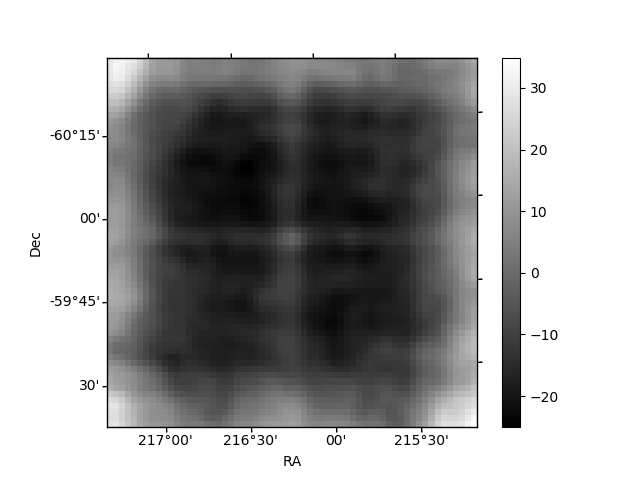
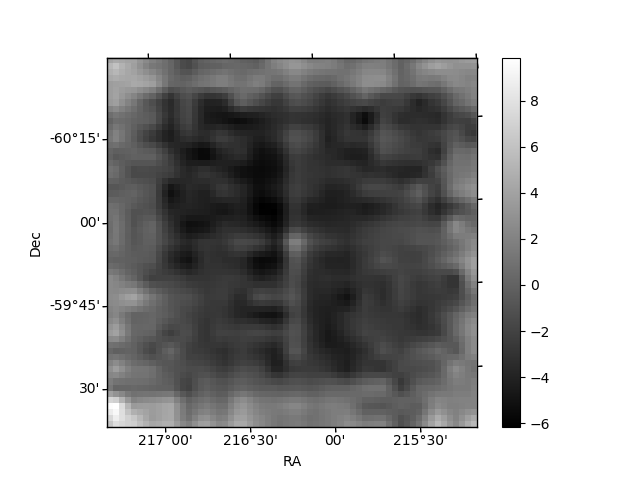
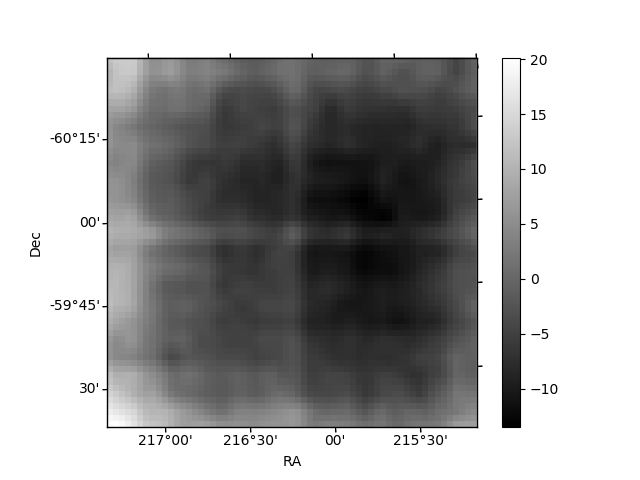
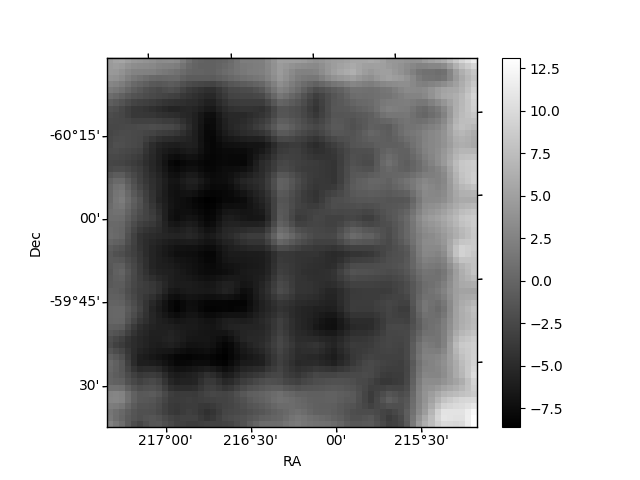
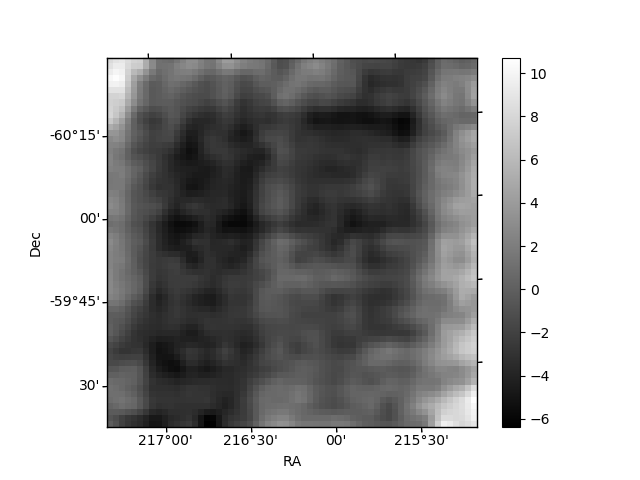
Histogram calculated using DETX and DETY for each event in the final _common_clean file
| Quadrant A | 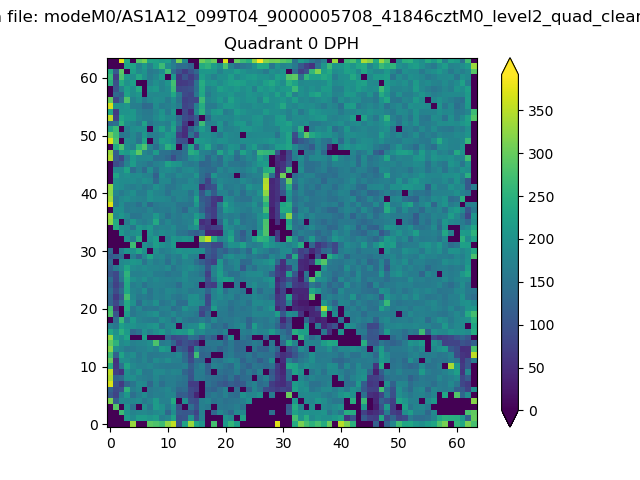 |
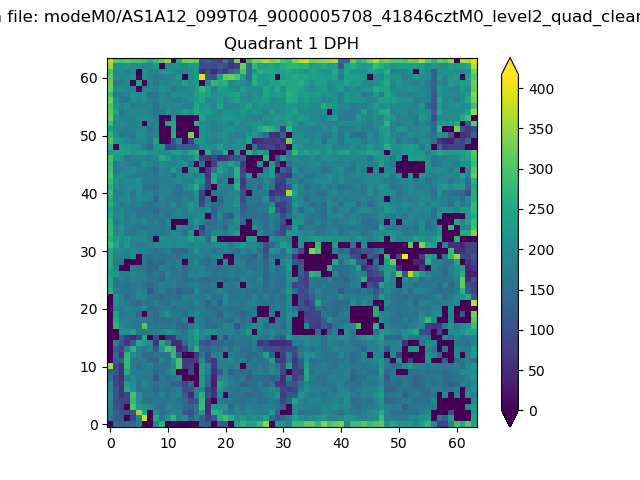 |
Quadrant B |
|---|---|---|---|
| Quadrant D | 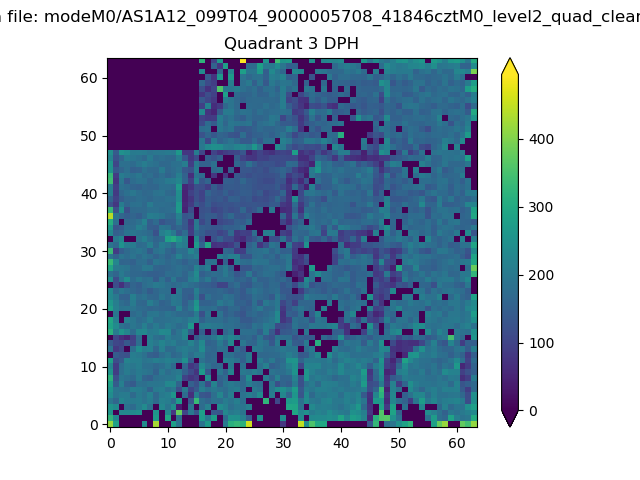 |
 |
Quadrant C |
| Plot type | Count rate plots | Images |
|---|---|---|
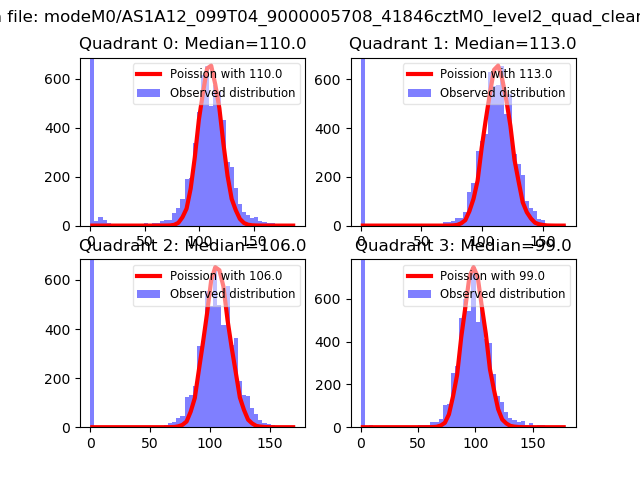
| Comparison with Poisson distribution Blue bars denote a histogram of data divided into 1 sec bins. Red curve is a Poisson curve with rate = median count rate of data. |
 |
 |
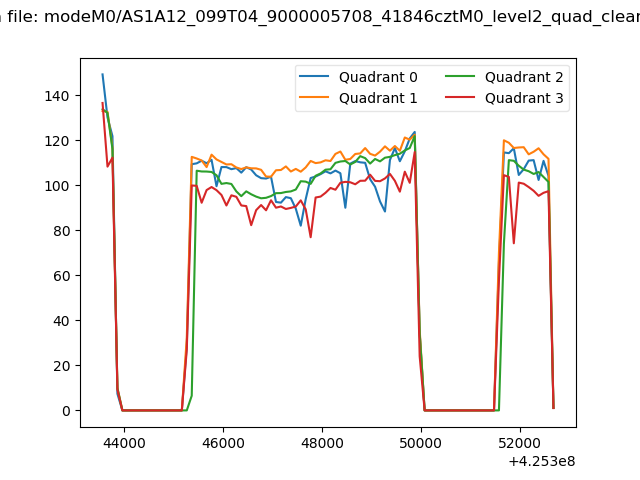
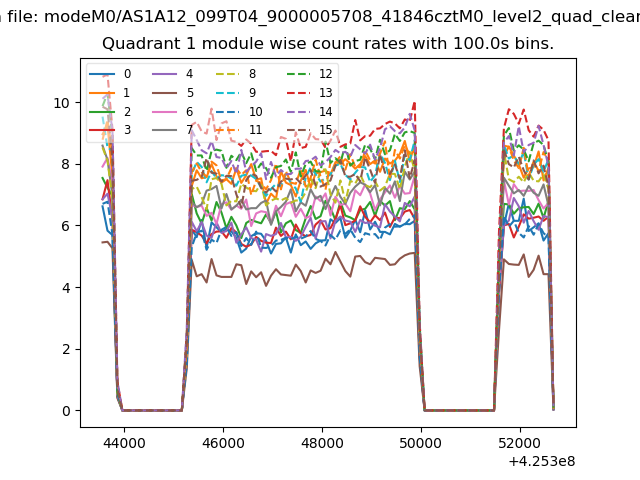
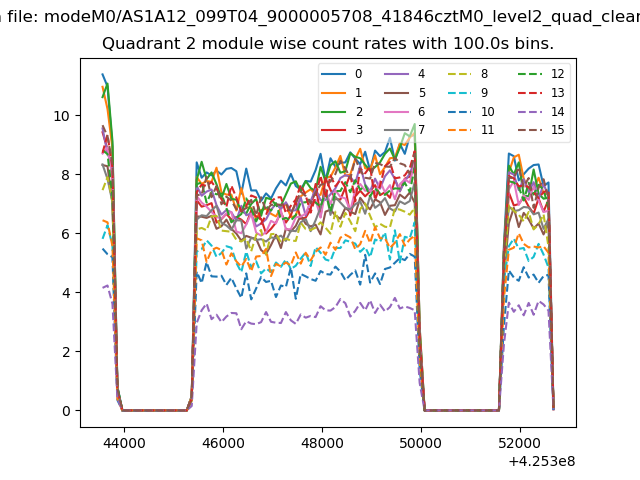
| Quadrant-wise count rates Data is divided into 100 sec bins |
 |
|
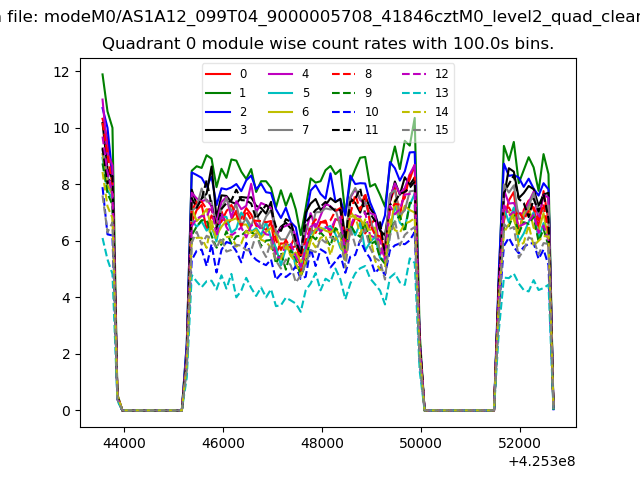
| Module-wise count rates for Quadrant A Data is divided into 100 sec bins |
 |
 |
| Module-wise count rates for Quadrant B Data is divided into 100 sec bins |
 |
 |
| Module-wise count rates for Quadrant C Data is divided into 100 sec bins |
 |
 |
| Module-wise count rates for Quadrant D Data is divided into 100 sec bins |
 |
 |
| Parameter | Plot |
|---|---|
| CZT HV Monitor | 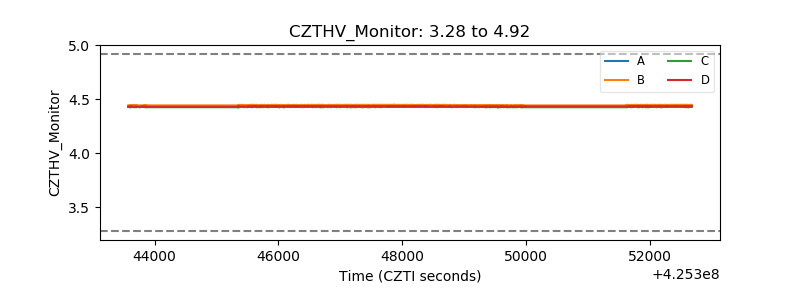 |
| D_VDD | 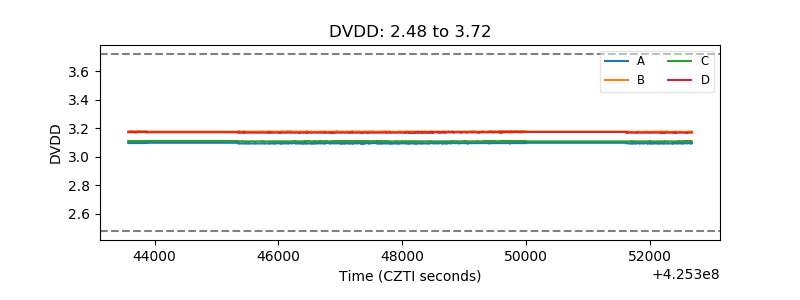 |
| Temperature 1 | 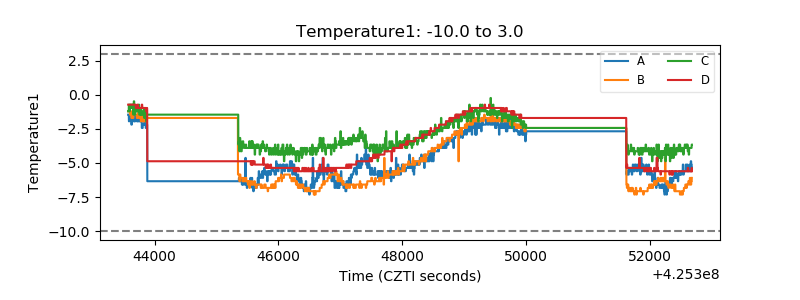 |
| Veto HV Monitor | 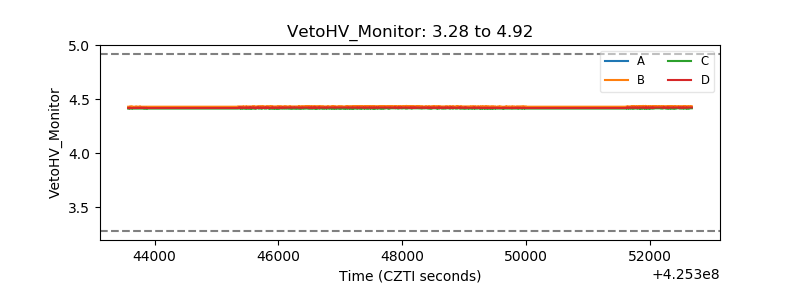 |
| Veto LLD | 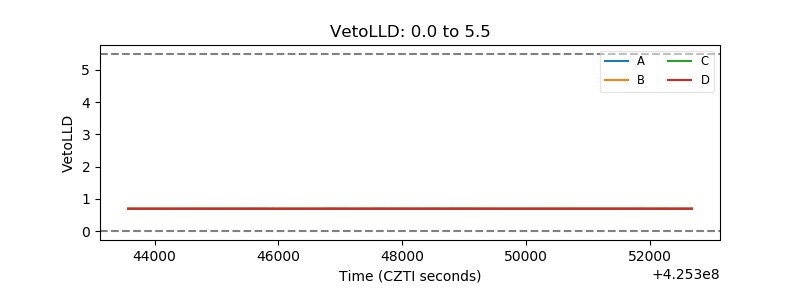 |
| Alpha Counter | 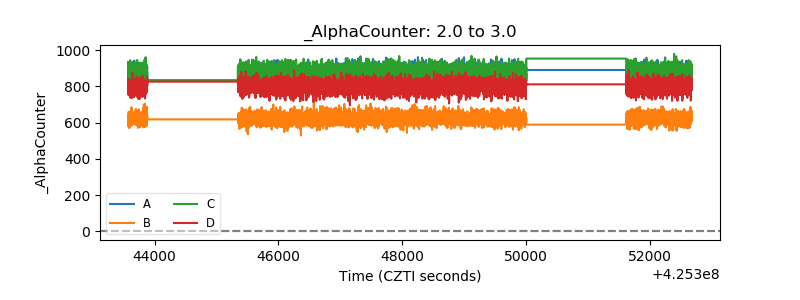 |
| _CPM_Rate | 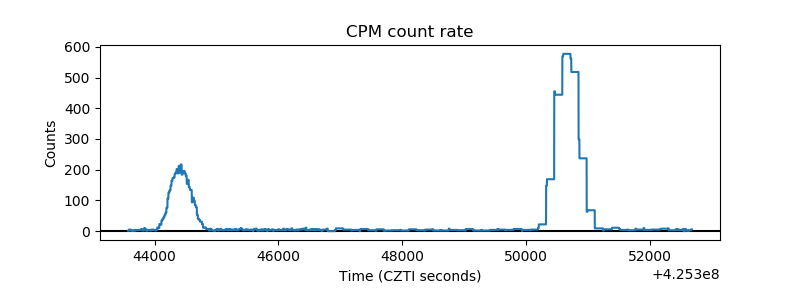 |
| CZT Counter | 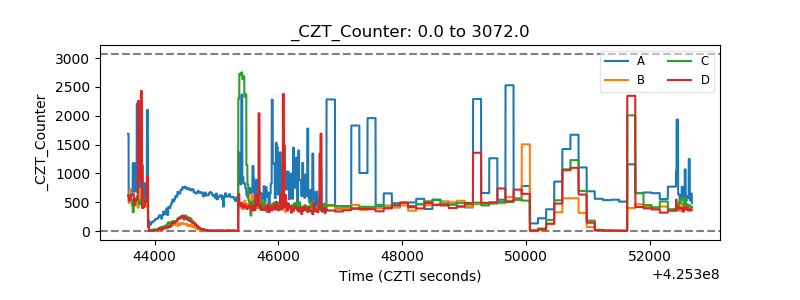 |
| +2.5 Volts monitor | 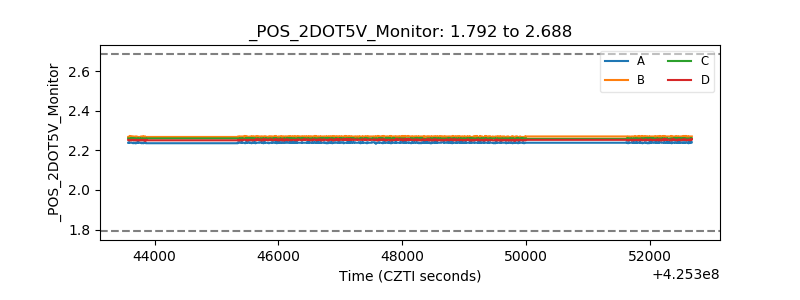 |
| +5 Volts monitor | 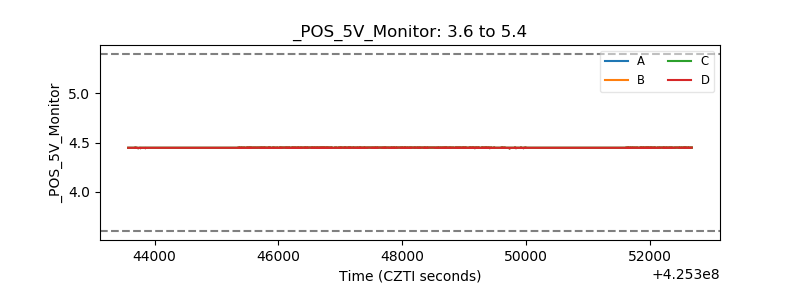 |
| _ROLL_ROT | 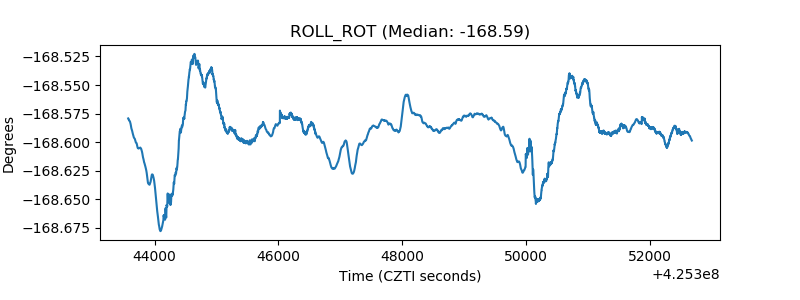 |
| _Roll_DEC | 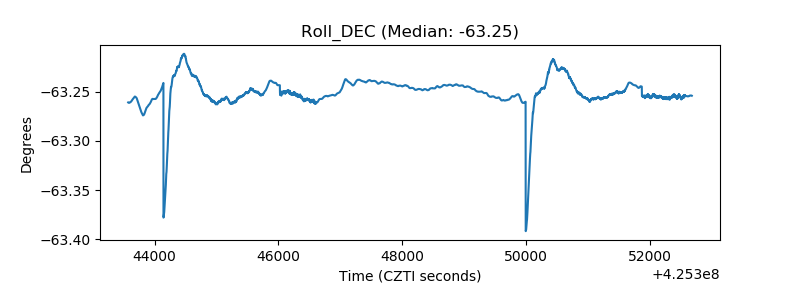 |
| _Roll_RA | 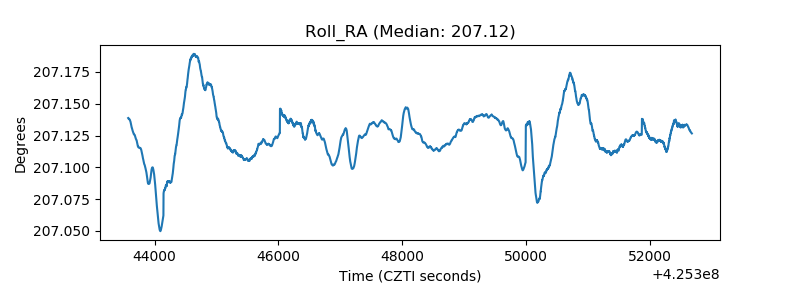 |
| Veto Counter | 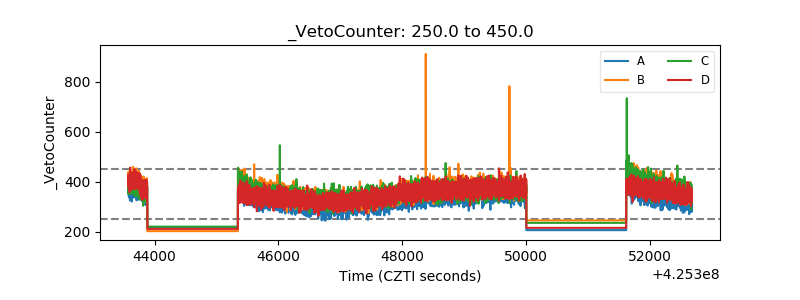 |