| Param | Original file | Final file |
|---|---|---|
| Filename | modeM0/AS1A12_099T04_9000005708_41848cztM0_level2.fits | modeM0/AS1A12_099T04_9000005708_41848cztM0_level2_quad_clean.evt |
| Size (bytes) | 372,214,080 | 91,497,600 |
| Size | 355.0 MB | 87.3 MB |
| Events in quadrant A | 4,319,150 | 612,384 |
| Events in quadrant B | 2,690,467 | 638,496 |
| Events in quadrant C | 3,159,428 | 580,310 |
| Events in quadrant D | 3,175,513 | 549,471 |
| Mode M0 | |||
|---|---|---|---|
| Quadrant | BADHDUFLAG | Total packets | Discarded packets |
| A | 0 | 16562 | 2 |
| B | 0 | 11942 | 2 |
| C | 0 | 12817 | 2 |
| D | 0 | 13546 | 2 |
| Mode SS | |||
|---|---|---|---|
| Quadrant | BADHDUFLAG | Total packets | Discarded packets |
| A | 0 | 114 | 0 |
| B | 0 | 114 | 0 |
| C | 0 | 114 | 0 |
| D | 0 | 114 | 0 |
| Mode M9 | |||
|---|---|---|---|
| Quadrant | BADHDUFLAG | Total packets | Discarded packets |
| A | 0 | 26 | 0 |
| B | 0 | 26 | 0 |
| C | 0 | 27 | 0 |
| D | 0 | 27 | 0 |
| Quadrant | Total seconds | Saturated seconds | Saturation percentage |
|---|---|---|---|
| A | 5569 | 237 | 4.255701% |
| B | 5569 | 72 | 1.292871% |
| C | 5569 | 223 | 4.004310% |
| D | 5569 | 174 | 3.124439% |
Noise dominated data is calculated using 1-second bins in cleaned event files. If a bin has >2000 counts, and if more than 50% of those come from <1% of pixels, then it is considered to be noise-dominated and hence unusable.
| Quadrant | # 1 sec bins | Bins with >0 counts | Bins with >2000 counts | High rate bins dominated by noise | Noise dominated (total time) | Noise dominated (detector-on time) | Marked lightcurve |
|---|---|---|---|---|---|---|---|
| A | 7300 | 5570 | 159 | 159 | 2.18% | 2.85% | 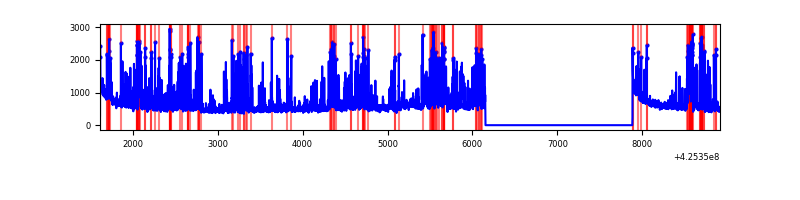 |
| B | 7300 | 5570 | 50 | 50 | 0.68% | 0.90% | 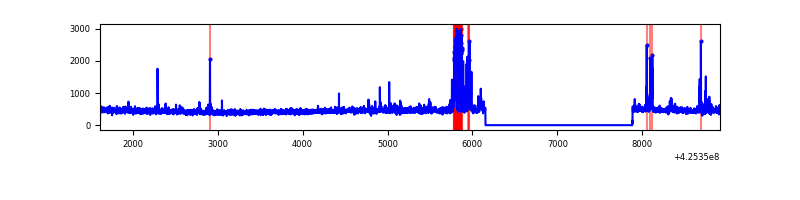 |
| C | 7300 | 5570 | 217 | 217 | 2.97% | 3.90% | 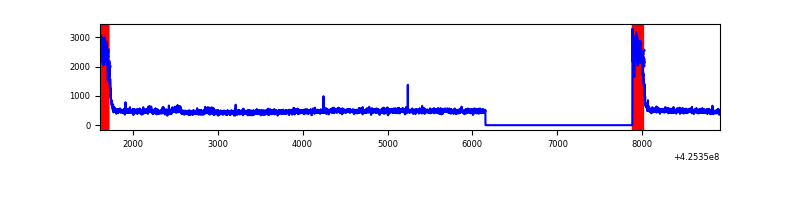 |
| D | 7300 | 5570 | 175 | 175 | 2.40% | 3.14% | 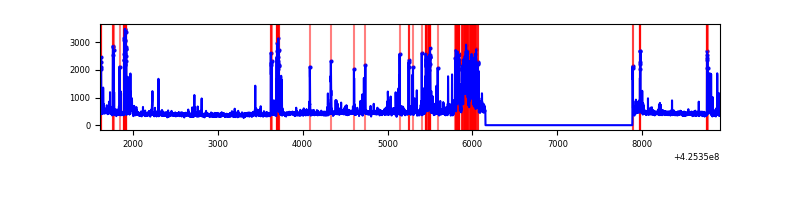 |
Top three noisy pixels from each quadrant. If the there are fewer than three noisy pixels in the level2.evt file, extra rows are filled as -1
| Pixel properties | Quadrant properties | ||||||
|---|---|---|---|---|---|---|---|
| Quadrant | DetID | PixID | Counts | Sigma | Mean | Median | Sigma |
| A | 14 | 24 | 1074650 | 8591.43 | 604 | 590 | 125.0 |
| A | 10 | 83 | 546568 | 4367.29 | 604 | 590 | 125.0 |
| A | 2 | 79 | 358102 | 2859.75 | 604 | 590 | 125.0 |
| B | 3 | 112 | 166085 | 1425.96 | 608 | 591 | 116.1 |
| B | 5 | 255 | 73252 | 626.07 | 608 | 591 | 116.1 |
| B | 0 | 186 | 52263 | 445.23 | 608 | 591 | 116.1 |
| C | 0 | 10 | 623130 | 4596.67 | 586 | 588 | 135.4 |
| C | 15 | 214 | 221128 | 1628.4 | 586 | 588 | 135.4 |
| C | 0 | 207 | 27560 | 199.15 | 586 | 588 | 135.4 |
| D | 2 | 249 | 514936 | 3550.94 | 592 | 574 | 144.9 |
| D | 13 | 249 | 207441 | 1428.12 | 592 | 574 | 144.9 |
| D | 12 | 6 | 112963 | 775.89 | 592 | 574 | 144.9 |
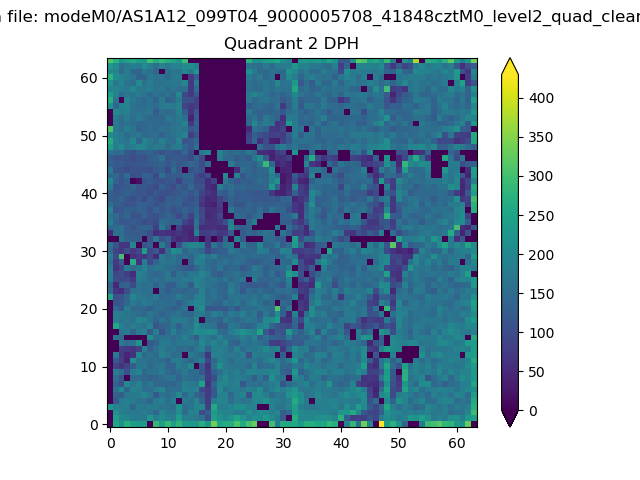
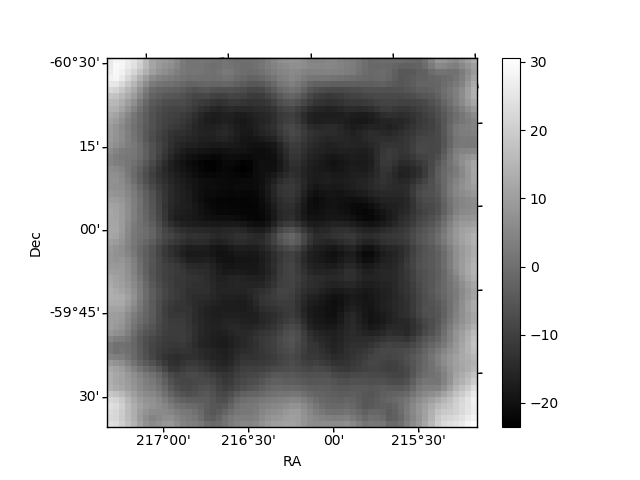
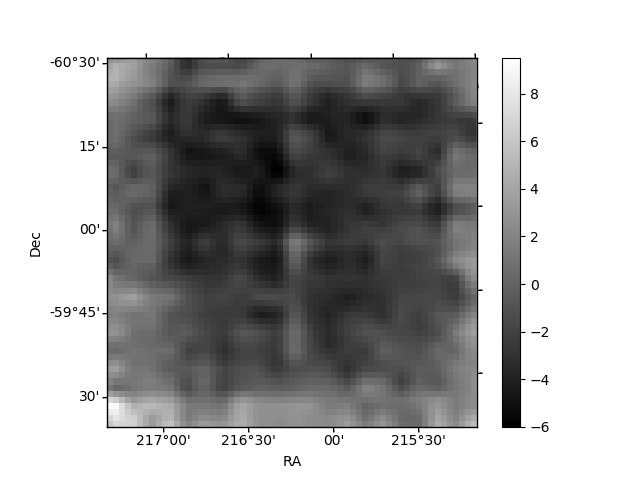
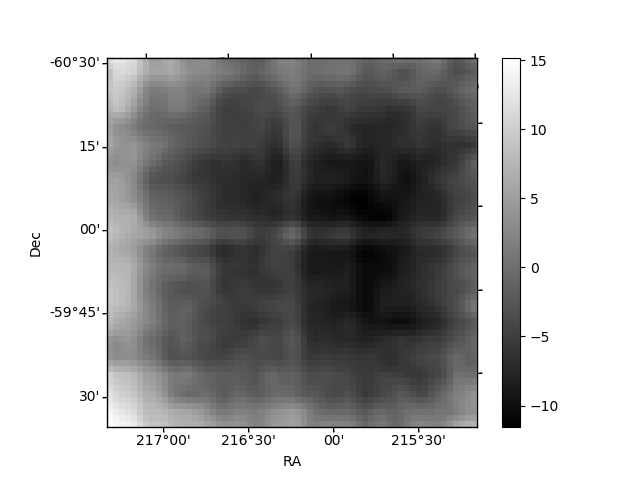
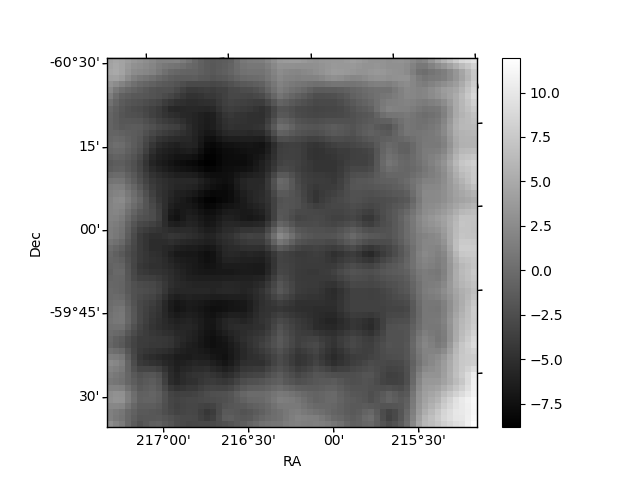
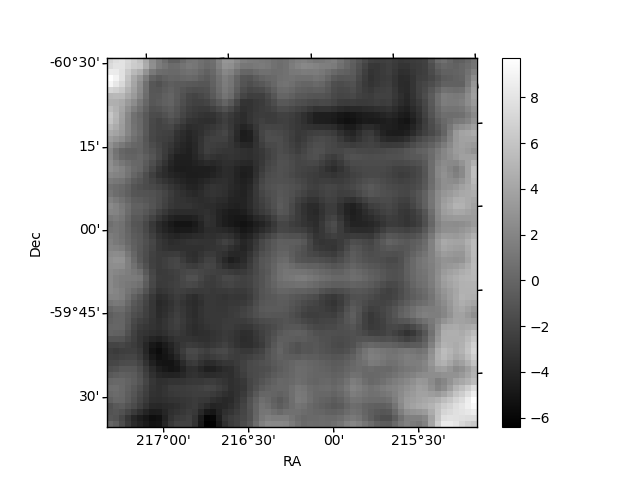
Histogram calculated using DETX and DETY for each event in the final _common_clean file
| Quadrant A | 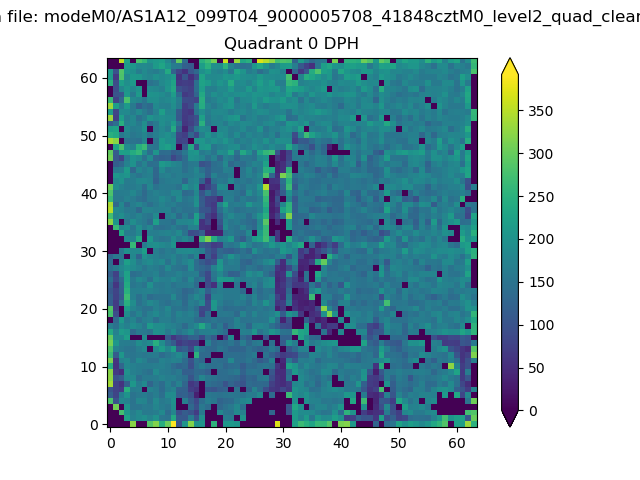 |
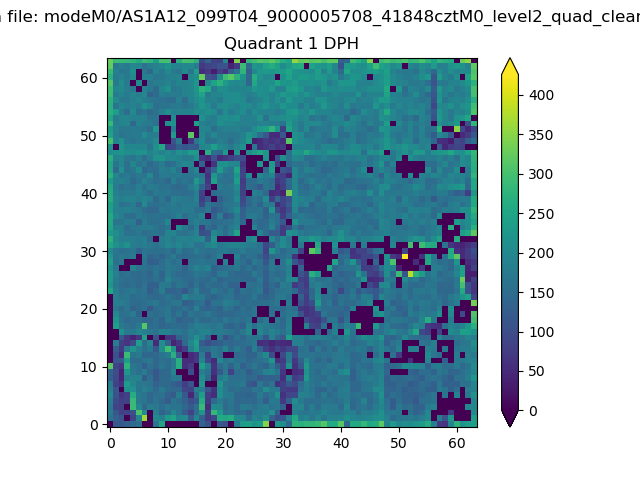 |
Quadrant B |
|---|---|---|---|
| Quadrant D | 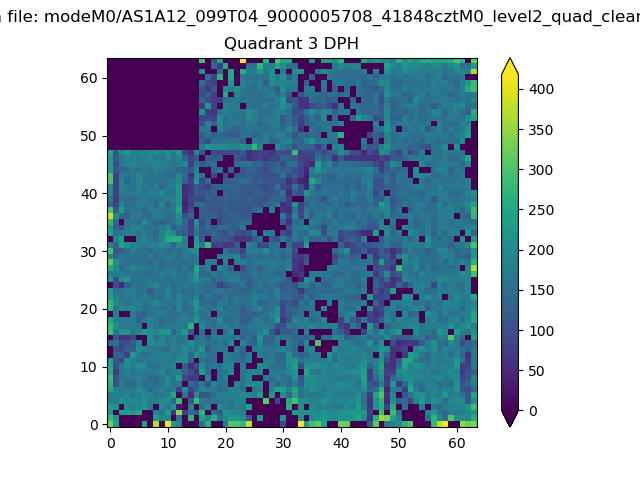 |
 |
Quadrant C |
| Plot type | Count rate plots | Images |
|---|---|---|
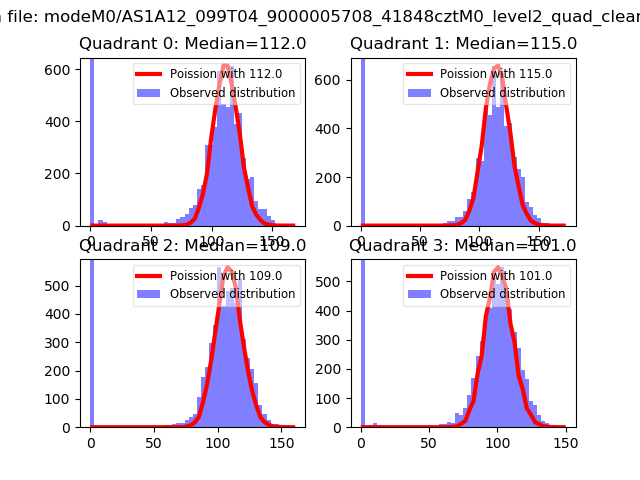
| Comparison with Poisson distribution Blue bars denote a histogram of data divided into 1 sec bins. Red curve is a Poisson curve with rate = median count rate of data. |
 |
 |
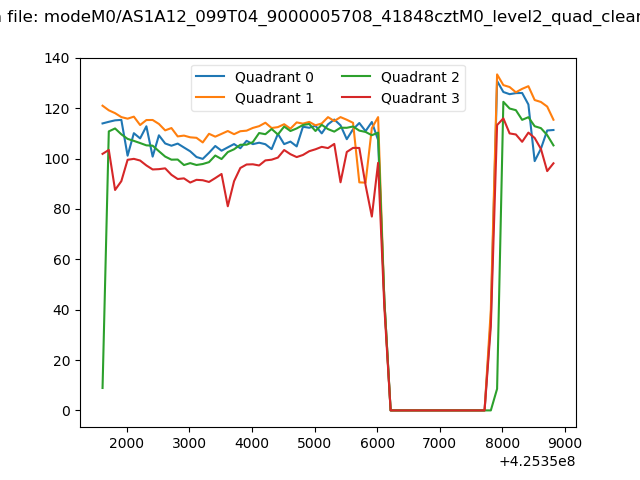
| Quadrant-wise count rates Data is divided into 100 sec bins |
 |
|
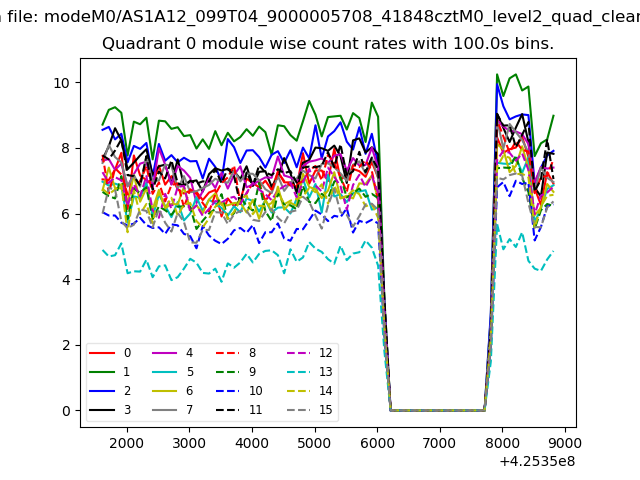
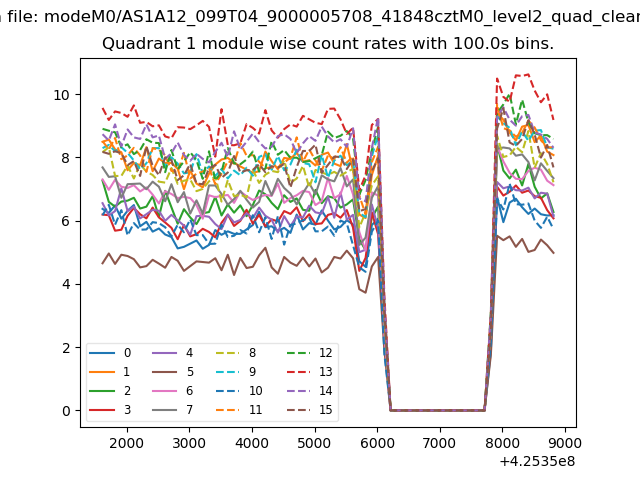
| Module-wise count rates for Quadrant A Data is divided into 100 sec bins |
 |
 |
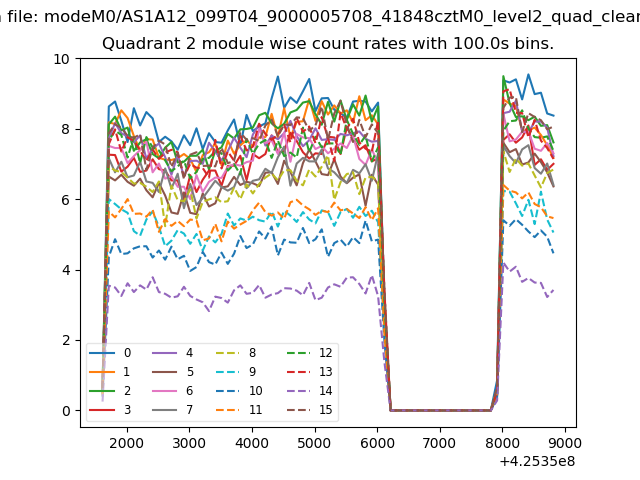
| Module-wise count rates for Quadrant B Data is divided into 100 sec bins |
 |
 |
| Module-wise count rates for Quadrant C Data is divided into 100 sec bins |
 |
 |
| Module-wise count rates for Quadrant D Data is divided into 100 sec bins |
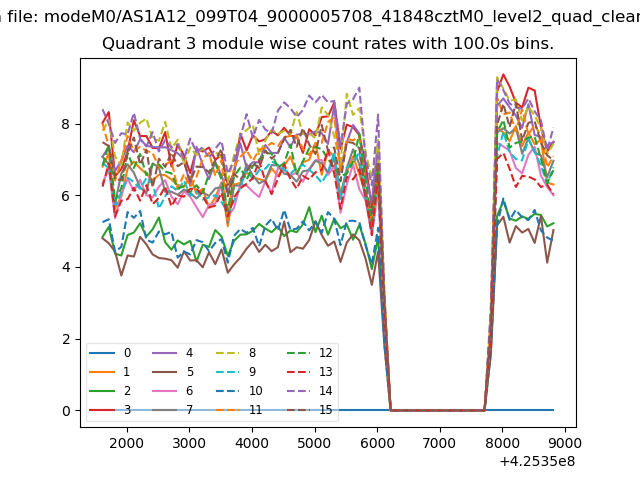 |
 |
| Parameter | Plot |
|---|---|
| CZT HV Monitor | 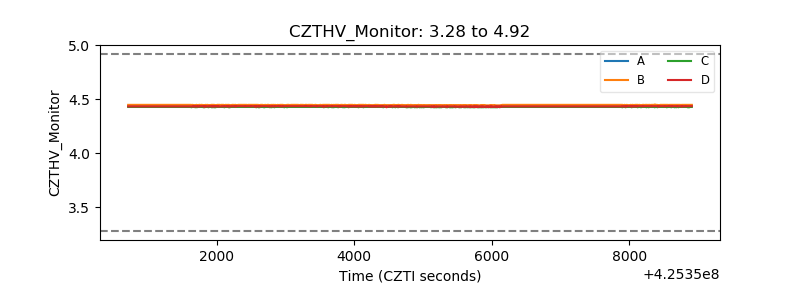 |
| D_VDD | 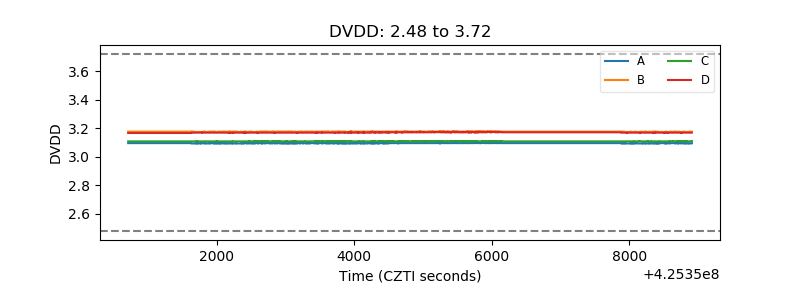 |
| Temperature 1 |  |
| Veto HV Monitor | 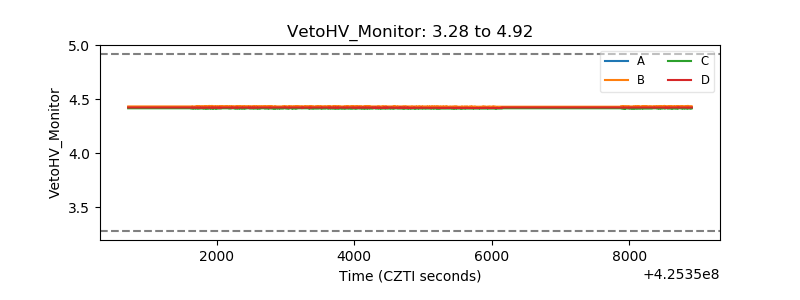 |
| Veto LLD | 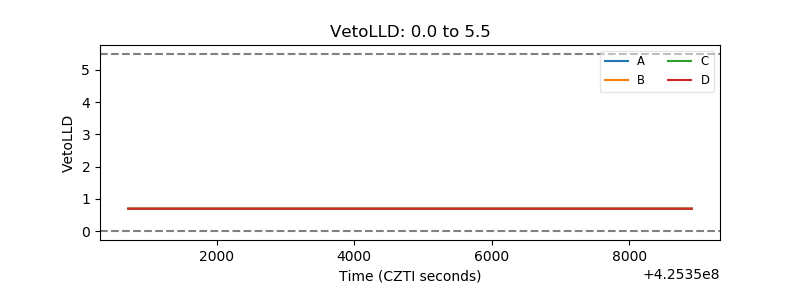 |
| Alpha Counter | 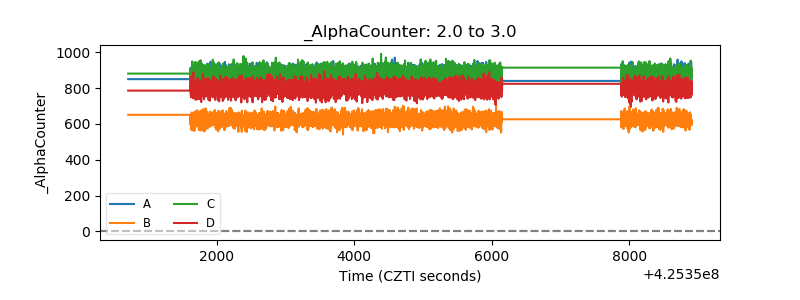 |
| _CPM_Rate | 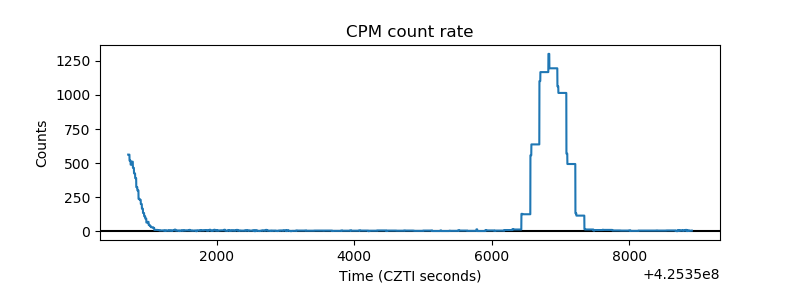 |
| CZT Counter | 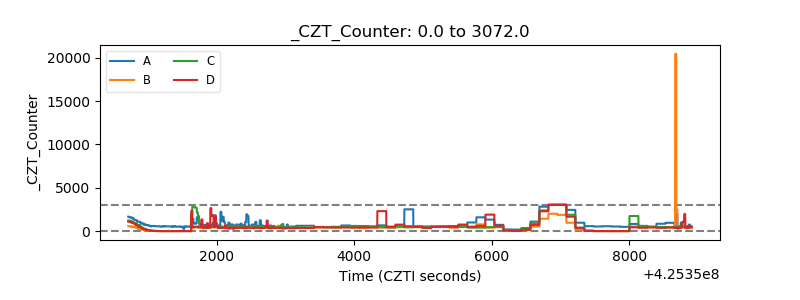 |
| +2.5 Volts monitor | 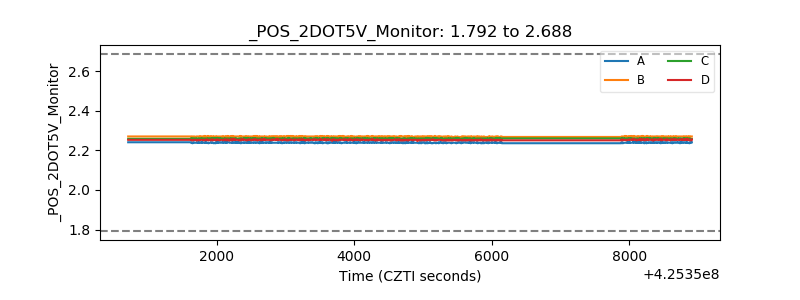 |
| +5 Volts monitor | 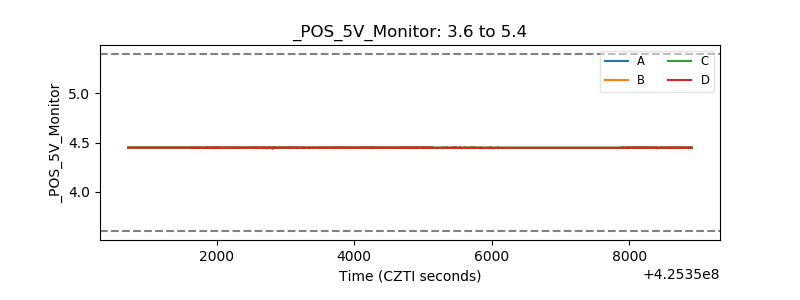 |
| _ROLL_ROT | 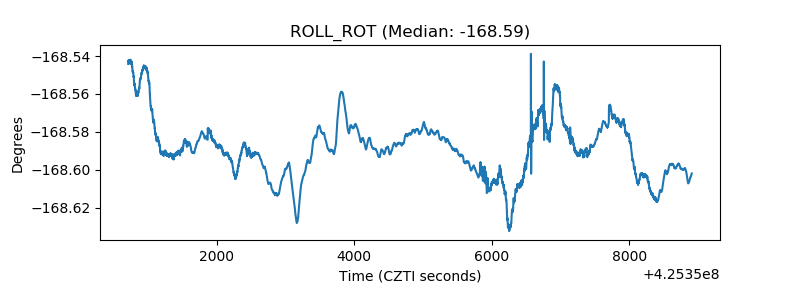 |
| _Roll_DEC | 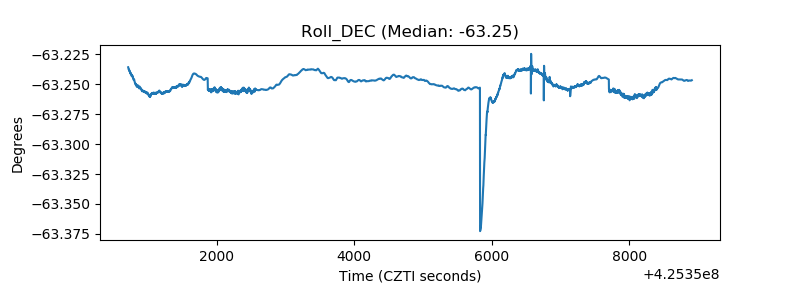 |
| _Roll_RA | 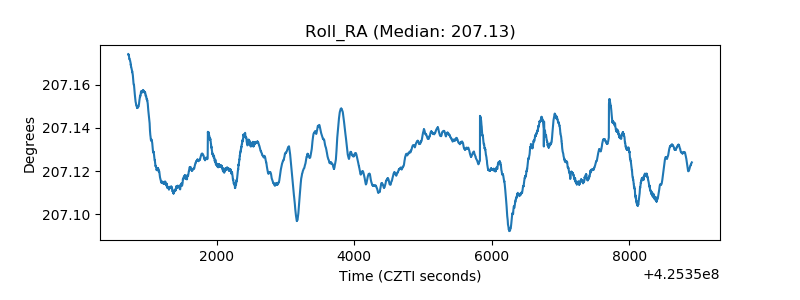 |
| Veto Counter | 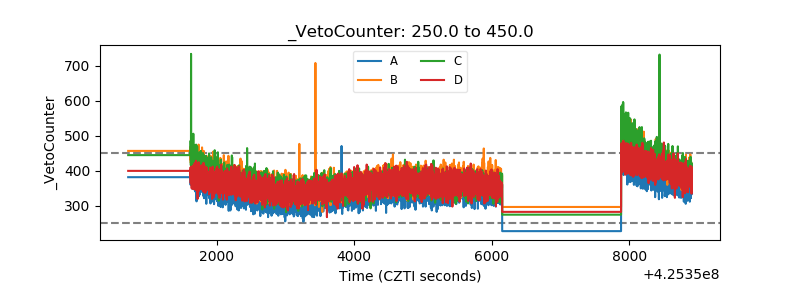 |