| Param | Original file | Final file |
|---|---|---|
| Filename | modeM0/AS1A12_099T04_9000005708_41849cztM0_level2.fits | modeM0/AS1A12_099T04_9000005708_41849cztM0_level2_quad_clean.evt |
| Size (bytes) | 536,863,680 | 81,141,120 |
| Size | 512.0 MB | 77.4 MB |
| Events in quadrant A | 4,811,640 | 576,337 |
| Events in quadrant B | 2,541,274 | 635,791 |
| Events in quadrant C | 3,195,234 | 567,769 |
| Events in quadrant D | 8,919,163 | 311,605 |
| Mode M0 | |||
|---|---|---|---|
| Quadrant | BADHDUFLAG | Total packets | Discarded packets |
| A | 0 | 17837 | 2 |
| B | 0 | 11082 | 2 |
| C | 0 | 12446 | 2 |
| D | 0 | 30092 | 3 |
| Mode SS | |||
|---|---|---|---|
| Quadrant | BADHDUFLAG | Total packets | Discarded packets |
| A | 0 | 106 | 0 |
| B | 0 | 106 | 0 |
| C | 0 | 106 | 0 |
| D | 0 | 106 | 0 |
| Mode M9 | |||
|---|---|---|---|
| Quadrant | BADHDUFLAG | Total packets | Discarded packets |
| A | 0 | 33 | 0 |
| B | 0 | 33 | 0 |
| C | 0 | 34 | 0 |
| D | 0 | 34 | 0 |
| Quadrant | Total seconds | Saturated seconds | Saturation percentage |
|---|---|---|---|
| A | 5216 | 542 | 10.391104% |
| B | 5216 | 34 | 0.651840% |
| C | 5216 | 267 | 5.118865% |
| D | 5215 | 2523 | 48.379674% |
Noise dominated data is calculated using 1-second bins in cleaned event files. If a bin has >2000 counts, and if more than 50% of those come from <1% of pixels, then it is considered to be noise-dominated and hence unusable.
| Quadrant | # 1 sec bins | Bins with >0 counts | Bins with >2000 counts | High rate bins dominated by noise | Noise dominated (total time) | Noise dominated (detector-on time) | Marked lightcurve |
|---|---|---|---|---|---|---|---|
| A | 7098 | 5217 | 382 | 382 | 5.38% | 7.32% | 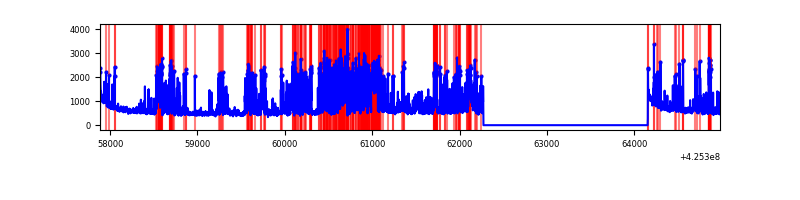 |
| B | 7098 | 5217 | 17 | 17 | 0.24% | 0.33% | 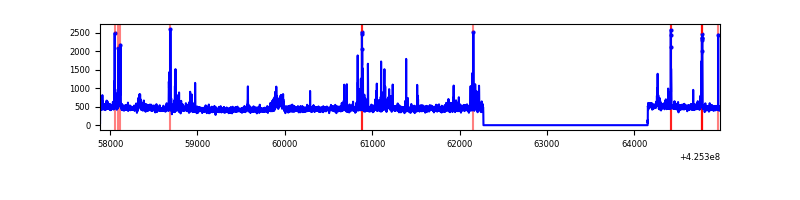 |
| C | 7098 | 5217 | 259 | 259 | 3.65% | 4.96% | 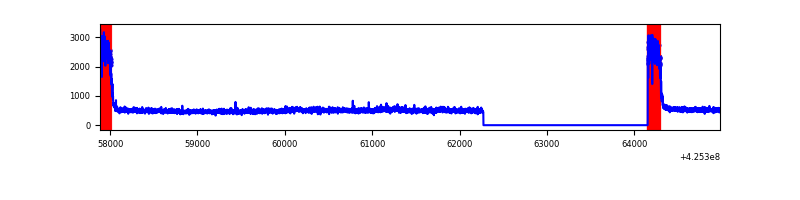 |
| D | 7097 | 5216 | 2568 | 2568 | 36.18% | 49.23% | 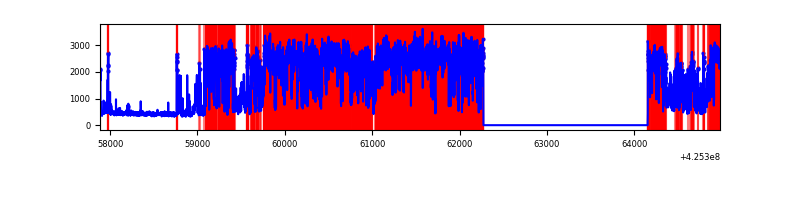 |
Top three noisy pixels from each quadrant. If the there are fewer than three noisy pixels in the level2.evt file, extra rows are filled as -1
| Pixel properties | Quadrant properties | ||||||
|---|---|---|---|---|---|---|---|
| Quadrant | DetID | PixID | Counts | Sigma | Mean | Median | Sigma |
| A | 14 | 24 | 1792290 | 15600.51 | 568 | 557 | 114.9 |
| A | 10 | 83 | 515991 | 4487.85 | 568 | 557 | 114.9 |
| A | 2 | 79 | 297436 | 2584.91 | 568 | 557 | 114.9 |
| B | 5 | 255 | 177600 | 1595.0 | 586 | 572 | 111.0 |
| B | 3 | 112 | 43515 | 386.91 | 586 | 572 | 111.0 |
| B | 15 | 35 | 19683 | 172.19 | 586 | 572 | 111.0 |
| C | 0 | 10 | 808615 | 6225.78 | 559 | 562 | 129.8 |
| C | 15 | 214 | 206060 | 1583.29 | 559 | 562 | 129.8 |
| C | 13 | 61 | 3777 | 24.77 | 559 | 562 | 129.8 |
| D | 12 | 79 | 6774406 | 60987.26 | 454 | 440 | 111.1 |
| D | 13 | 249 | 190432 | 1710.53 | 454 | 440 | 111.1 |
| D | 12 | 6 | 94263 | 844.7 | 454 | 440 | 111.1 |
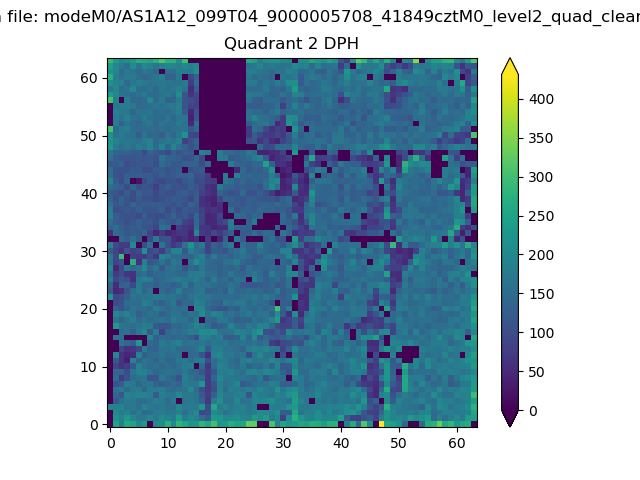
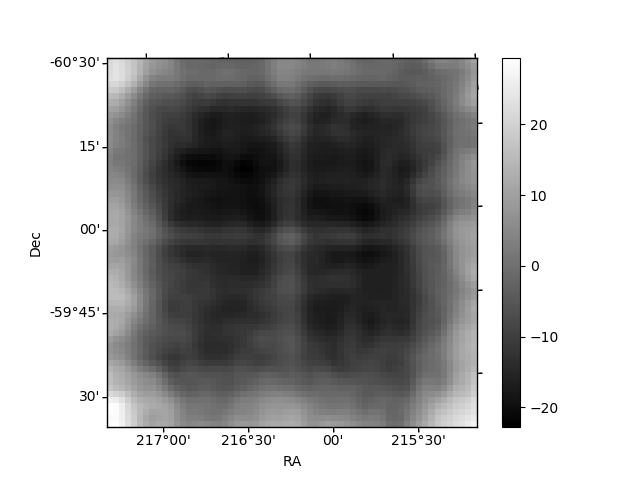
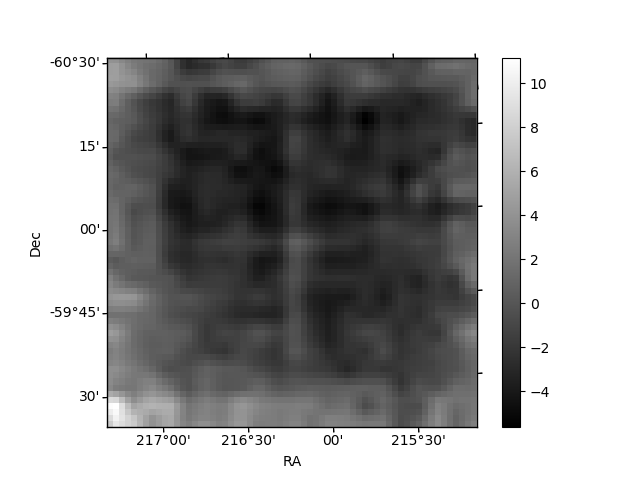
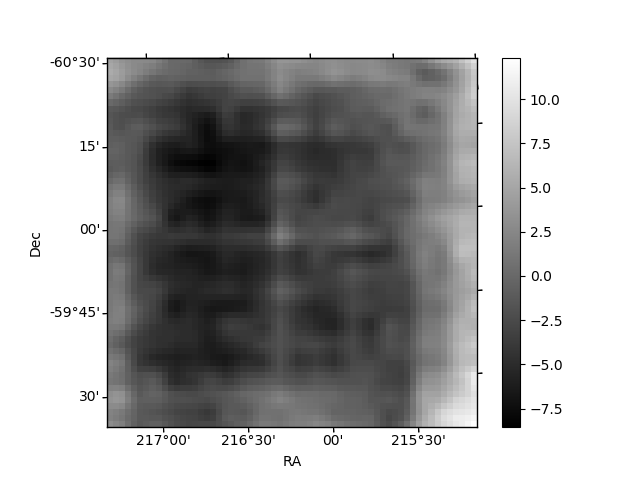
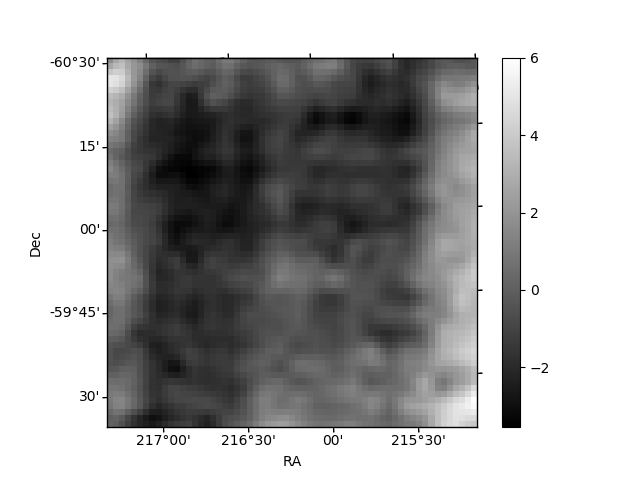
Histogram calculated using DETX and DETY for each event in the final _common_clean file
| Quadrant A | 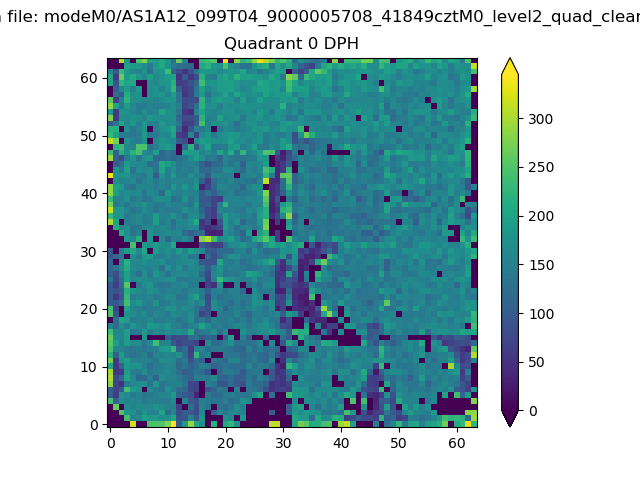 |
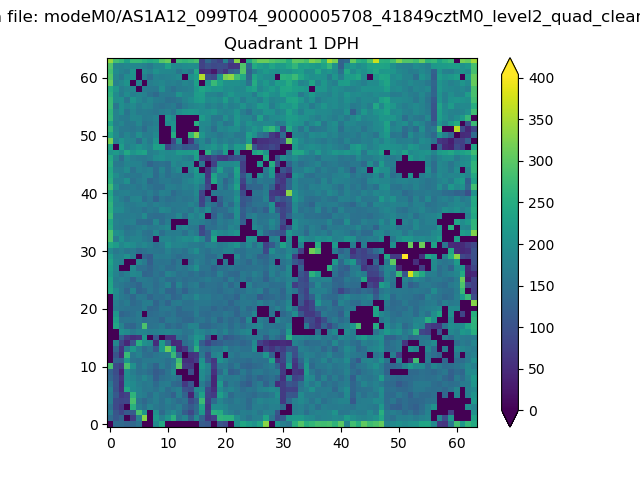 |
Quadrant B |
|---|---|---|---|
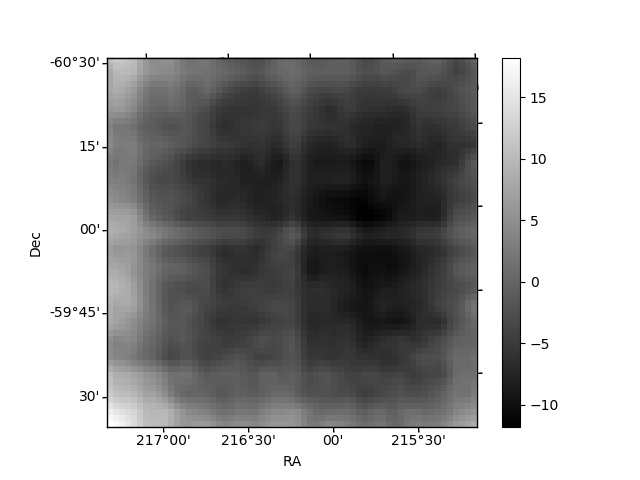
| Quadrant D | 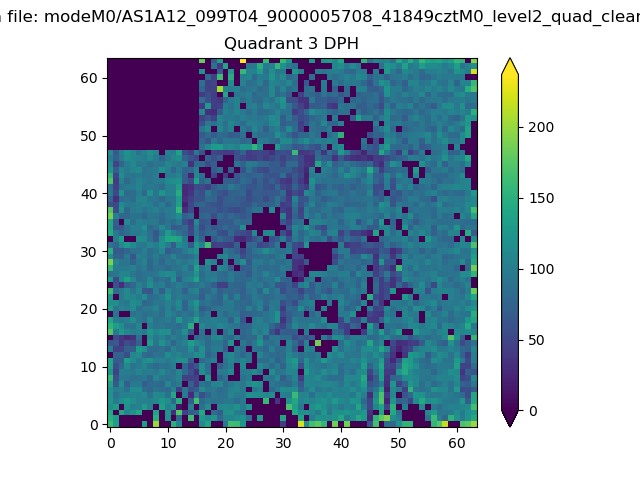 |
 |
Quadrant C |
| Plot type | Count rate plots | Images |
|---|---|---|
| Comparison with Poisson distribution Blue bars denote a histogram of data divided into 1 sec bins. Red curve is a Poisson curve with rate = median count rate of data. |
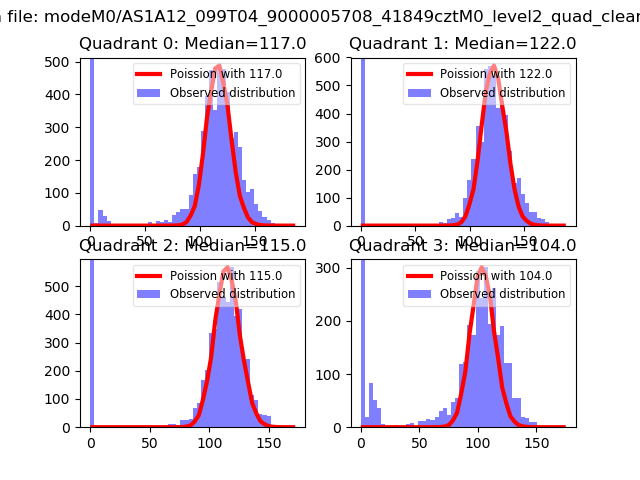 |
 |
| Quadrant-wise count rates Data is divided into 100 sec bins |
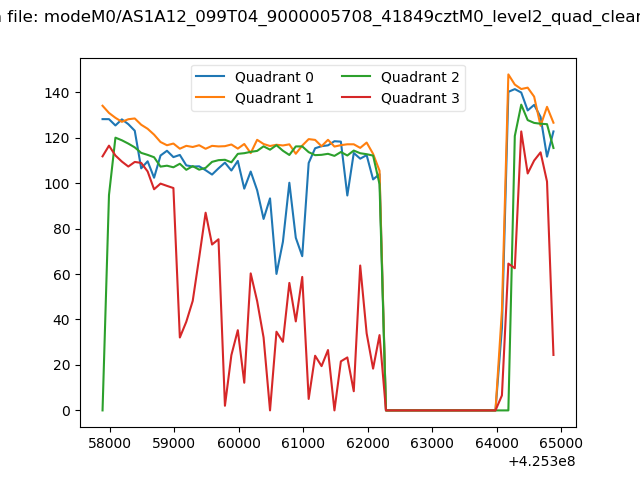 |
|
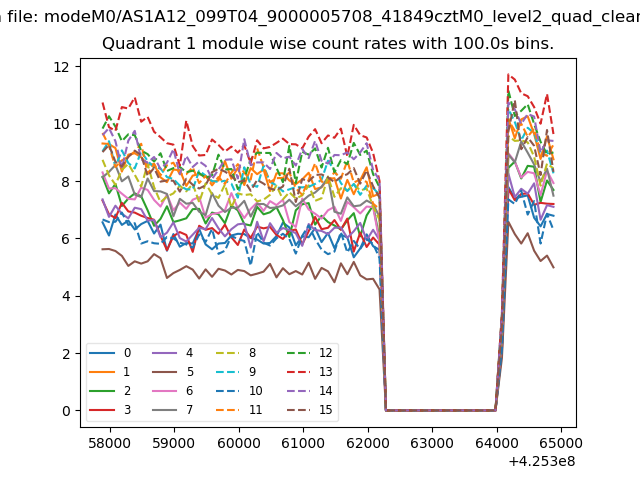
| Module-wise count rates for Quadrant A Data is divided into 100 sec bins |
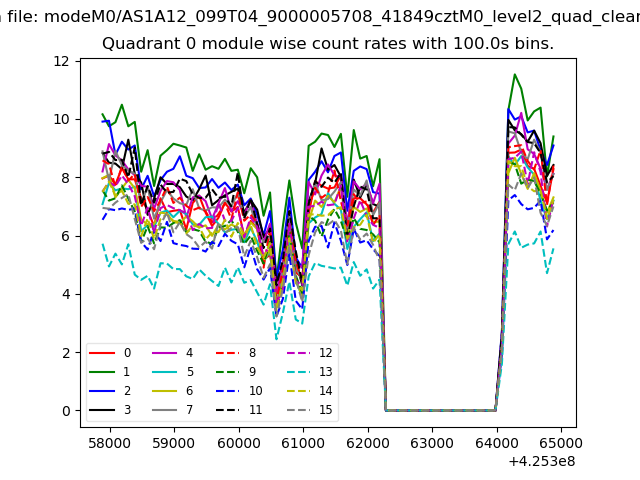 |
 |
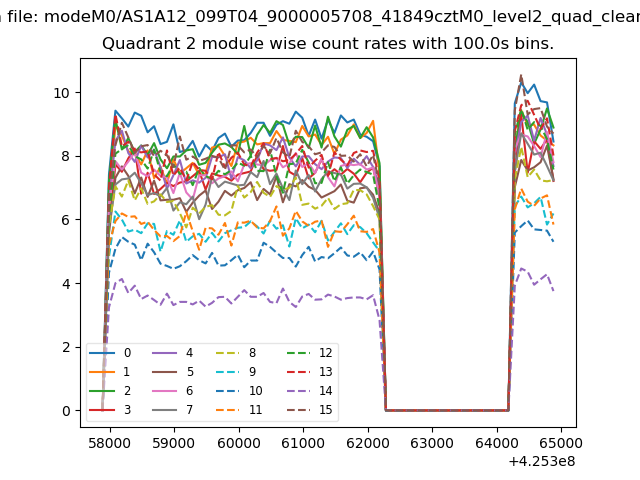
| Module-wise count rates for Quadrant B Data is divided into 100 sec bins |
 |
 |
| Module-wise count rates for Quadrant C Data is divided into 100 sec bins |
 |
 |
| Module-wise count rates for Quadrant D Data is divided into 100 sec bins |
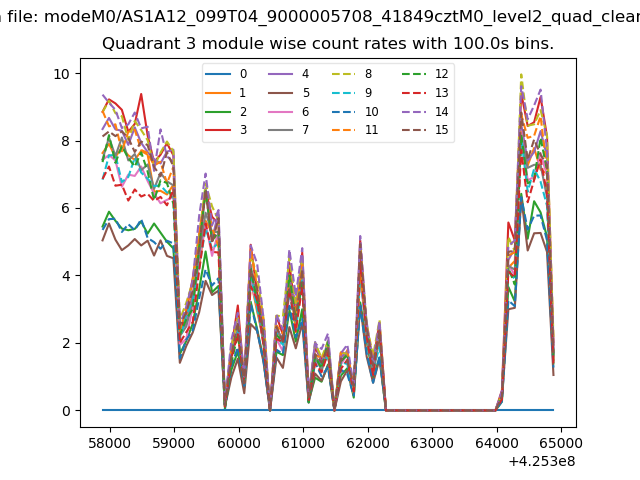 |
 |
| Parameter | Plot |
|---|---|
| CZT HV Monitor | 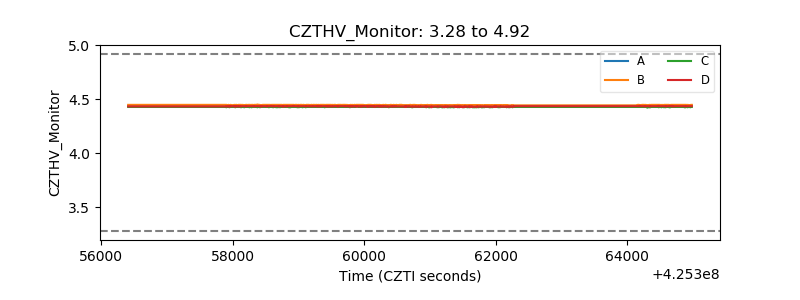 |
| D_VDD | 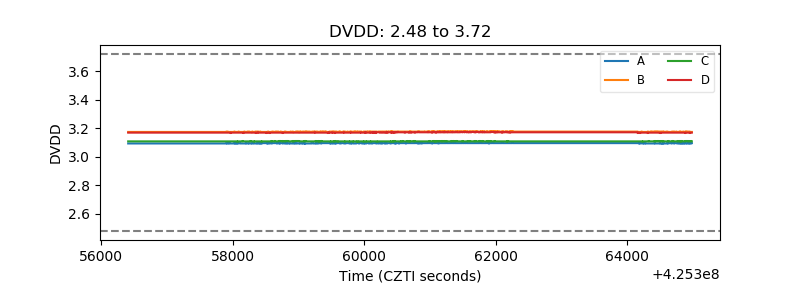 |
| Temperature 1 |  |
| Veto HV Monitor | 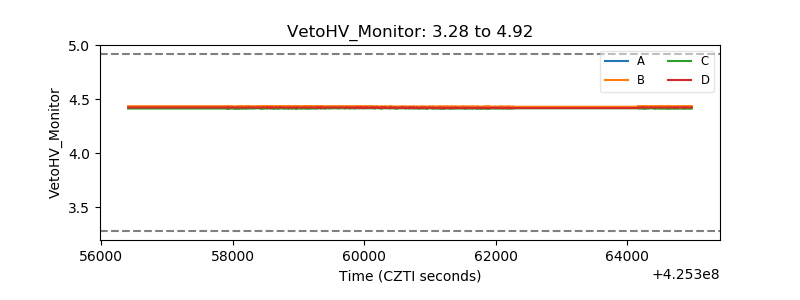 |
| Veto LLD | 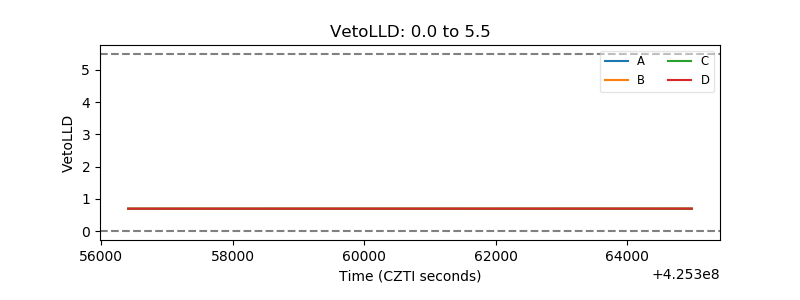 |
| Alpha Counter | 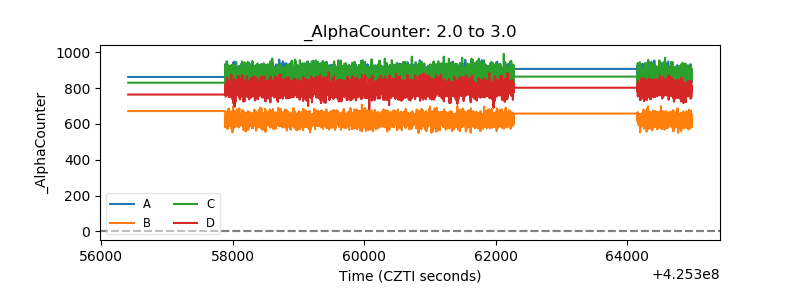 |
| _CPM_Rate | 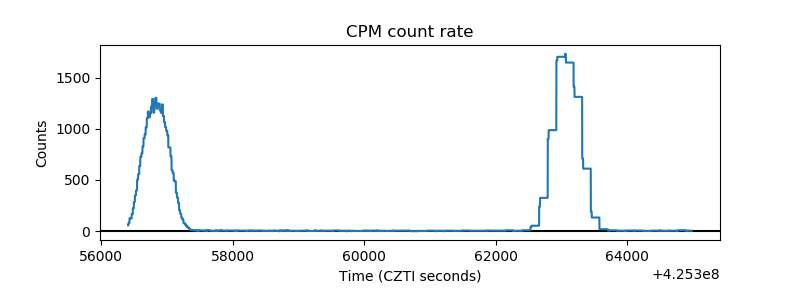 |
| CZT Counter | 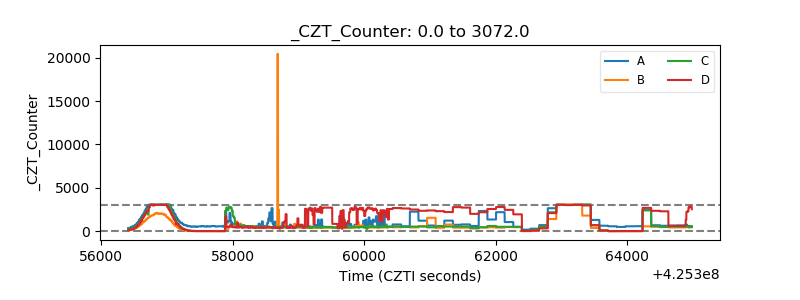 |
| +2.5 Volts monitor | 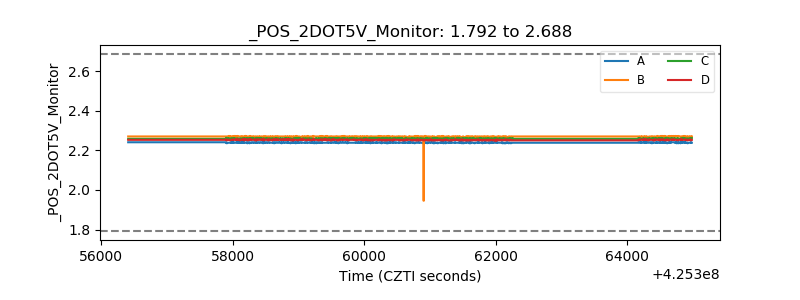 |
| +5 Volts monitor | 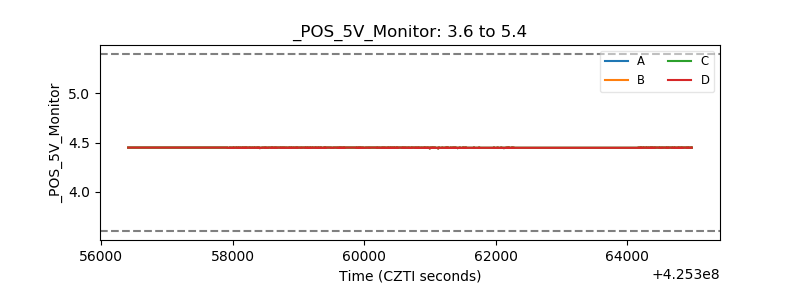 |
| _ROLL_ROT | 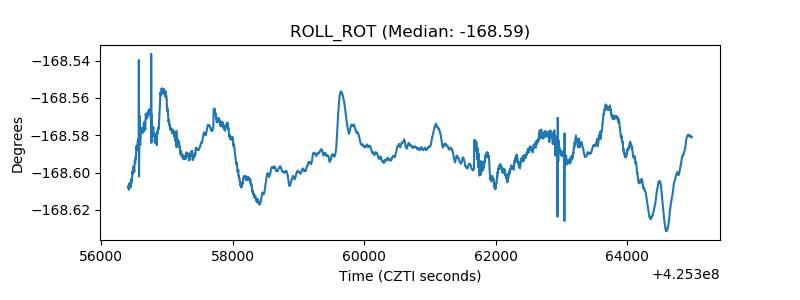 |
| _Roll_DEC |  |
| _Roll_RA | 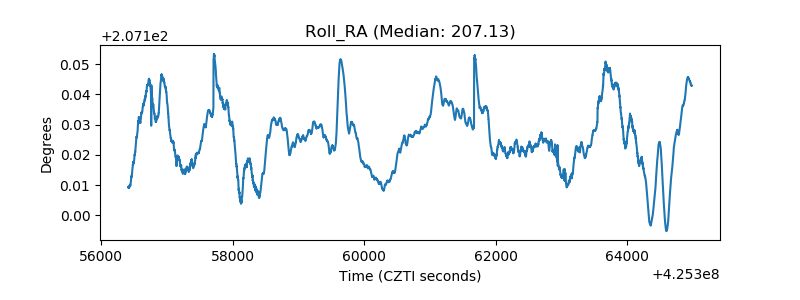 |
| Veto Counter | 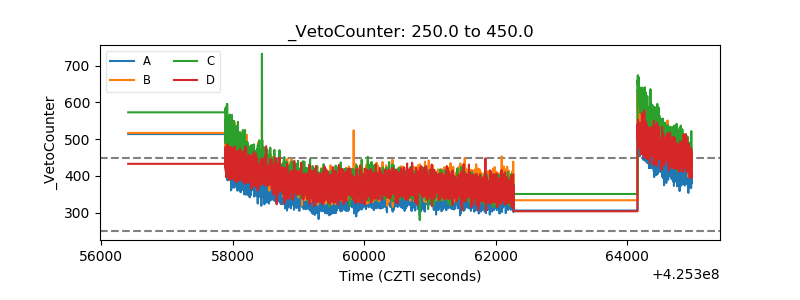 |