| Param | Original file | Final file |
|---|---|---|
| Filename | modeM0/AS1A12_099T04_9000005708_41850cztM0_level2.fits | modeM0/AS1A12_099T04_9000005708_41850cztM0_level2_quad_clean.evt |
| Size (bytes) | 473,834,880 | 86,719,680 |
| Size | 451.9 MB | 82.7 MB |
| Events in quadrant A | 3,850,179 | 618,364 |
| Events in quadrant B | 2,626,847 | 650,349 |
| Events in quadrant C | 3,284,275 | 580,167 |
| Events in quadrant D | 7,386,447 | 423,594 |
| Mode M0 | |||
|---|---|---|---|
| Quadrant | BADHDUFLAG | Total packets | Discarded packets |
| A | 0 | 14685 | 2 |
| B | 0 | 11042 | 2 |
| C | 0 | 12537 | 2 |
| D | 0 | 25397 | 2 |
| Mode SS | |||
|---|---|---|---|
| Quadrant | BADHDUFLAG | Total packets | Discarded packets |
| A | 0 | 102 | 0 |
| B | 0 | 102 | 0 |
| C | 0 | 102 | 0 |
| D | 0 | 102 | 0 |
| Mode M9 | |||
|---|---|---|---|
| Quadrant | BADHDUFLAG | Total packets | Discarded packets |
| A | 0 | 34 | 0 |
| B | 0 | 34 | 0 |
| C | 0 | 35 | 0 |
| D | 0 | 35 | 0 |
| Quadrant | Total seconds | Saturated seconds | Saturation percentage |
|---|---|---|---|
| A | 5047 | 194 | 3.843868% |
| B | 5047 | 34 | 0.673668% |
| C | 5047 | 286 | 5.666733% |
| D | 5047 | 1506 | 29.839509% |
Noise dominated data is calculated using 1-second bins in cleaned event files. If a bin has >2000 counts, and if more than 50% of those come from <1% of pixels, then it is considered to be noise-dominated and hence unusable.
| Quadrant | # 1 sec bins | Bins with >0 counts | Bins with >2000 counts | High rate bins dominated by noise | Noise dominated (total time) | Noise dominated (detector-on time) | Marked lightcurve |
|---|---|---|---|---|---|---|---|
| A | 7048 | 5048 | 145 | 145 | 2.06% | 2.87% | 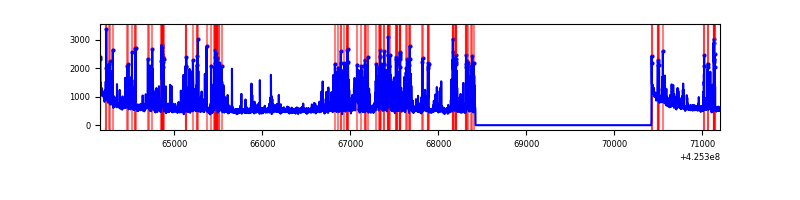 |
| B | 7048 | 5048 | 29 | 29 | 0.41% | 0.57% | 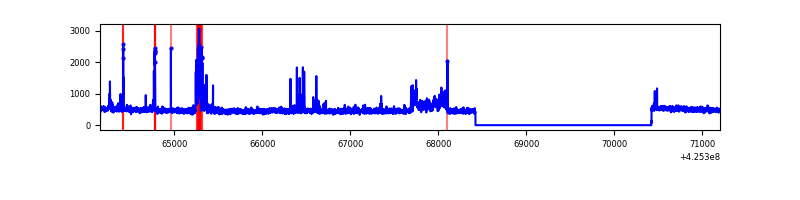 |
| C | 7048 | 5048 | 277 | 277 | 3.93% | 5.49% | 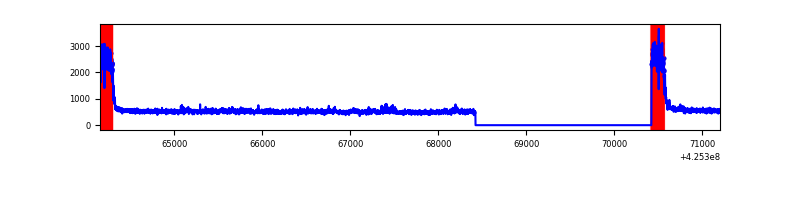 |
| D | 7048 | 5048 | 1590 | 1590 | 22.56% | 31.50% | 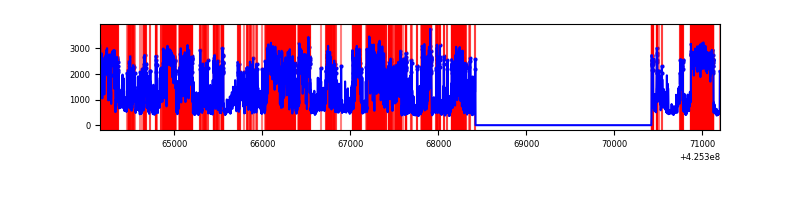 |
Top three noisy pixels from each quadrant. If the there are fewer than three noisy pixels in the level2.evt file, extra rows are filled as -1
| Pixel properties | Quadrant properties | ||||||
|---|---|---|---|---|---|---|---|
| Quadrant | DetID | PixID | Counts | Sigma | Mean | Median | Sigma |
| A | 14 | 24 | 883120 | 7432.49 | 583 | 572 | 118.7 |
| A | 10 | 83 | 519706 | 4371.95 | 583 | 572 | 118.7 |
| A | 2 | 79 | 188000 | 1578.45 | 583 | 572 | 118.7 |
| B | 5 | 255 | 195066 | 1755.73 | 585 | 570 | 110.8 |
| B | 0 | 183 | 111812 | 1004.19 | 585 | 570 | 110.8 |
| B | 12 | 111 | 13468 | 116.43 | 585 | 570 | 110.8 |
| C | 0 | 10 | 910905 | 7189.1 | 552 | 556 | 126.6 |
| C | 15 | 214 | 197636 | 1556.36 | 552 | 556 | 126.6 |
| C | 0 | 207 | 21171 | 162.8 | 552 | 556 | 126.6 |
| D | 12 | 79 | 4768412 | 38036.97 | 513 | 499 | 125.3 |
| D | 10 | 34 | 157964 | 1256.21 | 513 | 499 | 125.3 |
| D | 12 | 6 | 140662 | 1118.18 | 513 | 499 | 125.3 |
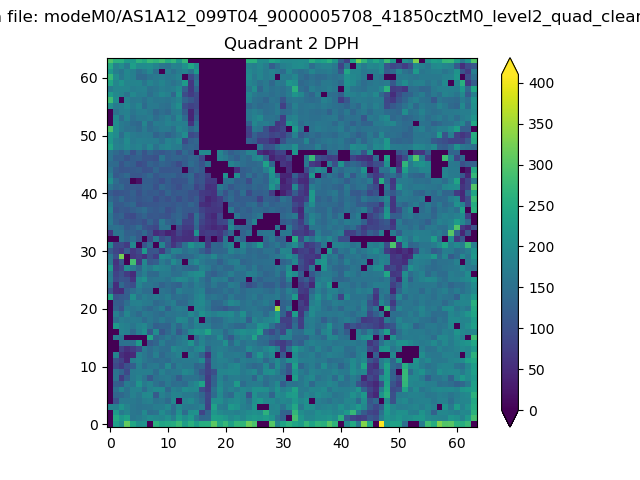
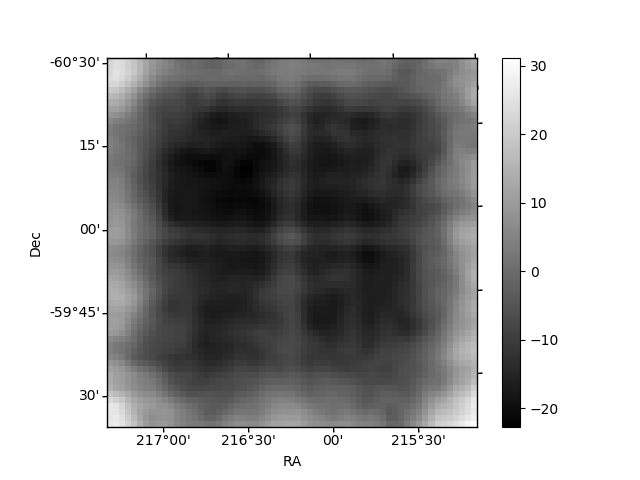
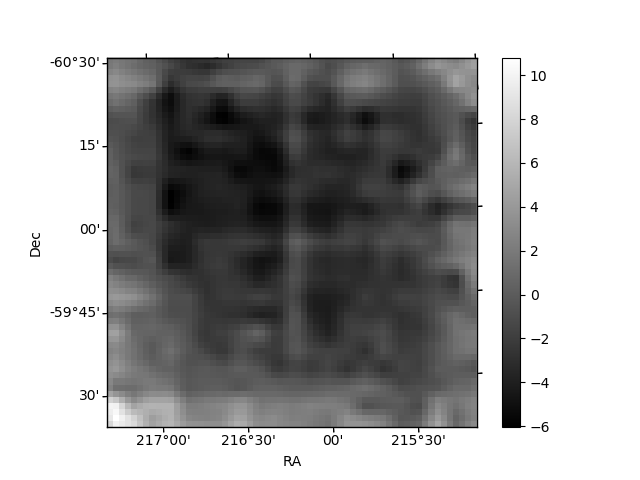
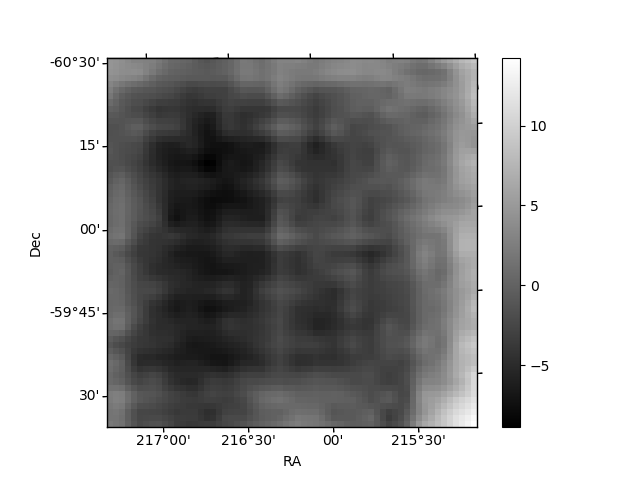
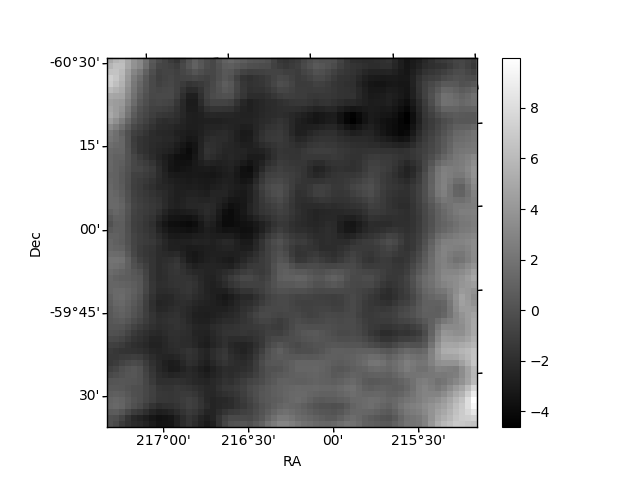
Histogram calculated using DETX and DETY for each event in the final _common_clean file
| Quadrant A | 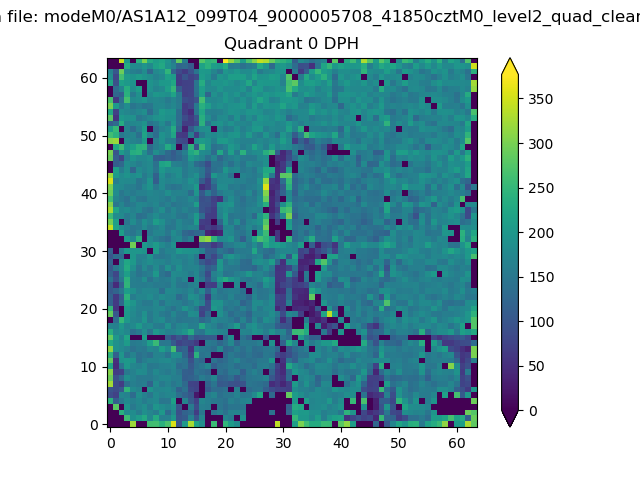 |
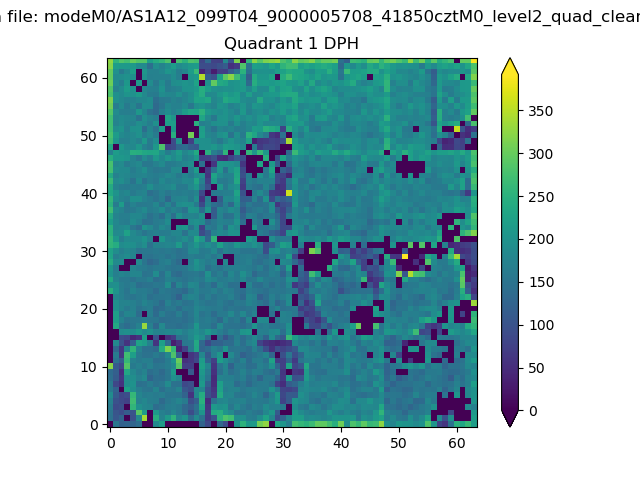 |
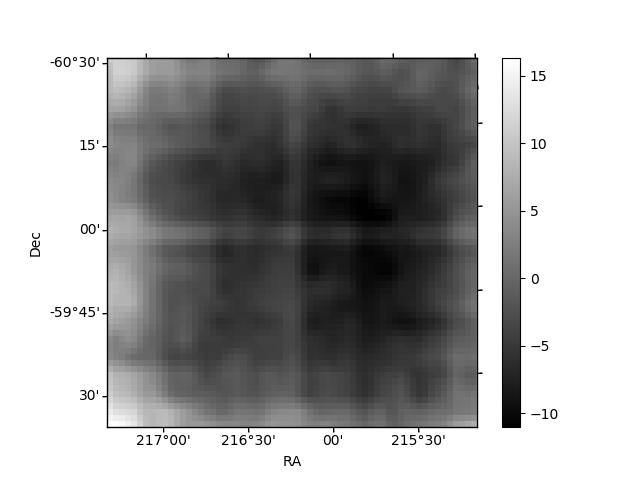
Quadrant B |
|---|---|---|---|
| Quadrant D | 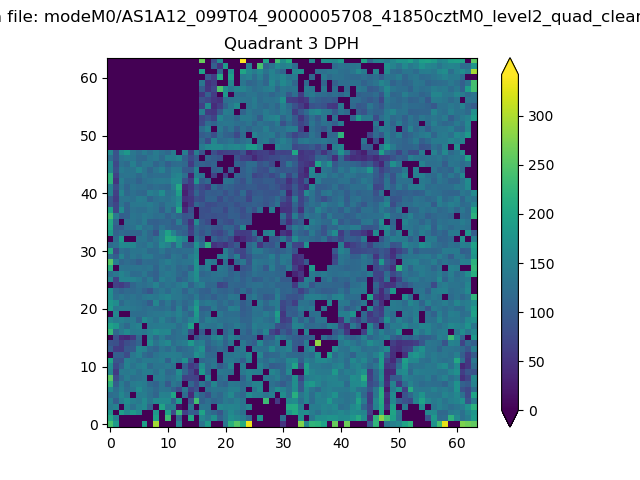 |
 |
Quadrant C |
| Plot type | Count rate plots | Images |
|---|---|---|
| Comparison with Poisson distribution Blue bars denote a histogram of data divided into 1 sec bins. Red curve is a Poisson curve with rate = median count rate of data. |
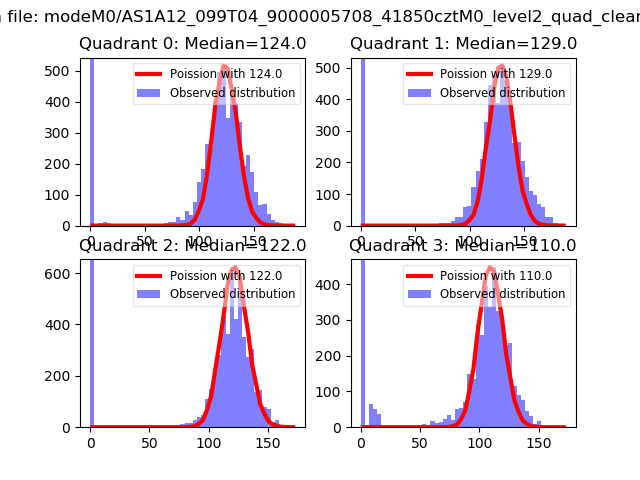 |
 |
| Quadrant-wise count rates Data is divided into 100 sec bins |
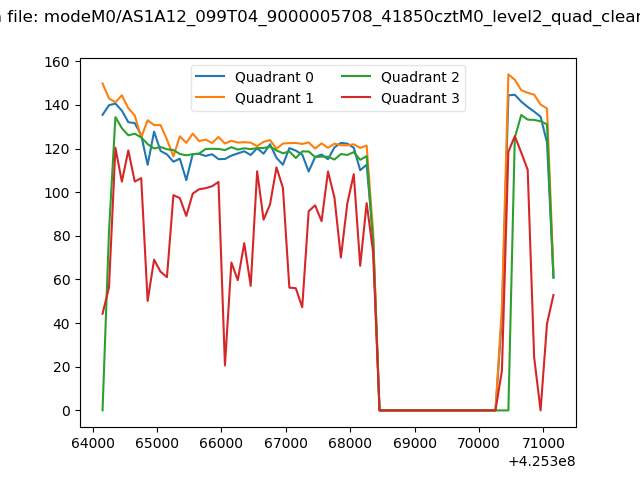 |
|
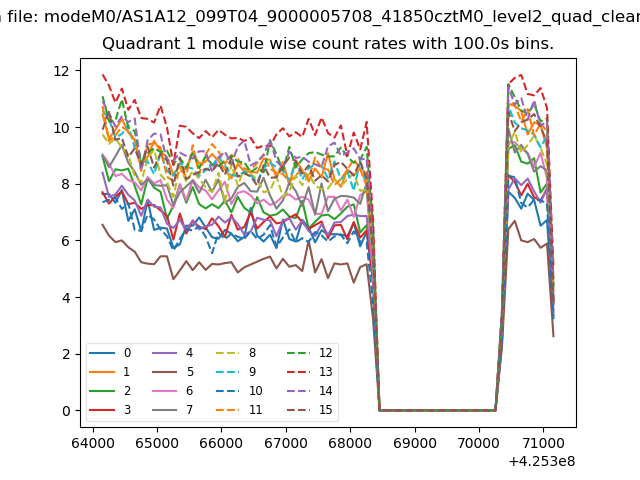
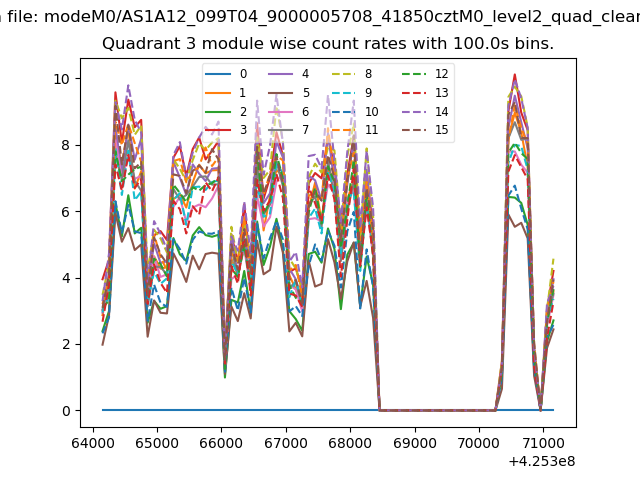
| Module-wise count rates for Quadrant A Data is divided into 100 sec bins |
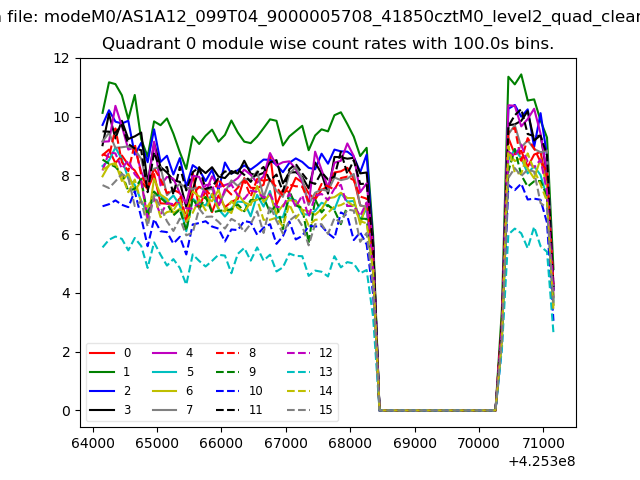 |
 |
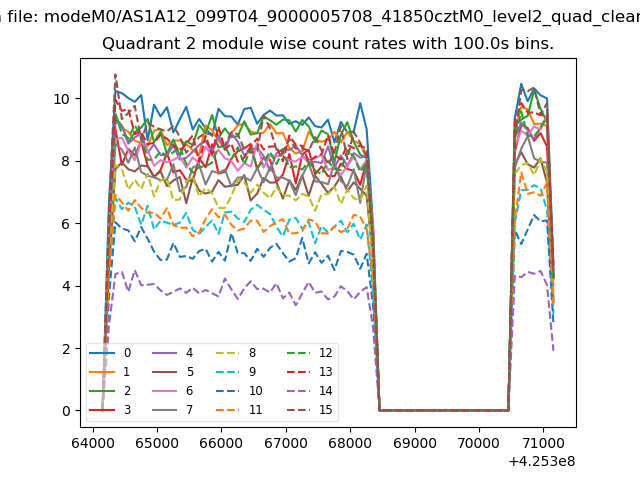
| Module-wise count rates for Quadrant B Data is divided into 100 sec bins |
 |
 |
| Module-wise count rates for Quadrant C Data is divided into 100 sec bins |
 |
 |
| Module-wise count rates for Quadrant D Data is divided into 100 sec bins |
 |
 |
| Parameter | Plot |
|---|---|
| CZT HV Monitor | 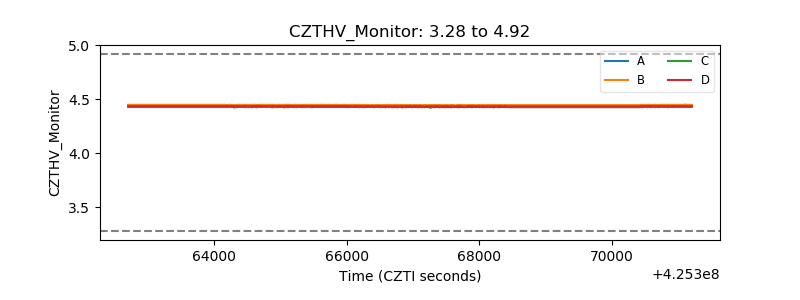 |
| D_VDD | 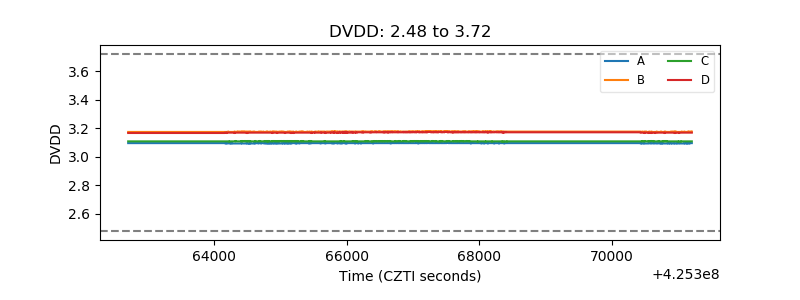 |
| Temperature 1 | 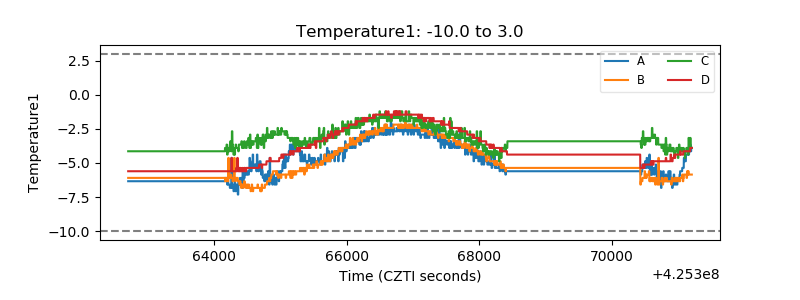 |
| Veto HV Monitor | 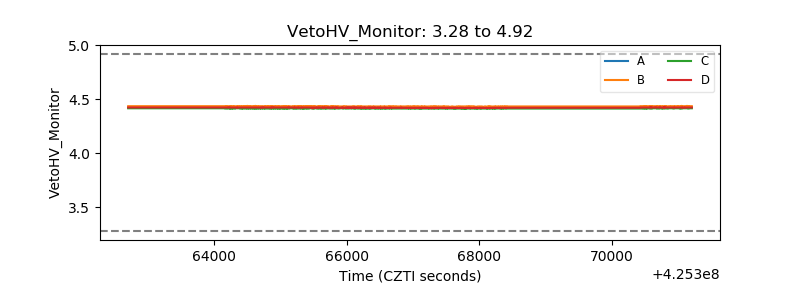 |
| Veto LLD | 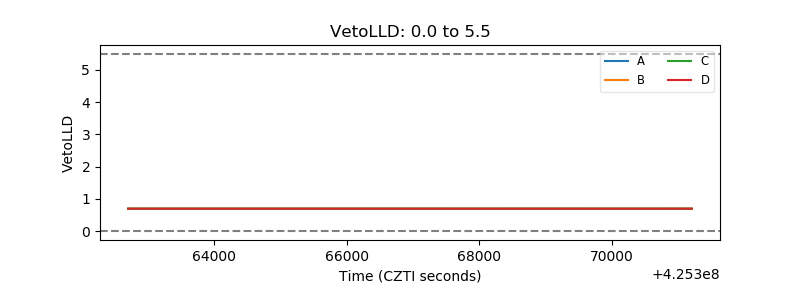 |
| Alpha Counter | 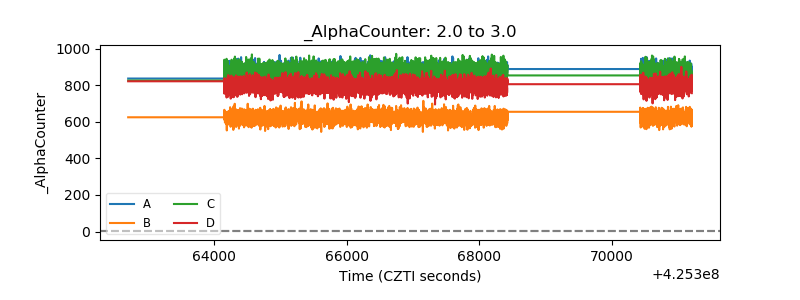 |
| _CPM_Rate | 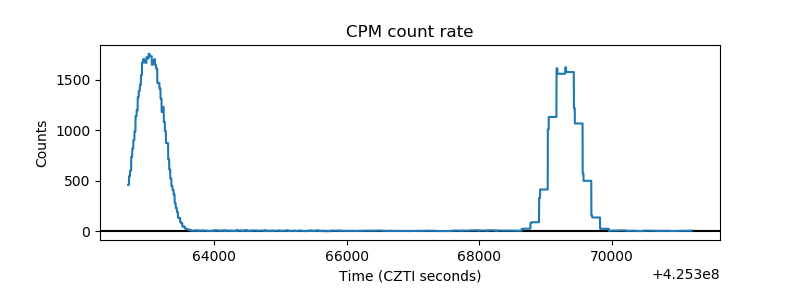 |
| CZT Counter | 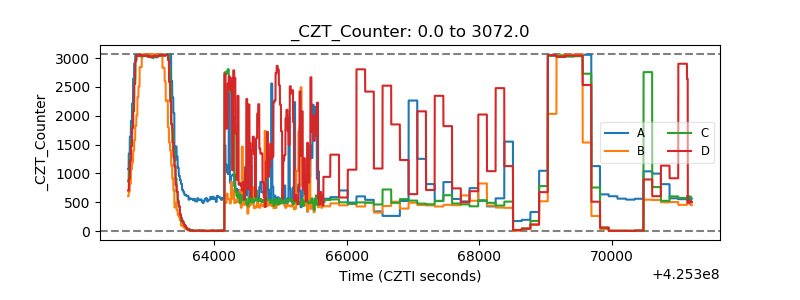 |
| +2.5 Volts monitor | 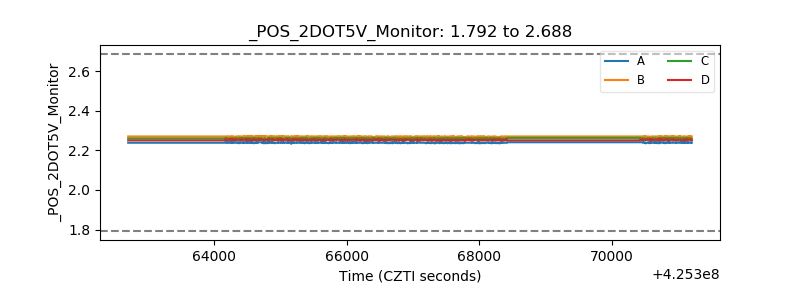 |
| +5 Volts monitor | 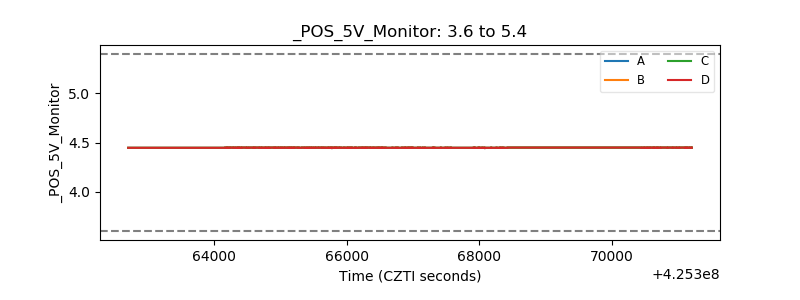 |
| _ROLL_ROT | 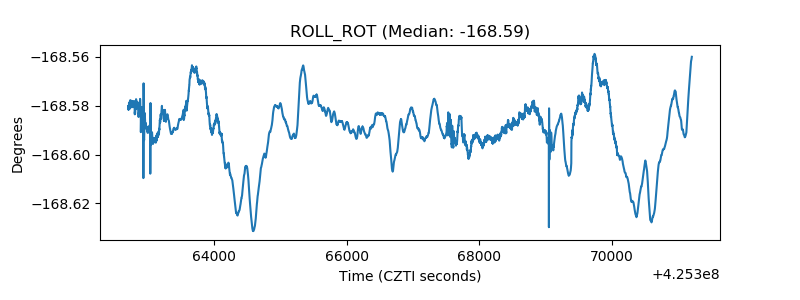 |
| _Roll_DEC | 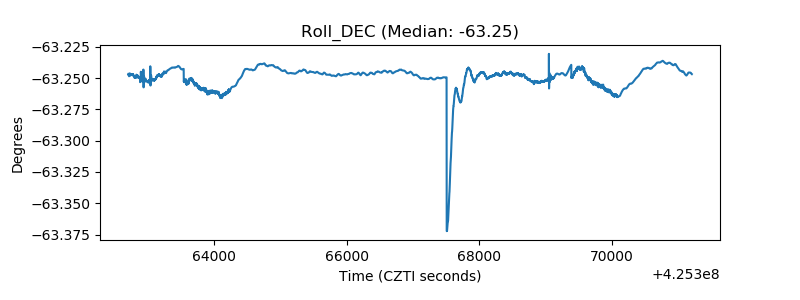 |
| _Roll_RA | 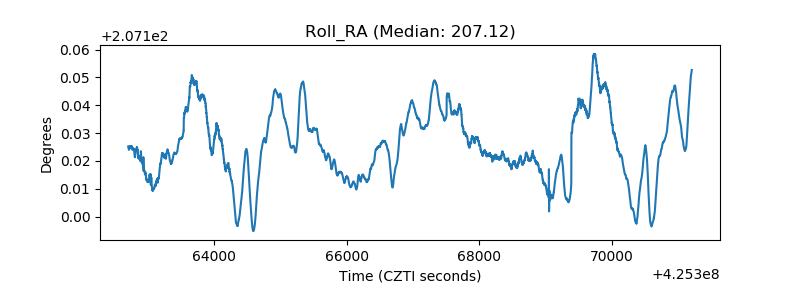 |
| Veto Counter | 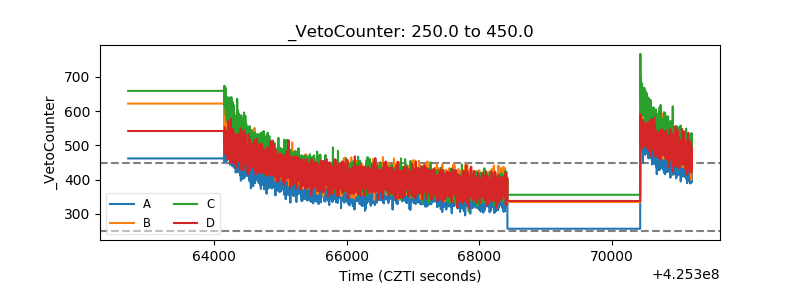 |