| Param | Original file | Final file |
|---|---|---|
| Filename | modeM0/AS1A12_099T04_9000005708_41851cztM0_level2.fits | modeM0/AS1A12_099T04_9000005708_41851cztM0_level2_quad_clean.evt |
| Size (bytes) | 154,192,320 | 32,837,760 |
| Size | 147.0 MB | 31.3 MB |
| Events in quadrant A | 1,199,511 | 236,060 |
| Events in quadrant B | 926,090 | 250,043 |
| Events in quadrant C | 1,304,223 | 215,539 |
| Events in quadrant D | 2,134,219 | 160,456 |
| Mode M0 | |||
|---|---|---|---|
| Quadrant | BADHDUFLAG | Total packets | Discarded packets |
| A | 0 | 4670 | 1 |
| B | 0 | 3781 | 1 |
| C | 0 | 4887 | 1 |
| D | 0 | 7553 | 1 |
| Mode SS | |||
|---|---|---|---|
| Quadrant | BADHDUFLAG | Total packets | Discarded packets |
| A | 0 | 36 | 0 |
| B | 0 | 36 | 0 |
| C | 0 | 36 | 0 |
| D | 0 | 36 | 0 |
| Mode M9 | |||
|---|---|---|---|
| Quadrant | BADHDUFLAG | Total packets | Discarded packets |
| A | 0 | 12 | 0 |
| B | 0 | 12 | 0 |
| C | 0 | 13 | 0 |
| D | 0 | 13 | 0 |
| Quadrant | Total seconds | Saturated seconds | Saturation percentage |
|---|---|---|---|
| A | 1814 | 26 | 1.433297% |
| B | 1814 | 2 | 0.110254% |
| C | 1814 | 142 | 7.828004% |
| D | 1814 | 486 | 26.791621% |
Noise dominated data is calculated using 1-second bins in cleaned event files. If a bin has >2000 counts, and if more than 50% of those come from <1% of pixels, then it is considered to be noise-dominated and hence unusable.
| Quadrant | # 1 sec bins | Bins with >0 counts | Bins with >2000 counts | High rate bins dominated by noise | Noise dominated (total time) | Noise dominated (detector-on time) | Marked lightcurve |
|---|---|---|---|---|---|---|---|
| A | 1814 | 1814 | 20 | 20 | 1.10% | 1.10% | 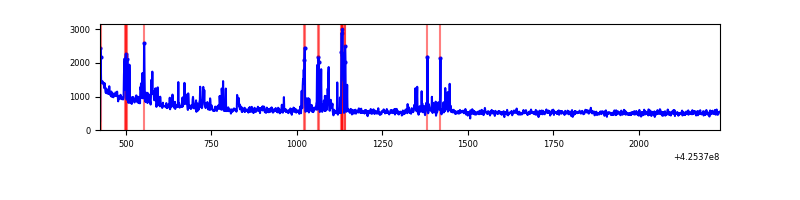 |
| B | 1814 | 1814 | 1 | 1 | 0.06% | 0.06% | 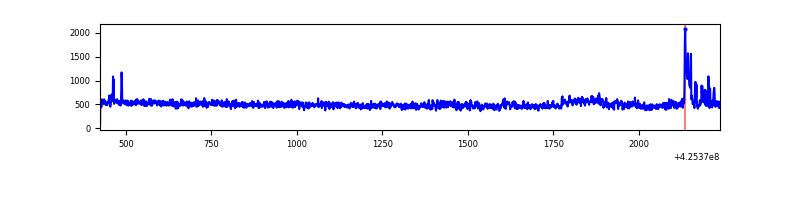 |
| C | 1814 | 1814 | 139 | 139 | 7.66% | 7.66% | 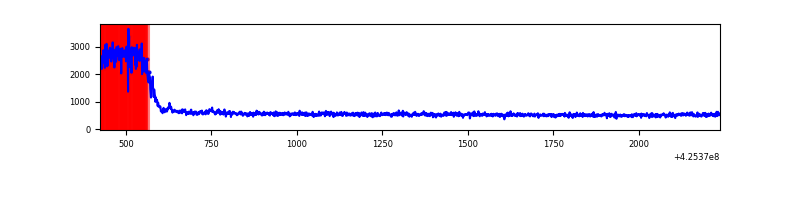 |
| D | 1814 | 1814 | 469 | 469 | 25.85% | 25.85% | 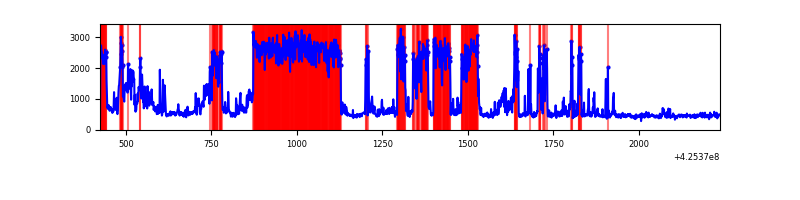 |
Top three noisy pixels from each quadrant. If the there are fewer than three noisy pixels in the level2.evt file, extra rows are filled as -1
| Pixel properties | Quadrant properties | ||||||
|---|---|---|---|---|---|---|---|
| Quadrant | DetID | PixID | Counts | Sigma | Mean | Median | Sigma |
| A | 10 | 83 | 211686 | 4676.04 | 218 | 214 | 45.2 |
| A | 14 | 24 | 134121 | 2960.94 | 218 | 214 | 45.2 |
| A | 2 | 79 | 10449 | 226.32 | 218 | 214 | 45.2 |
| B | 0 | 156 | 33710 | 782.8 | 218 | 212 | 42.8 |
| B | 4 | 81 | 27346 | 634.08 | 218 | 212 | 42.8 |
| B | 5 | 255 | 5955 | 134.21 | 218 | 212 | 42.8 |
| C | 0 | 10 | 431161 | 8906.88 | 204 | 205 | 48.4 |
| C | 15 | 214 | 72926 | 1502.98 | 204 | 205 | 48.4 |
| C | 14 | 254 | 1752 | 31.97 | 204 | 205 | 48.4 |
| D | 12 | 79 | 1095508 | 23087.37 | 190 | 185 | 47.4 |
| D | 2 | 249 | 133384 | 2807.59 | 190 | 185 | 47.4 |
| D | 12 | 6 | 88485 | 1861.2 | 190 | 185 | 47.4 |
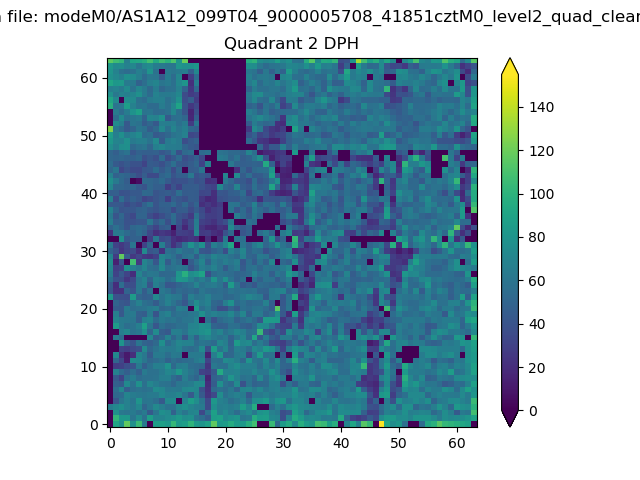
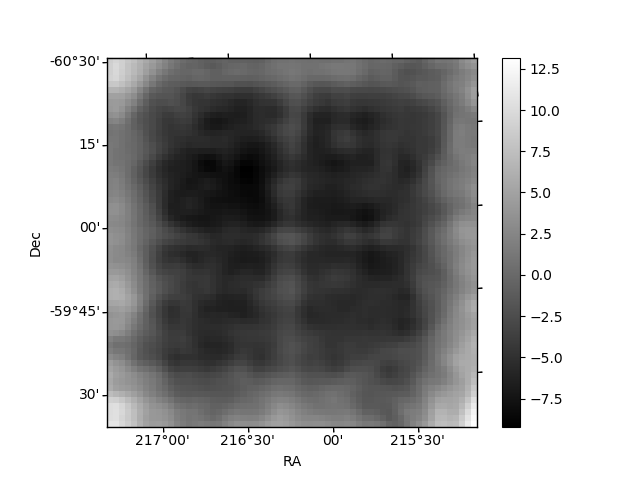
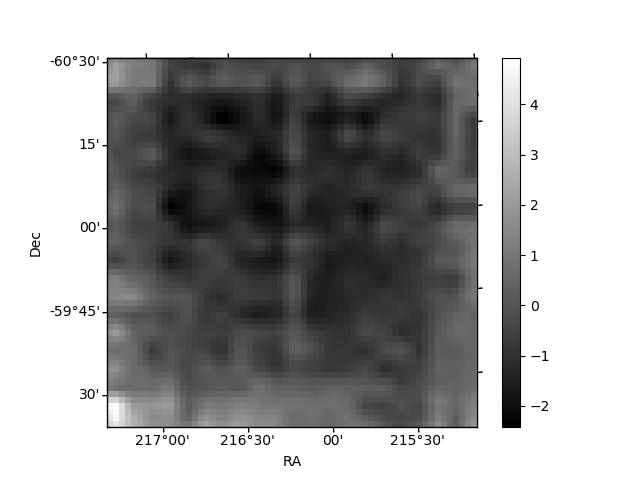
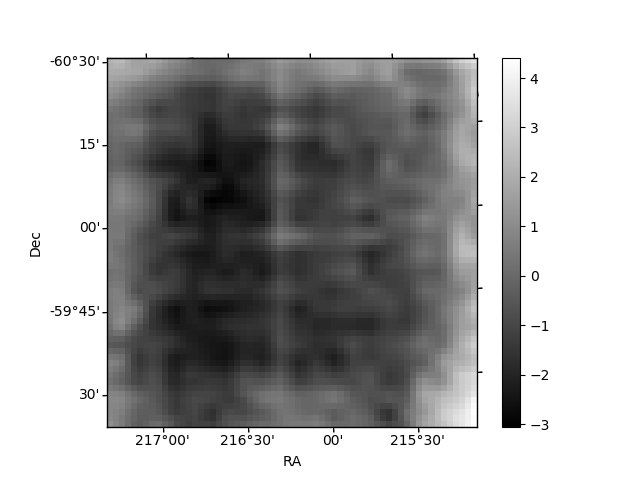
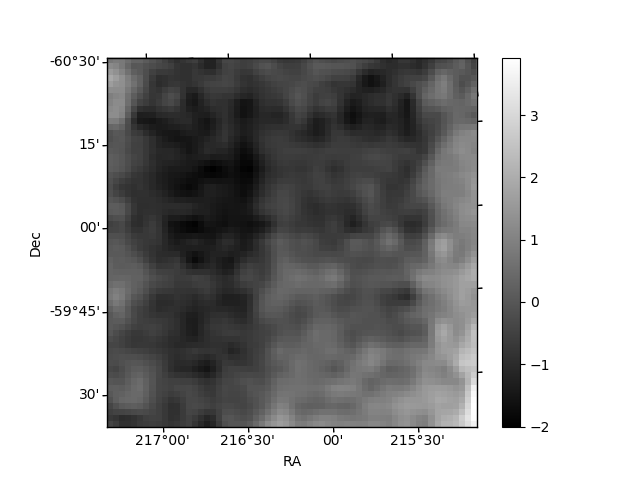
Histogram calculated using DETX and DETY for each event in the final _common_clean file
| Quadrant A | 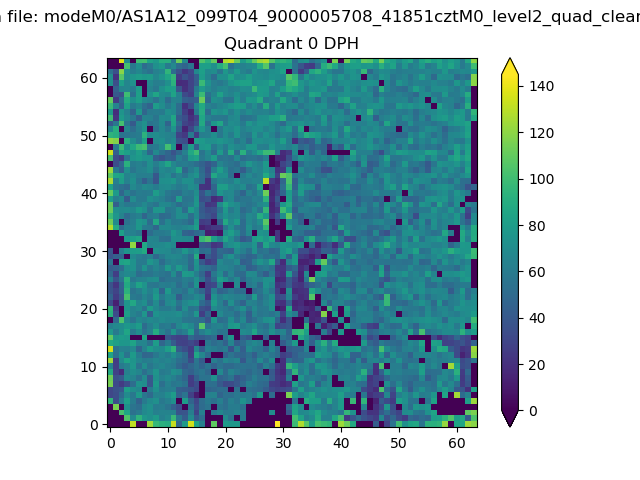 |
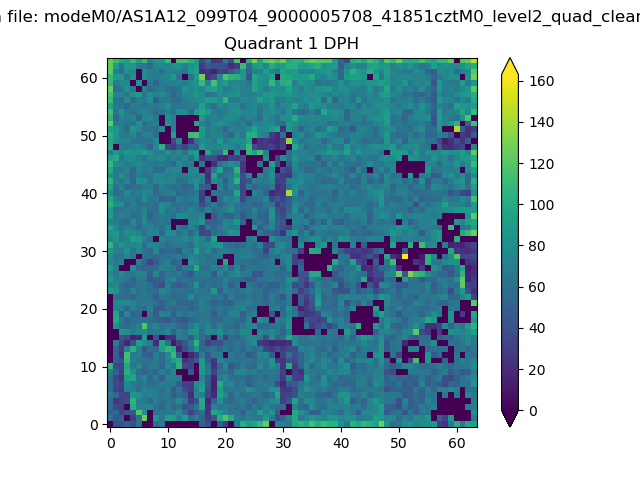 |
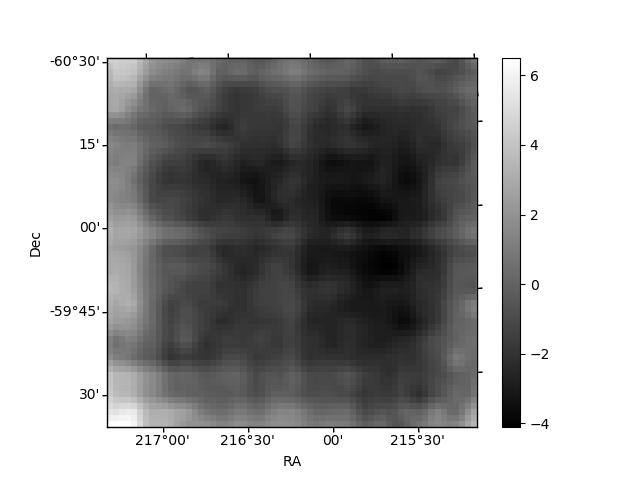
Quadrant B |
|---|---|---|---|
| Quadrant D | 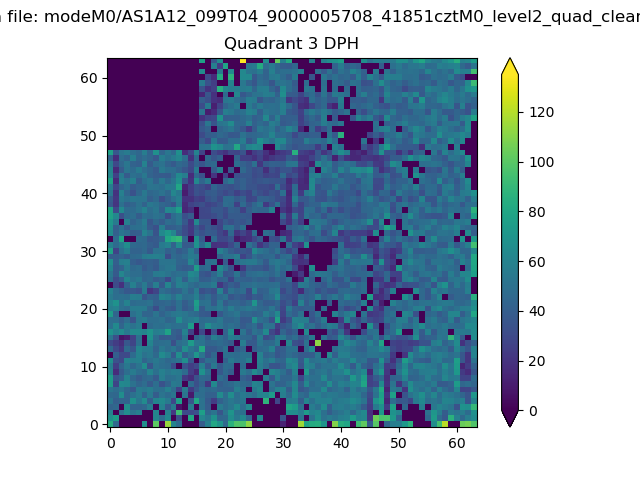 |
 |
Quadrant C |
| Plot type | Count rate plots | Images |
|---|---|---|
| Comparison with Poisson distribution Blue bars denote a histogram of data divided into 1 sec bins. Red curve is a Poisson curve with rate = median count rate of data. |
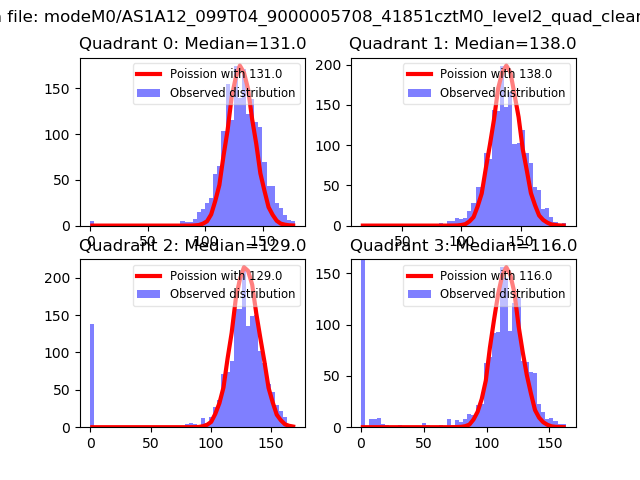 |
 |
| Quadrant-wise count rates Data is divided into 100 sec bins |
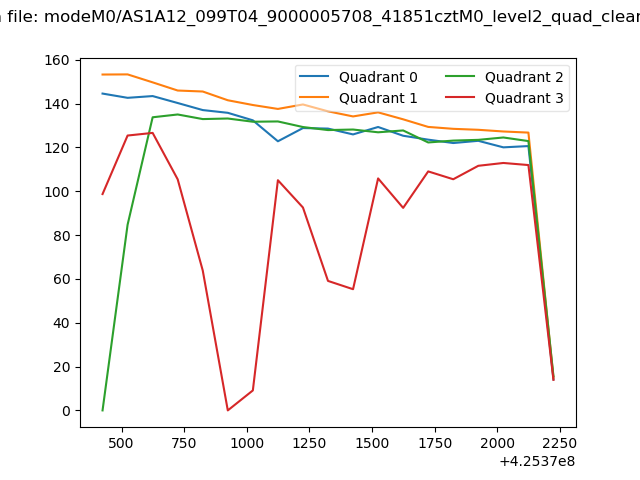 |
|
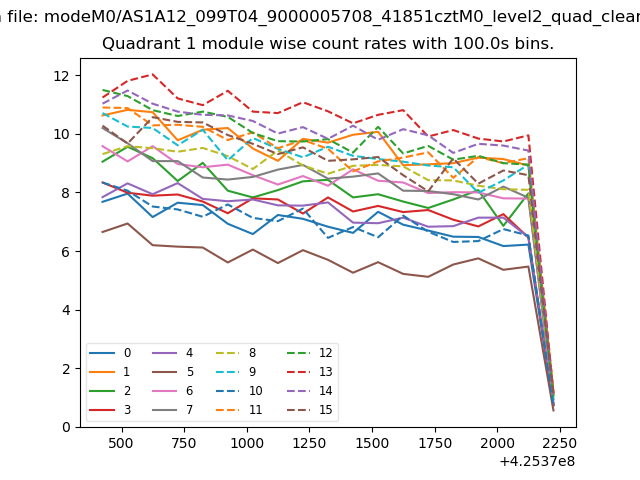
| Module-wise count rates for Quadrant A Data is divided into 100 sec bins |
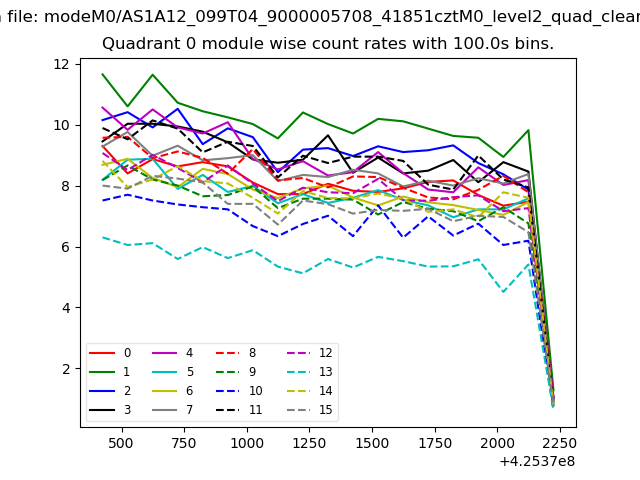 |
 |
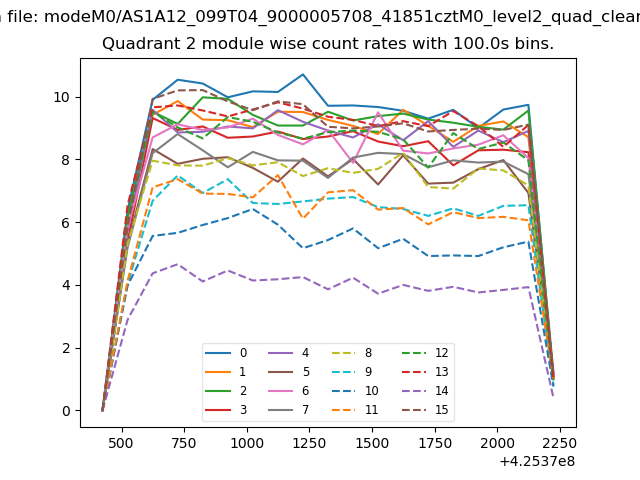
| Module-wise count rates for Quadrant B Data is divided into 100 sec bins |
 |
 |
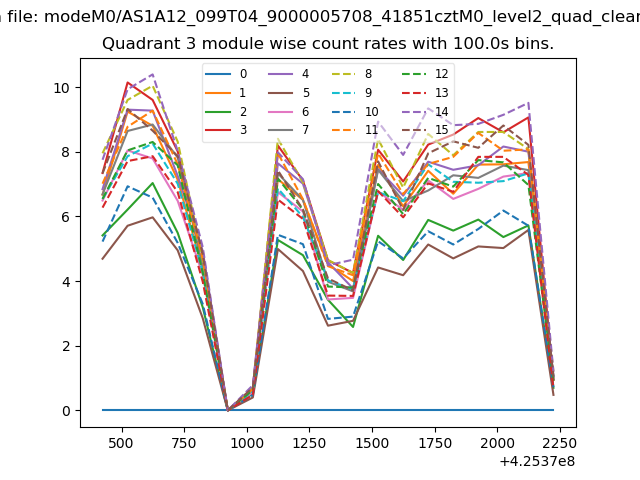
| Module-wise count rates for Quadrant C Data is divided into 100 sec bins |
 |
 |
| Module-wise count rates for Quadrant D Data is divided into 100 sec bins |
 |
 |
| Parameter | Plot |
|---|---|
| CZT HV Monitor | 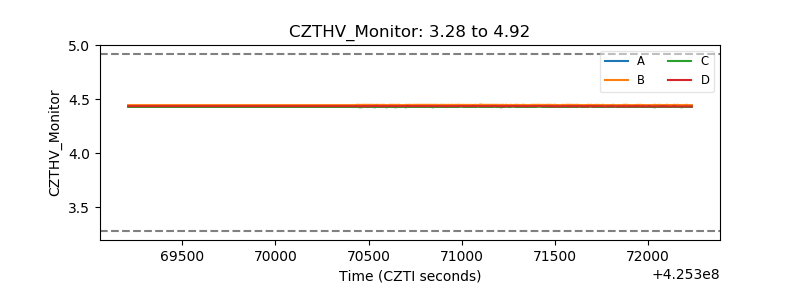 |
| D_VDD | 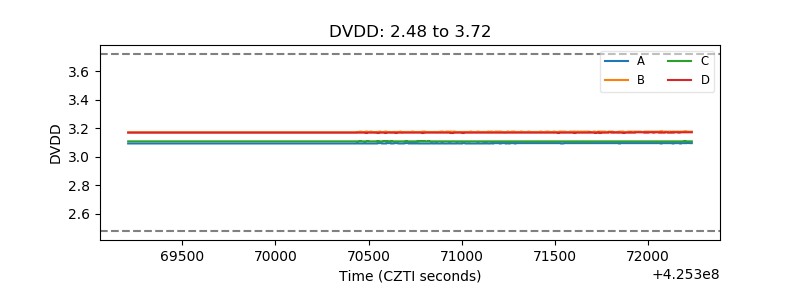 |
| Temperature 1 | 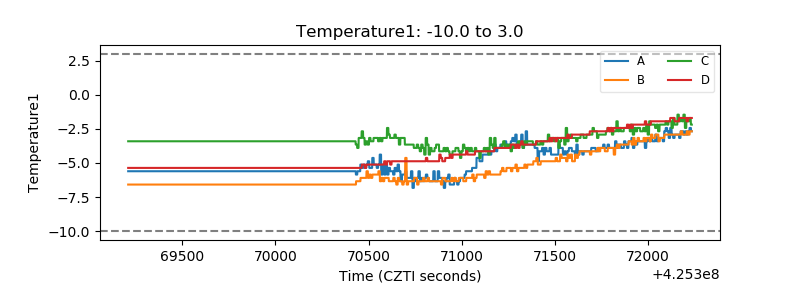 |
| Veto HV Monitor | 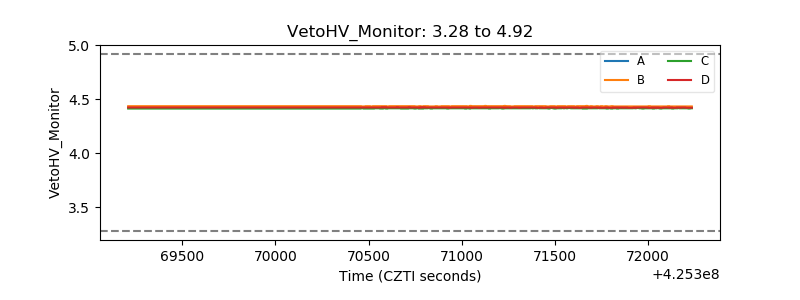 |
| Veto LLD | 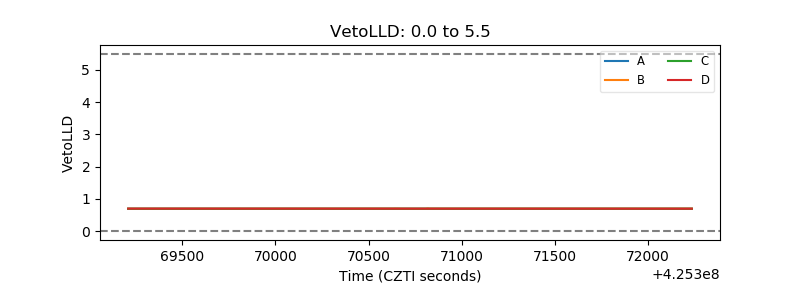 |
| Alpha Counter | 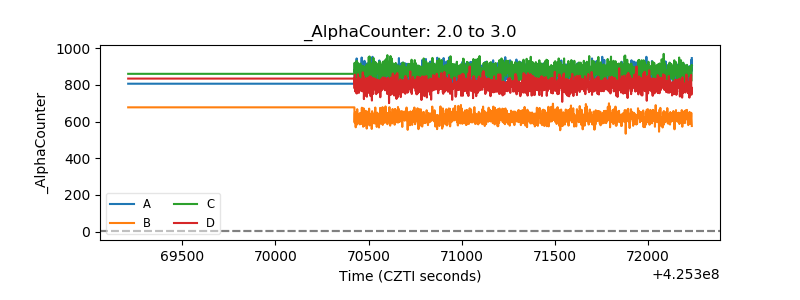 |
| _CPM_Rate | 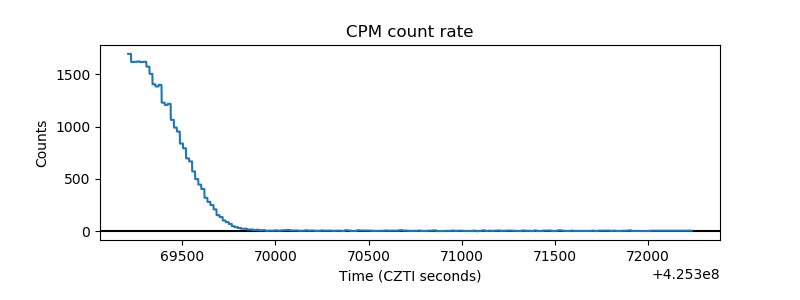 |
| CZT Counter | 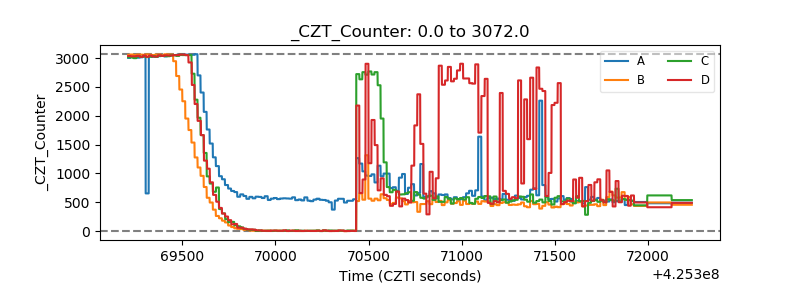 |
| +2.5 Volts monitor | 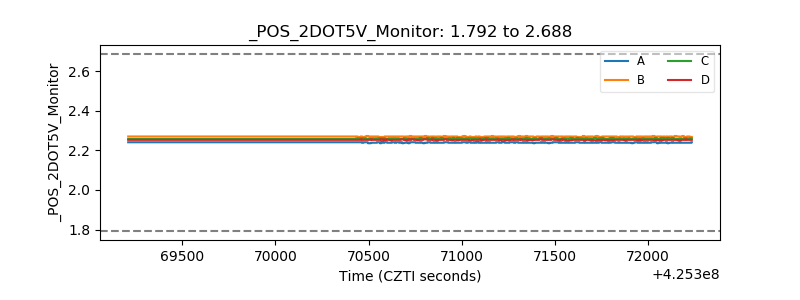 |
| +5 Volts monitor | 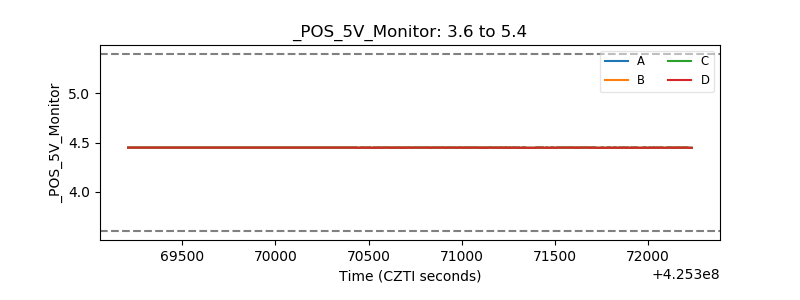 |
| _ROLL_ROT | 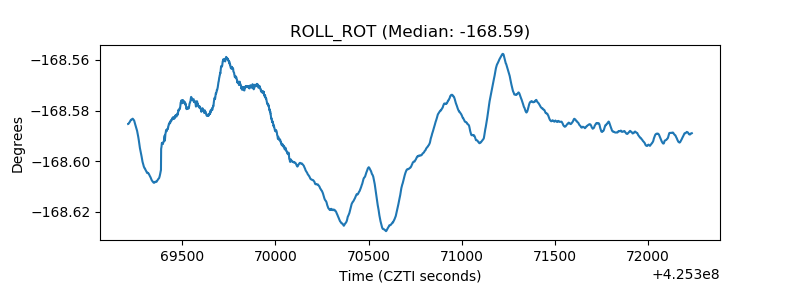 |
| _Roll_DEC | 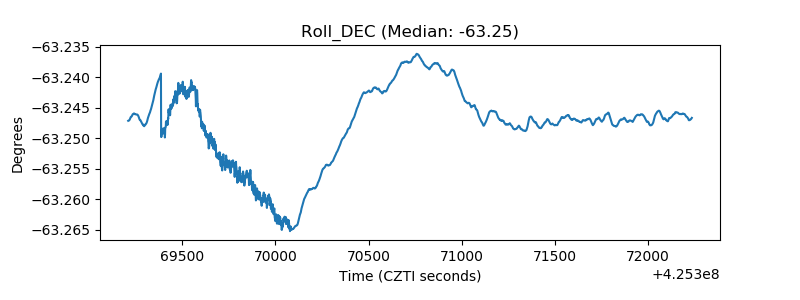 |
| _Roll_RA | 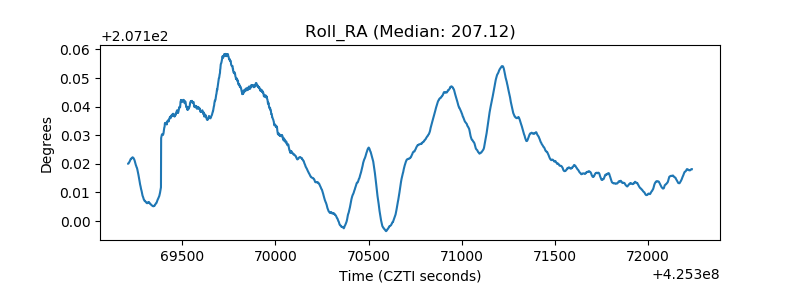 |
| Veto Counter | 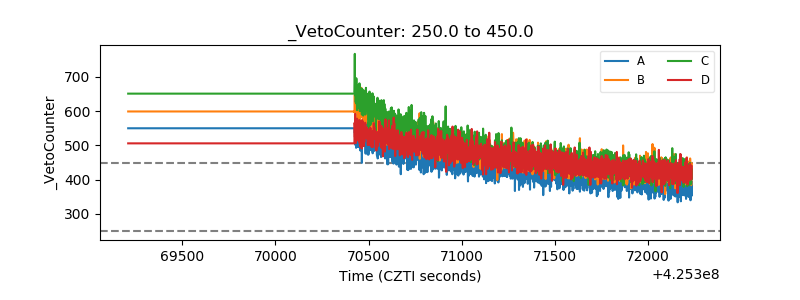 |