| Param | Original file | Final file |
|---|---|---|
| Filename | modeM0/AS1C07_001T11_9000005710_41851cztM0_level2.fits | modeM0/AS1C07_001T11_9000005710_41851cztM0_level2_quad_clean.evt |
| Size (bytes) | 140,538,240 | 34,557,120 |
| Size | 134.0 MB | 33.0 MB |
| Events in quadrant A | 1,417,749 | 230,546 |
| Events in quadrant B | 887,478 | 245,876 |
| Events in quadrant C | 1,374,256 | 223,247 |
| Events in quadrant D | 1,379,425 | 214,502 |
| Mode SS | |||
|---|---|---|---|
| Quadrant | BADHDUFLAG | Total packets | Discarded packets |
| A | 0 | 38 | 0 |
| B | 0 | 38 | 0 |
| C | 0 | 38 | 0 |
| D | 0 | 38 | 0 |
| Mode M0 | |||
|---|---|---|---|
| Quadrant | BADHDUFLAG | Total packets | Discarded packets |
| A | 0 | 5388 | 1 |
| B | 0 | 3736 | 1 |
| C | 0 | 5360 | 1 |
| D | 0 | 5277 | 6 |
| Mode M9 | |||
|---|---|---|---|
| Quadrant | BADHDUFLAG | Total packets | Discarded packets |
| A | 0 | 21 | 0 |
| B | 0 | 21 | 0 |
| C | 0 | 21 | 0 |
| D | 0 | 21 | 0 |
| Quadrant | Total seconds | Saturated seconds | Saturation percentage |
|---|---|---|---|
| A | 1812 | 102 | 5.629139% |
| B | 1812 | 12 | 0.662252% |
| C | 1812 | 134 | 7.395143% |
| D | 1811 | 91 | 5.024848% |
Noise dominated data is calculated using 1-second bins in cleaned event files. If a bin has >2000 counts, and if more than 50% of those come from <1% of pixels, then it is considered to be noise-dominated and hence unusable.
| Quadrant | # 1 sec bins | Bins with >0 counts | Bins with >2000 counts | High rate bins dominated by noise | Noise dominated (total time) | Noise dominated (detector-on time) | Marked lightcurve |
|---|---|---|---|---|---|---|---|
| A | 3875 | 1813 | 78 | 78 | 2.01% | 4.30% | 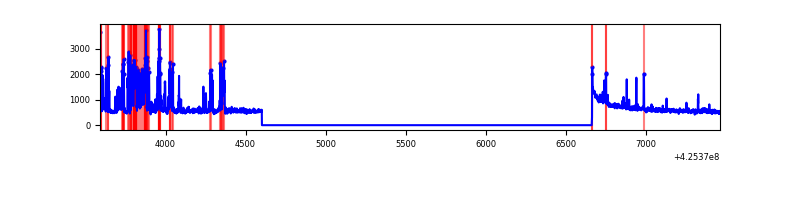 |
| B | 3875 | 1813 | 6 | 6 | 0.15% | 0.33% | 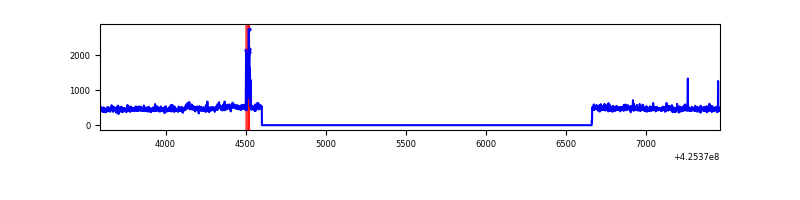 |
| C | 3875 | 1813 | 136 | 136 | 3.51% | 7.50% | 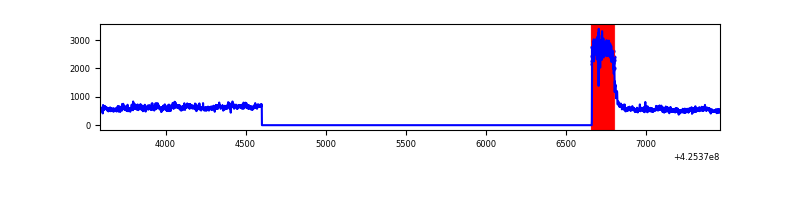 |
| D | 3874 | 1812 | 90 | 90 | 2.32% | 4.97% | 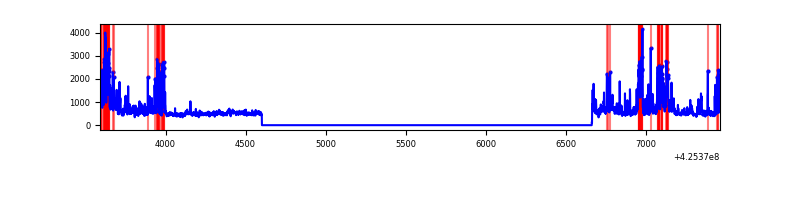 |
Top three noisy pixels from each quadrant. If the there are fewer than three noisy pixels in the level2.evt file, extra rows are filled as -1
| Pixel properties | Quadrant properties | ||||||
|---|---|---|---|---|---|---|---|
| Quadrant | DetID | PixID | Counts | Sigma | Mean | Median | Sigma |
| A | 14 | 24 | 361521 | 8017.79 | 215 | 210 | 45.1 |
| A | 10 | 83 | 214407 | 4753.21 | 215 | 210 | 45.1 |
| A | 13 | 248 | 5245 | 111.73 | 215 | 210 | 45.1 |
| B | 5 | 255 | 31090 | 720.22 | 217 | 211 | 42.9 |
| B | 12 | 111 | 4950 | 110.53 | 217 | 211 | 42.9 |
| B | 11 | 111 | 4570 | 101.67 | 217 | 211 | 42.9 |
| C | 0 | 10 | 493154 | 10045.46 | 206 | 207 | 49.1 |
| C | 15 | 214 | 72322 | 1469.59 | 206 | 207 | 49.1 |
| C | 14 | 254 | 1989 | 36.31 | 206 | 207 | 49.1 |
| D | 2 | 249 | 245487 | 4660.12 | 211 | 205 | 52.6 |
| D | 12 | 79 | 182543 | 3464.24 | 211 | 205 | 52.6 |
| D | 12 | 6 | 81222 | 1539.24 | 211 | 205 | 52.6 |
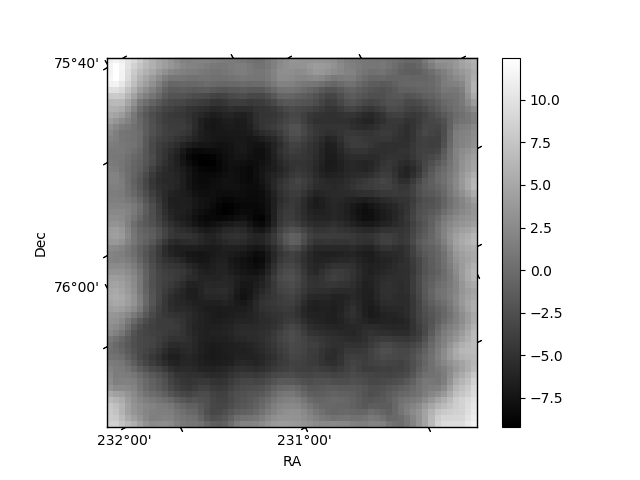
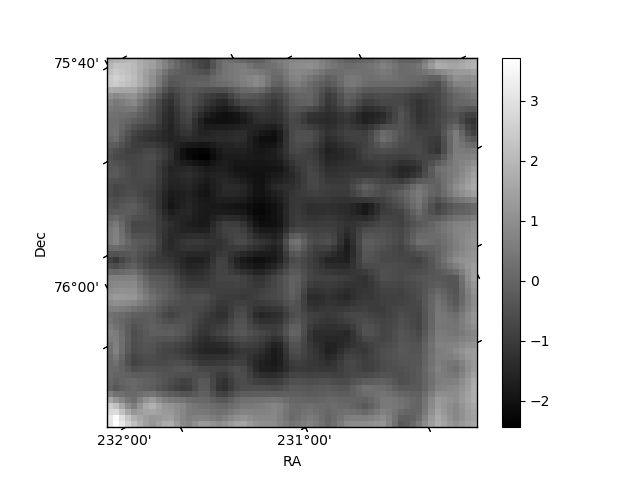
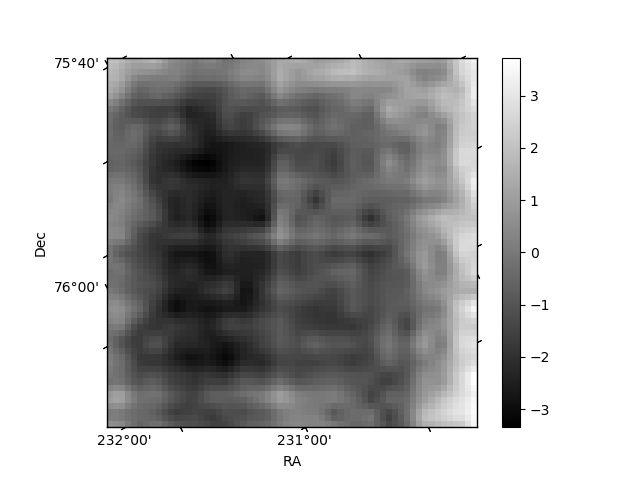
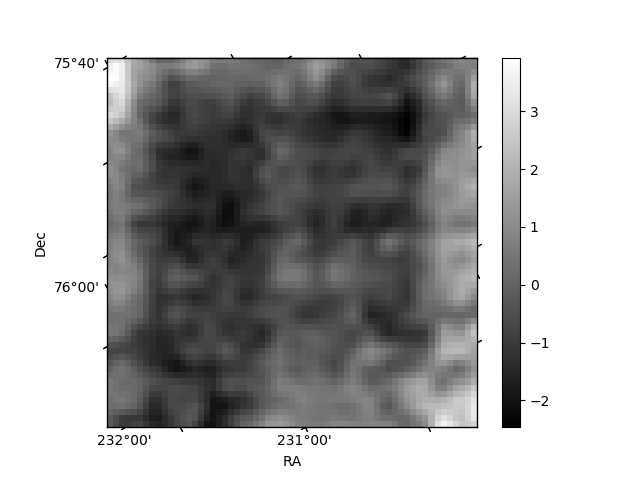
Histogram calculated using DETX and DETY for each event in the final _common_clean file
| Quadrant A | 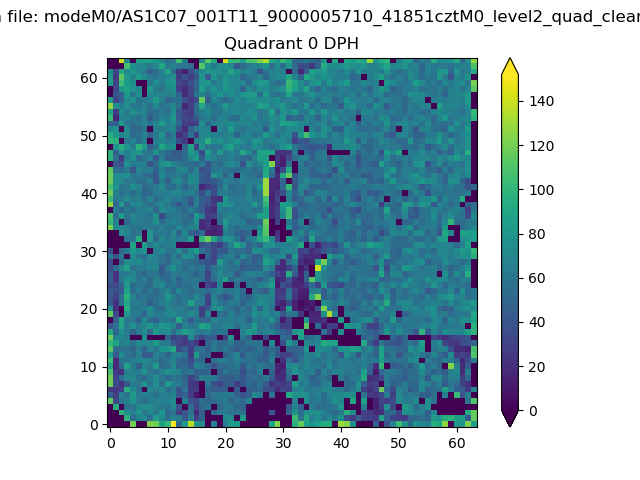 |
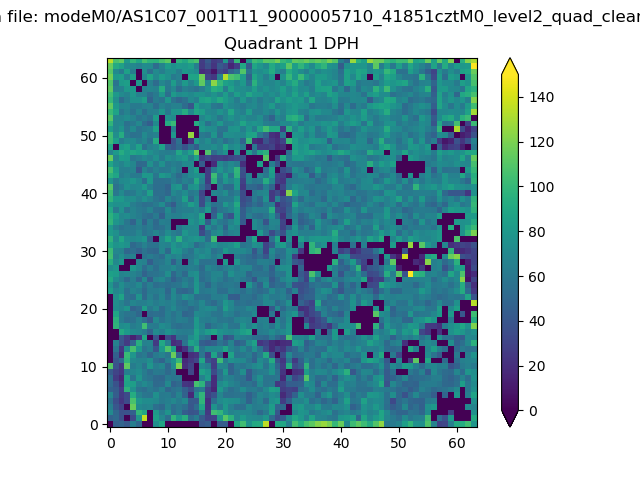 |
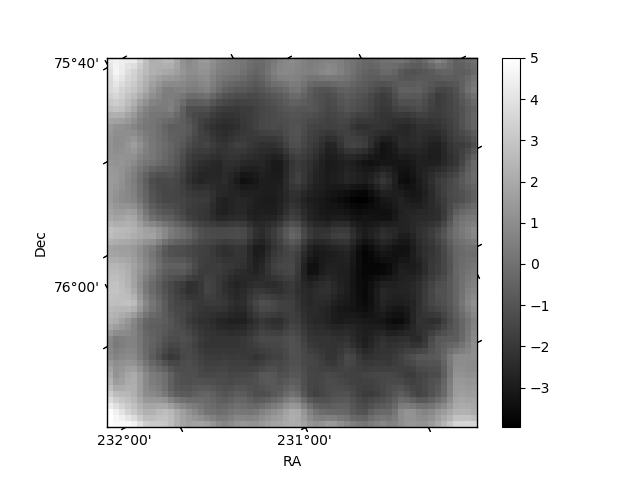
Quadrant B |
|---|---|---|---|
| Quadrant D | 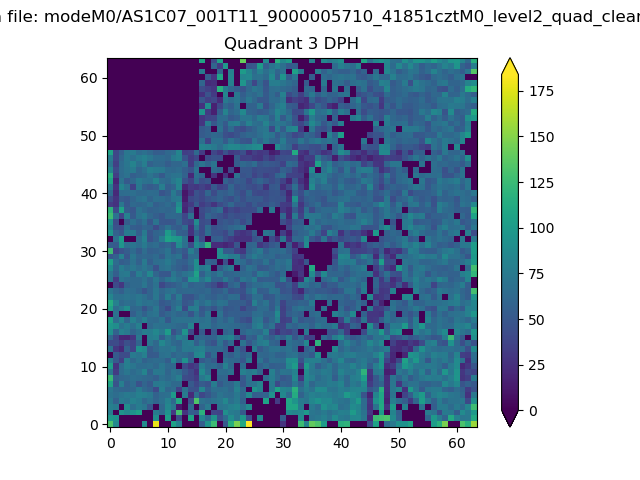 |
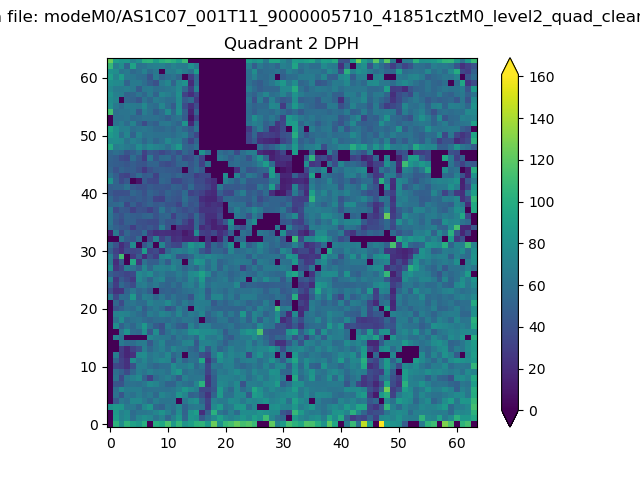 |
Quadrant C |
| Plot type | Count rate plots | Images |
|---|---|---|
| Comparison with Poisson distribution Blue bars denote a histogram of data divided into 1 sec bins. Red curve is a Poisson curve with rate = median count rate of data. |
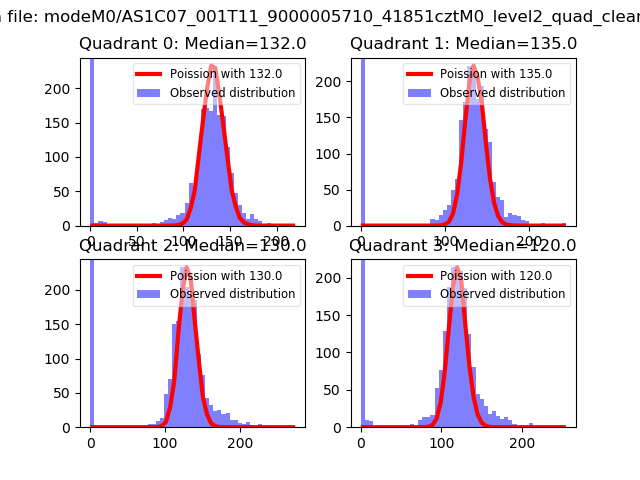 |
 |
| Quadrant-wise count rates Data is divided into 100 sec bins |
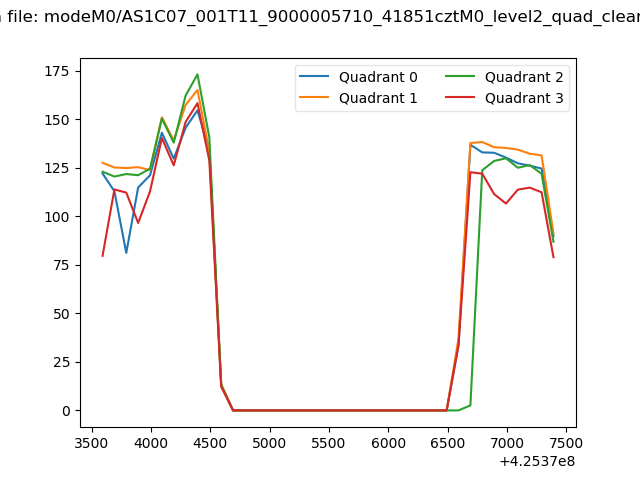 |
|
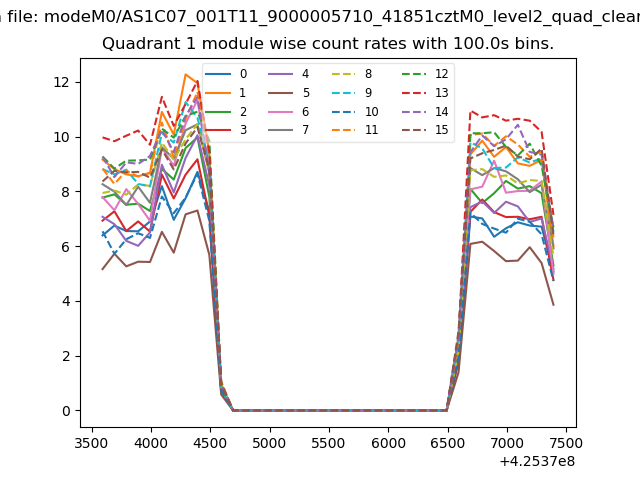
| Module-wise count rates for Quadrant A Data is divided into 100 sec bins |
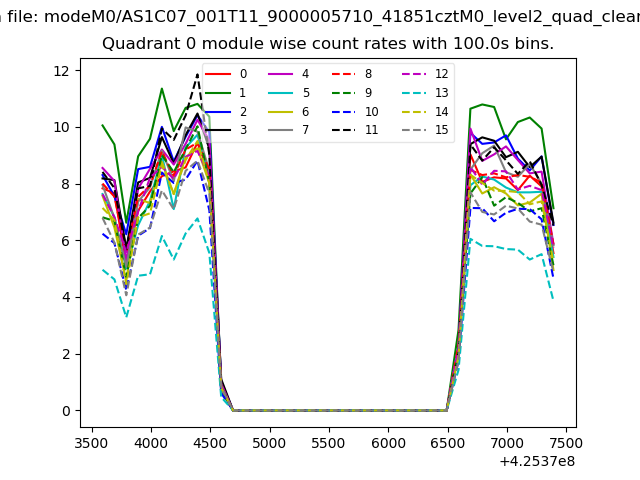 |
 |
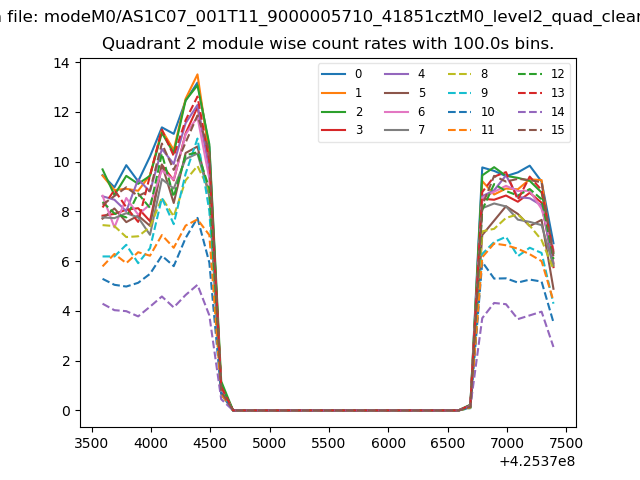
| Module-wise count rates for Quadrant B Data is divided into 100 sec bins |
 |
 |
| Module-wise count rates for Quadrant C Data is divided into 100 sec bins |
 |
 |
| Module-wise count rates for Quadrant D Data is divided into 100 sec bins |
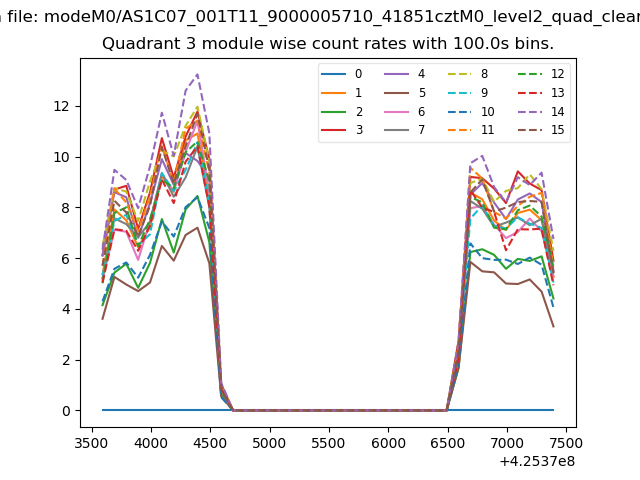 |
 |
| Parameter | Plot |
|---|---|
| CZT HV Monitor |  |
| D_VDD | 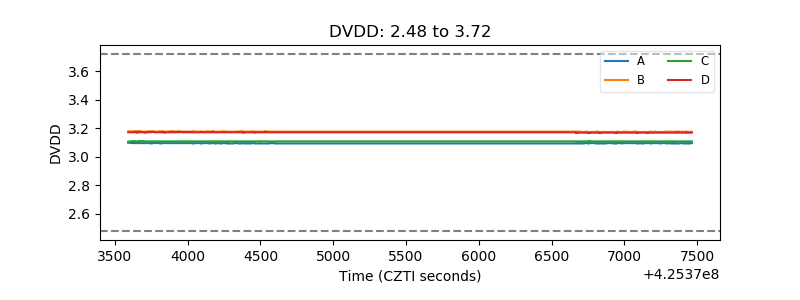 |
| Temperature 1 | 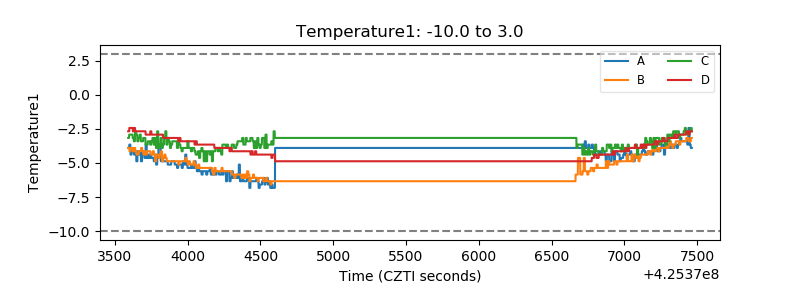 |
| Veto HV Monitor | 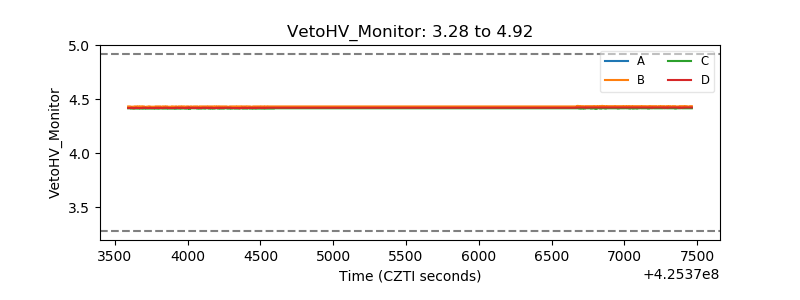 |
| Veto LLD |  |
| Alpha Counter | 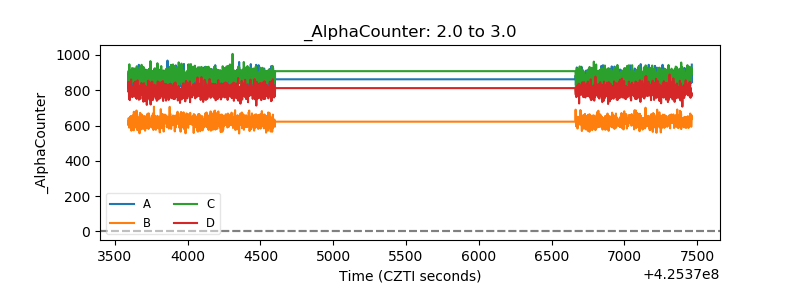 |
| _CPM_Rate | 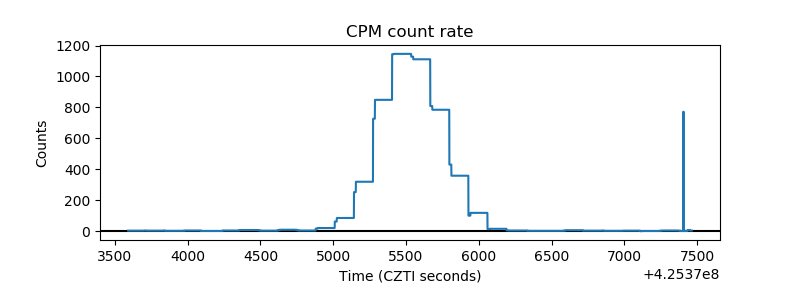 |
| CZT Counter | 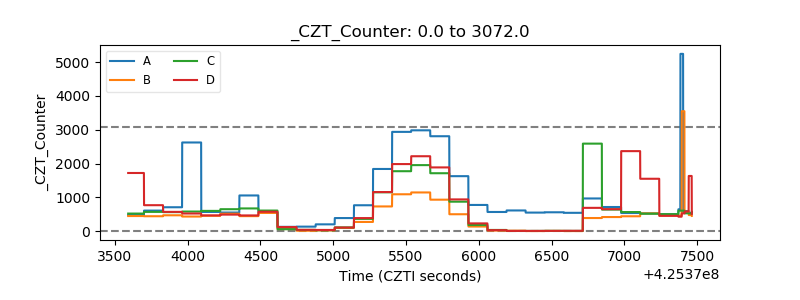 |
| +2.5 Volts monitor | 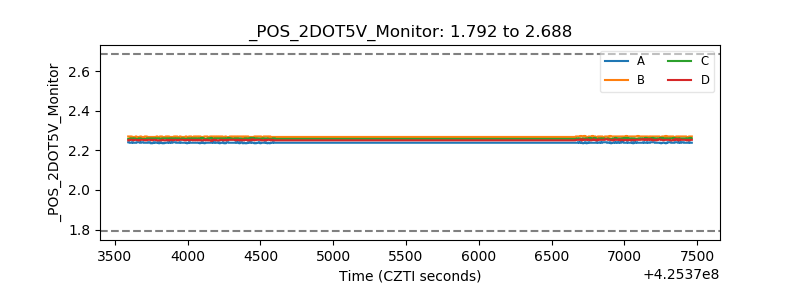 |
| +5 Volts monitor | 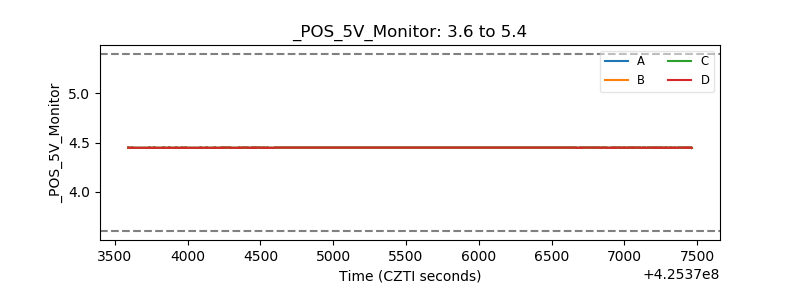 |
| _ROLL_ROT | 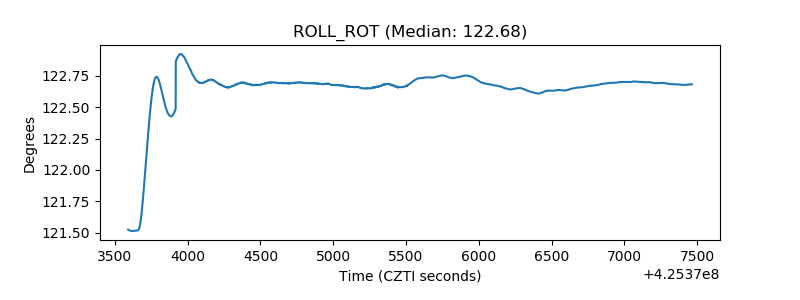 |
| _Roll_DEC | 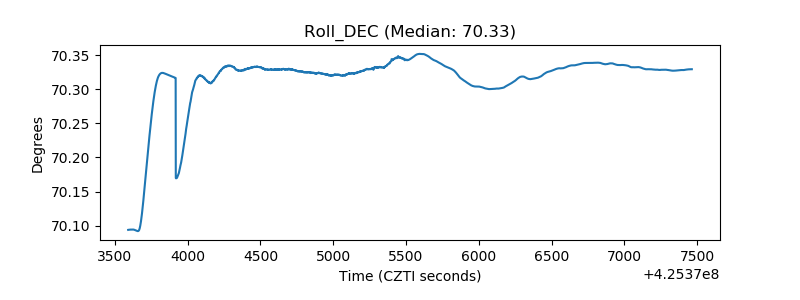 |
| _Roll_RA | 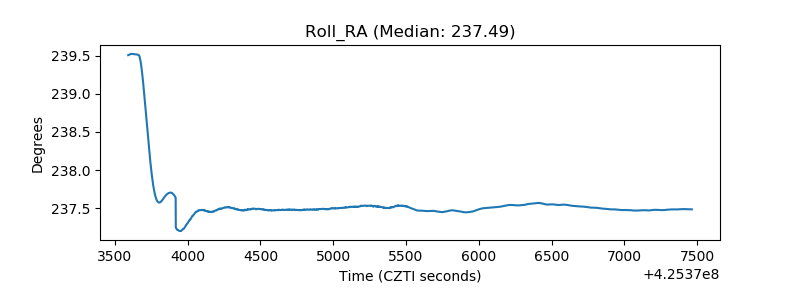 |
| Veto Counter | 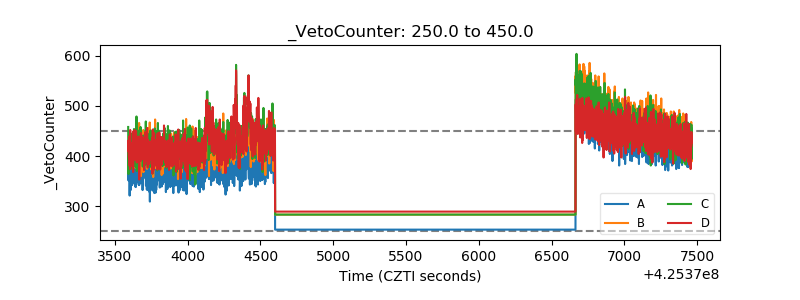 |